| Param | Original file | Final file |
|---|---|---|
| Filename | modeM0/AS1T03_249T01_9000003934_27419cztM0_level2.evt | modeM0/AS1T03_249T01_9000003934_27419cztM0_level2_quad_clean.evt |
| Size (bytes) | 553,898,880 | 82,085,760 |
| Size | 528.2 MB | 78.3 MB |
| Events in quadrant A | 3,501,428 | 509,875 |
| Events in quadrant B | 3,633,435 | 509,453 |
| Events in quadrant C | 3,624,274 | 489,157 |
| Events in quadrant D | 5,530,333 | 478,742 |
| Mode M0 | |||
|---|---|---|---|
| Quadrant | BADHDUFLAG | Total packets | Discarded packets |
| A | 0 | 14763 | 0 |
| B | 0 | 15010 | 0 |
| C | 0 | 15062 | 0 |
| D | 0 | 21413 | 0 |
| Mode M9 | |||
|---|---|---|---|
| Quadrant | BADHDUFLAG | Total packets | Discarded packets |
| A | 0 | 5 | 0 |
| B | 0 | 5 | 0 |
| C | 0 | 5 | 0 |
| D | 0 | 5 | 0 |
| Quadrant | Total seconds | Saturated seconds | Saturation percentage |
|---|---|---|---|
| A | 7161 | 105 | 1.466276% |
| B | 7162 | 127 | 1.773248% |
| C | 7162 | 161 | 2.247975% |
| D | 7161 | 310 | 4.329004% |
Noise dominated data is calculated using 1-second bins in cleaned event files. If a bin has >2000 counts, and if more than 50% of those come from <1% of pixels, then it is considered to be noise-dominated and hence unusable.
| Quadrant | # 1 sec bins | Bins with >0 counts | Bins with >2000 counts | High rate bins dominated by noise | Noise dominated (total time) | Noise dominated (detector-on time) | Marked lightcurve |
|---|---|---|---|---|---|---|---|
| A | 7616 | 7161 | 0 | 0 | 0.00% | 0.00% | 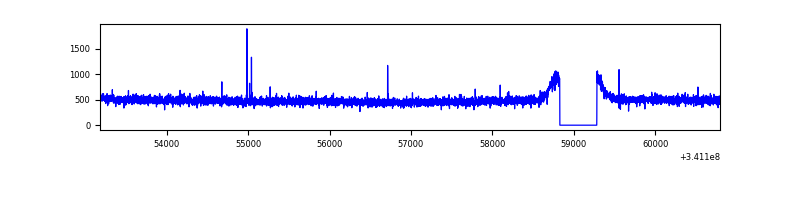 |
| B | 7617 | 7162 | 1 | 1 | 0.01% | 0.01% | 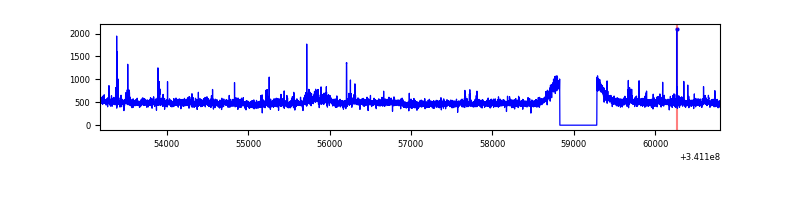 |
| C | 7617 | 7162 | 10 | 10 | 0.13% | 0.14% | 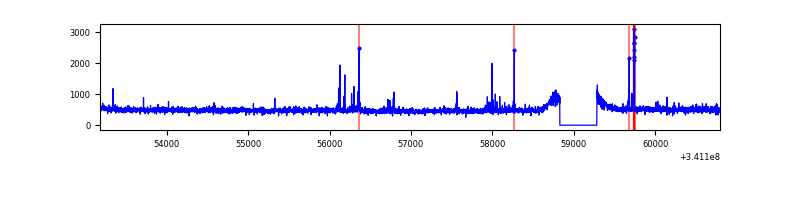 |
| D | 7616 | 7162 | 179 | 179 | 2.35% | 2.50% | 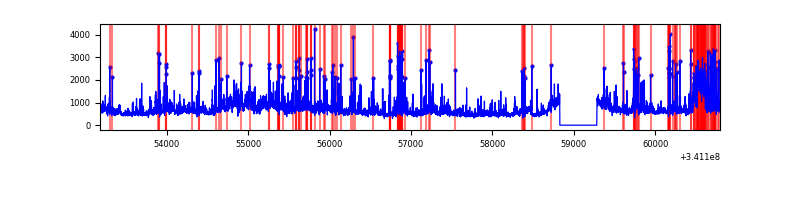 |
Top three noisy pixels from each quadrant. If the there are fewer than three noisy pixels in the level2.evt file, extra rows are filled as -1
| Pixel properties | Quadrant properties | ||||||
|---|---|---|---|---|---|---|---|
| Quadrant | DetID | PixID | Counts | Sigma | Mean | Median | Sigma |
| A | 13 | 254 | 11580 | 58.97 | 903 | 885 | 181.3 |
| A | 3 | 137 | 8831 | 43.82 | 903 | 885 | 181.3 |
| A | 0 | 226 | 7694 | 37.55 | 903 | 885 | 181.3 |
| B | 7 | 205 | 52975 | 305.16 | 888 | 865 | 170.8 |
| B | 0 | 190 | 32202 | 183.51 | 888 | 865 | 170.8 |
| B | 4 | 200 | 21457 | 120.59 | 888 | 865 | 170.8 |
| C | 14 | 238 | 135699 | 663.18 | 859 | 863 | 203.3 |
| C | 2 | 16 | 70551 | 342.76 | 859 | 863 | 203.3 |
| C | 3 | 233 | 42103 | 202.84 | 859 | 863 | 203.3 |
| D | 1 | 52 | 1799771 | 8581.89 | 866 | 844 | 209.6 |
| D | 2 | 250 | 208499 | 990.63 | 866 | 844 | 209.6 |
| D | 12 | 227 | 175378 | 832.62 | 866 | 844 | 209.6 |
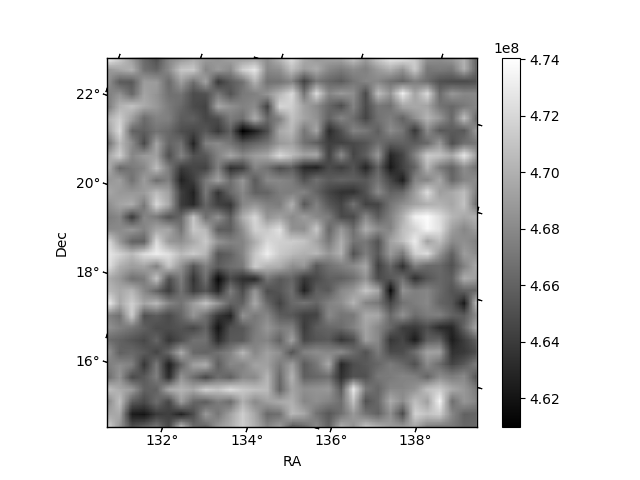
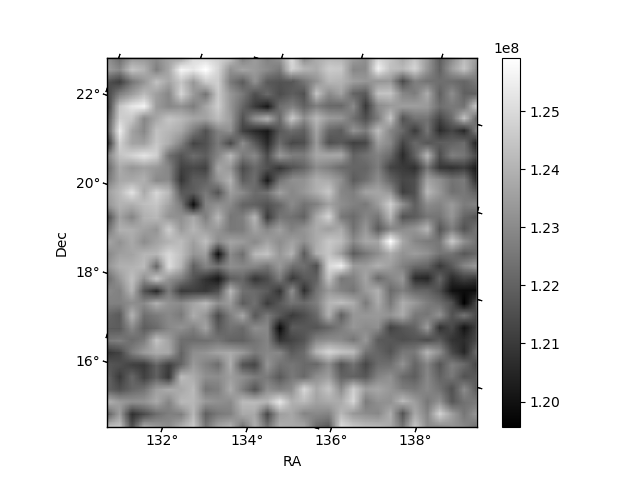
Histogram calculated using DETX and DETY for each event in the final _common_clean file
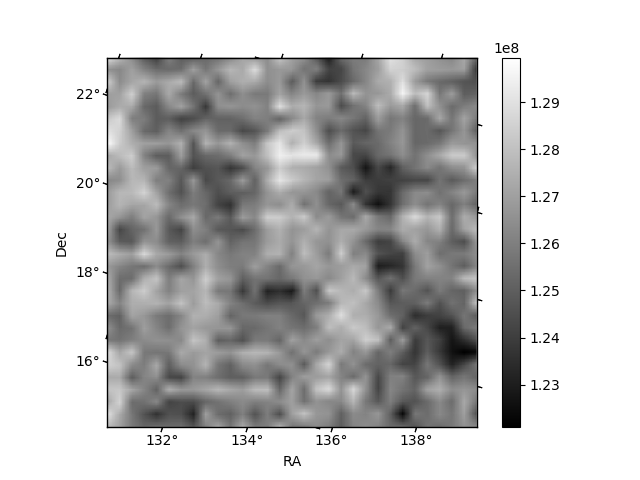
| Quadrant A | 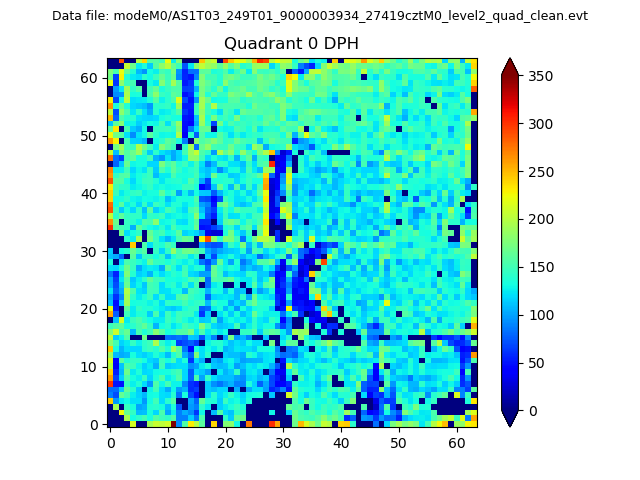 |
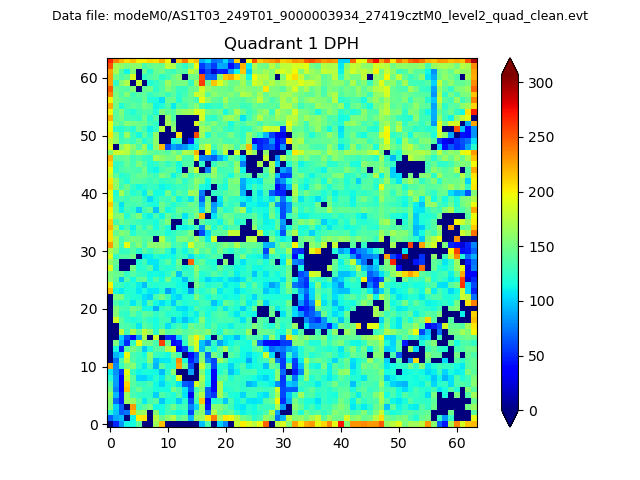 |
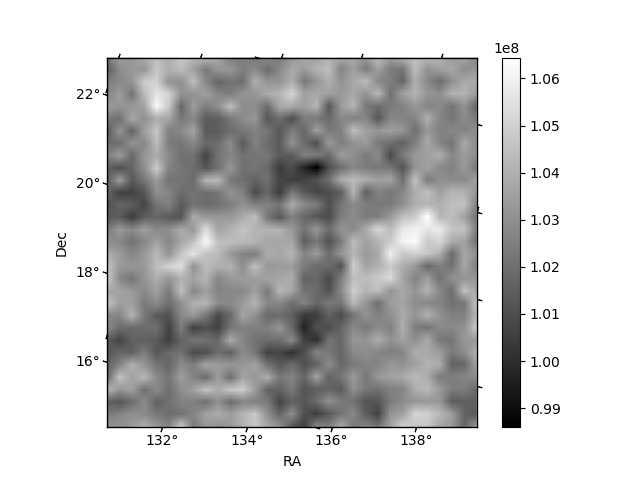
Quadrant B |
|---|---|---|---|
| Quadrant D |  |
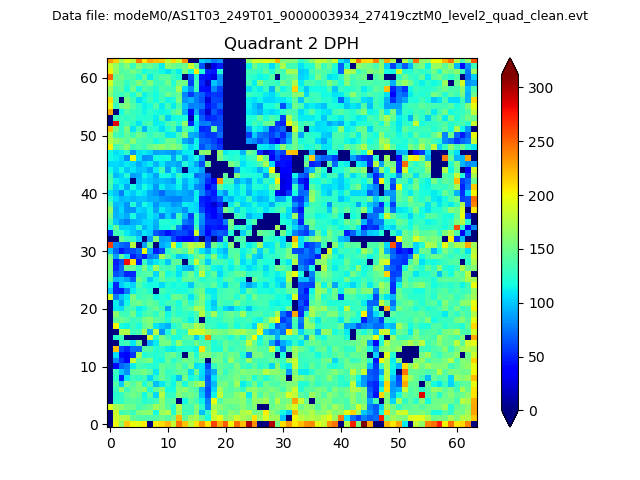 |
Quadrant C |
| Plot type | Count rate plots | Images |
|---|---|---|
| Comparison with Poisson distribution Blue bars denote a histogram of data divided into 1 sec bins. Red curve is a Poisson curve with rate = median count rate of data. |
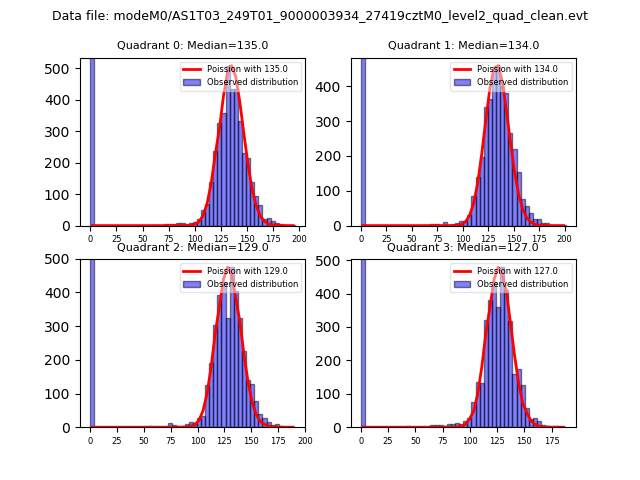 |
 |
| Quadrant-wise count rates Data is divided into 100 sec bins |
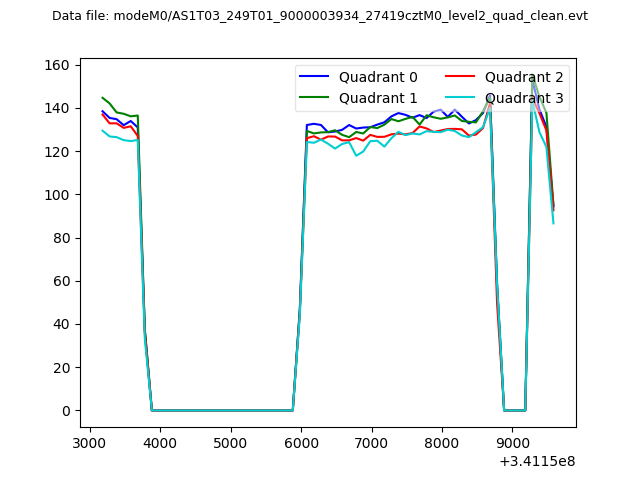 |
|
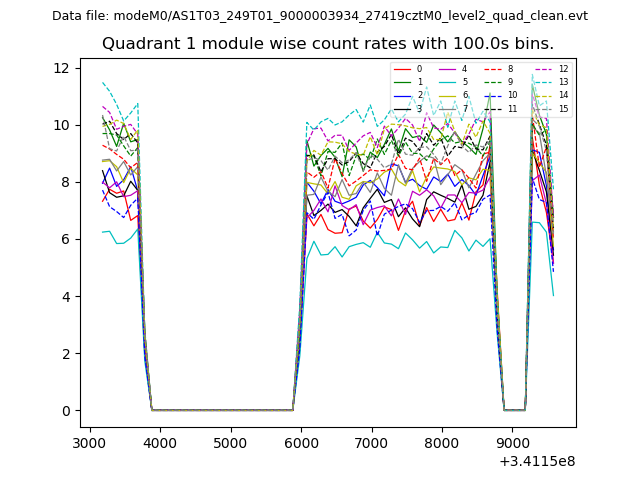
| Module-wise count rates for Quadrant A Data is divided into 100 sec bins |
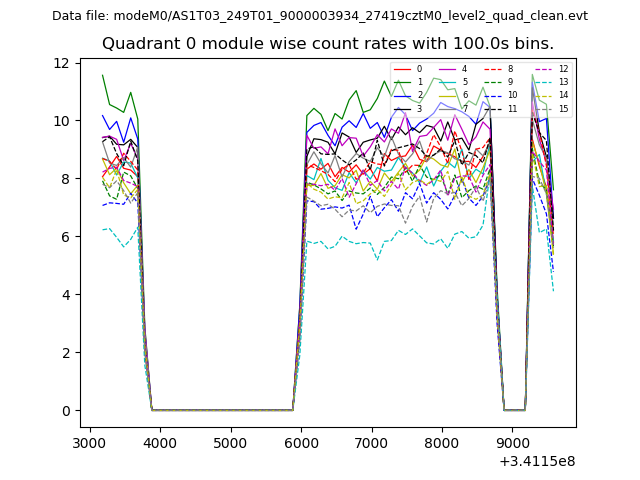 |
 |
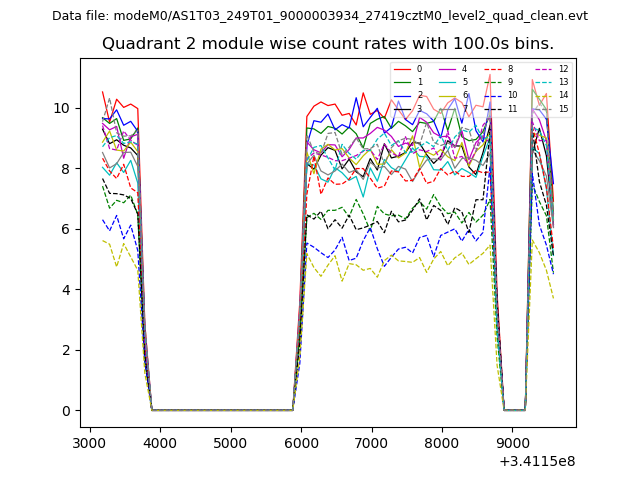
| Module-wise count rates for Quadrant B Data is divided into 100 sec bins |
 |
 |
| Module-wise count rates for Quadrant C Data is divided into 100 sec bins |
 |
 |
| Module-wise count rates for Quadrant D Data is divided into 100 sec bins |
 |
 |
| Parameter | Plot |
|---|---|
| CZT HV Monitor | 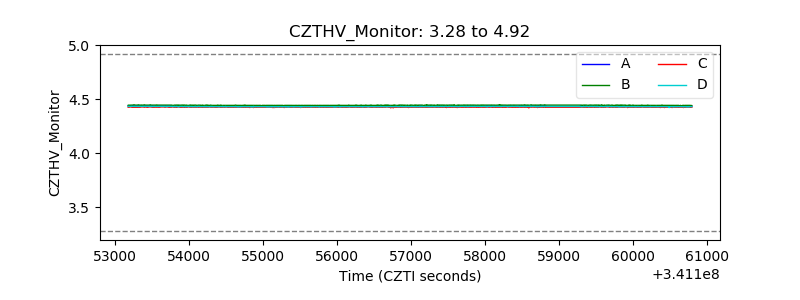 |
| D_VDD | 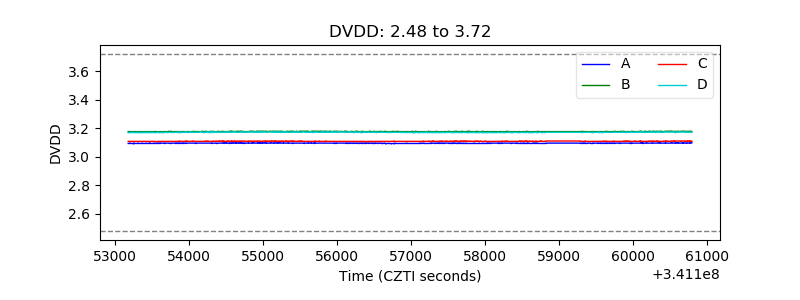 |
| Temperature 1 | 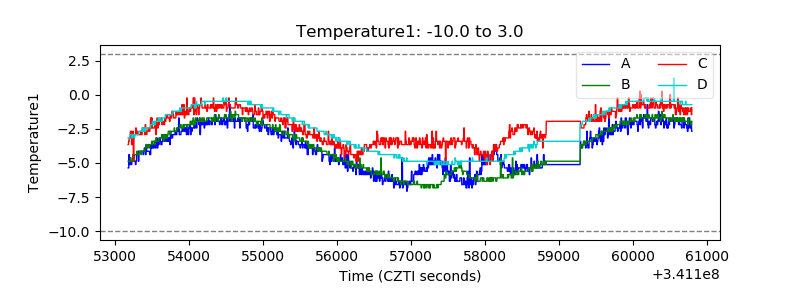 |
| Veto HV Monitor | 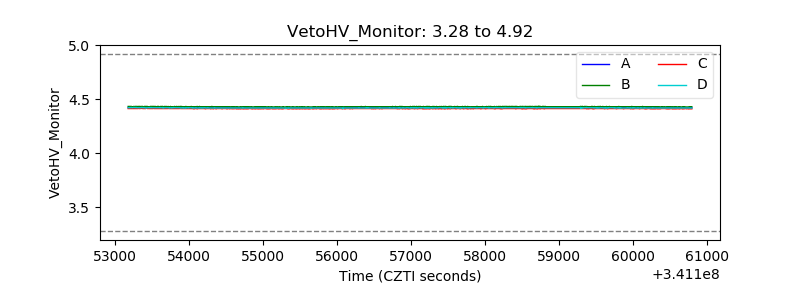 |
| Veto LLD | 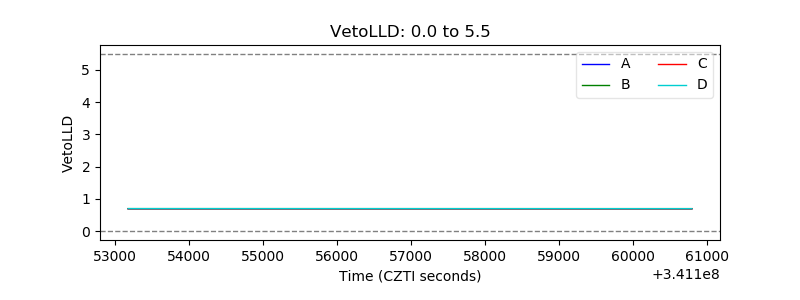 |
| Alpha Counter | 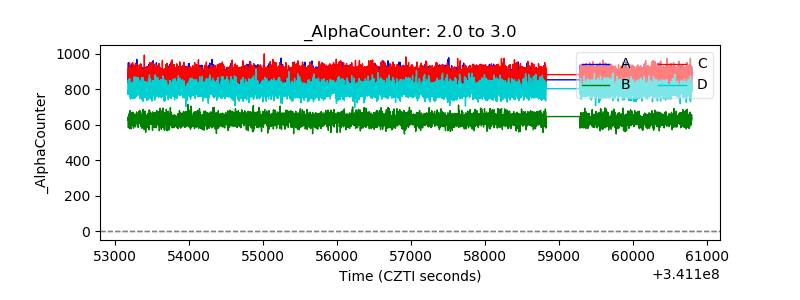 |
| _CPM_Rate | 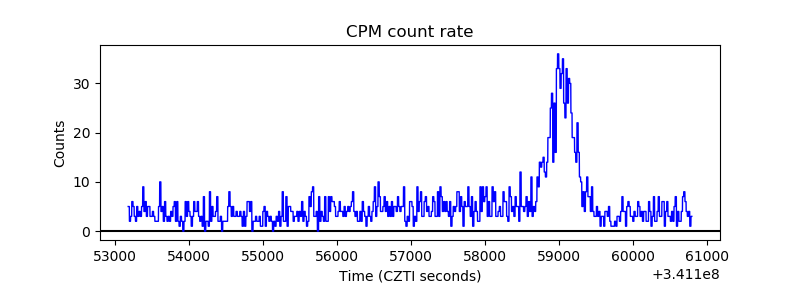 |
| CZT Counter | 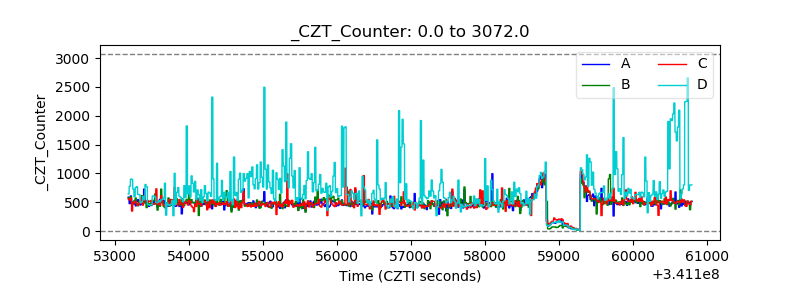 |
| +2.5 Volts monitor | 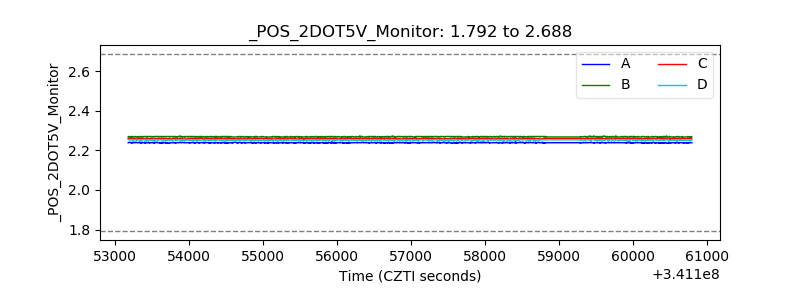 |
| +5 Volts monitor | 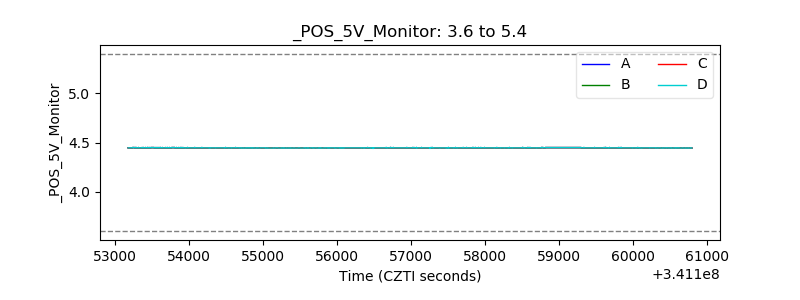 |
| _ROLL_ROT | 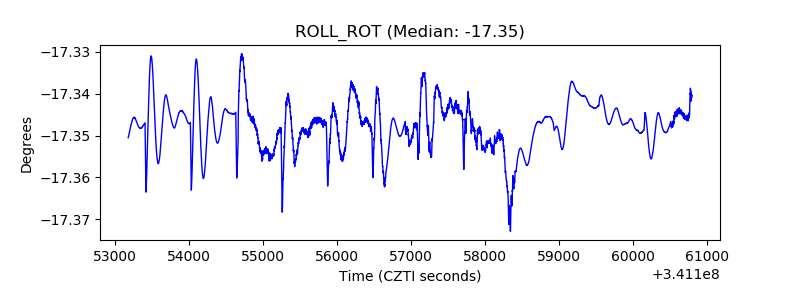 |
| _Roll_DEC | 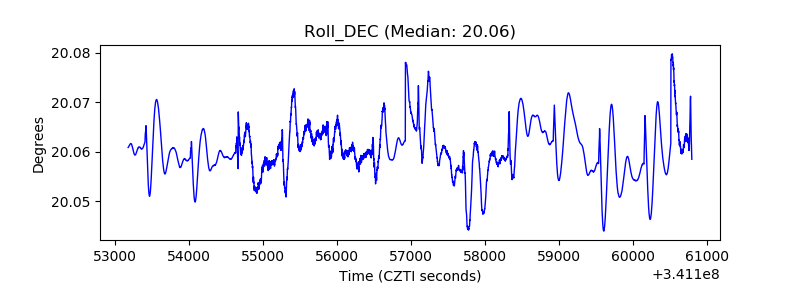 |
| _Roll_RA | 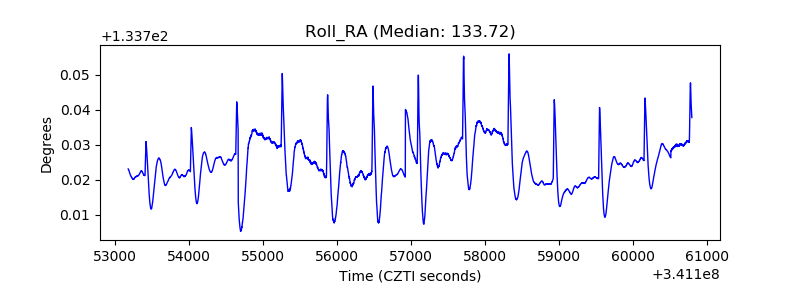 |
| Veto Counter | 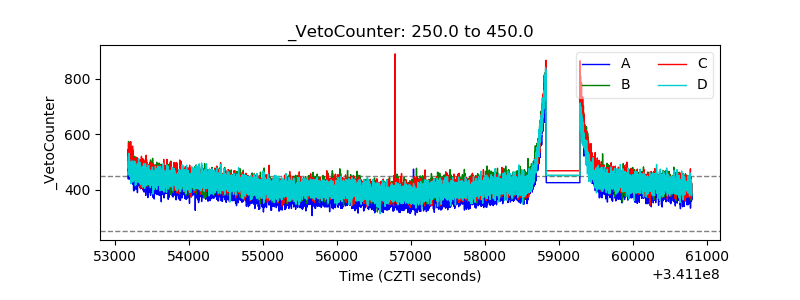 |