| Param | Original file | Final file |
|---|---|---|
| Filename | modeM0/AS1T03_249T01_9000003934_27420cztM0_level2.evt | modeM0/AS1T03_249T01_9000003934_27420cztM0_level2_quad_clean.evt |
| Size (bytes) | 558,604,800 | 75,427,200 |
| Size | 532.7 MB | 71.9 MB |
| Events in quadrant A | 3,514,347 | 457,997 |
| Events in quadrant B | 3,606,580 | 454,765 |
| Events in quadrant C | 3,597,126 | 435,837 |
| Events in quadrant D | 5,708,699 | 431,802 |
| Mode M0 | |||
|---|---|---|---|
| Quadrant | BADHDUFLAG | Total packets | Discarded packets |
| A | 0 | 14960 | 0 |
| B | 0 | 15161 | 0 |
| C | 0 | 15148 | 0 |
| D | 0 | 21971 | 0 |
| Mode M9 | |||
|---|---|---|---|
| Quadrant | BADHDUFLAG | Total packets | Discarded packets |
| A | 0 | 2 | 0 |
| B | 0 | 2 | 0 |
| C | 0 | 2 | 0 |
| D | 0 | 2 | 0 |
| Quadrant | Total seconds | Saturated seconds | Saturation percentage |
|---|---|---|---|
| A | 7226 | 142 | 1.965126% |
| B | 7226 | 165 | 2.283421% |
| C | 7227 | 202 | 2.795074% |
| D | 7227 | 408 | 5.645496% |
Noise dominated data is calculated using 1-second bins in cleaned event files. If a bin has >2000 counts, and if more than 50% of those come from <1% of pixels, then it is considered to be noise-dominated and hence unusable.
| Quadrant | # 1 sec bins | Bins with >0 counts | Bins with >2000 counts | High rate bins dominated by noise | Noise dominated (total time) | Noise dominated (detector-on time) | Marked lightcurve |
|---|---|---|---|---|---|---|---|
| A | 7481 | 7226 | 0 | 0 | 0.00% | 0.00% | 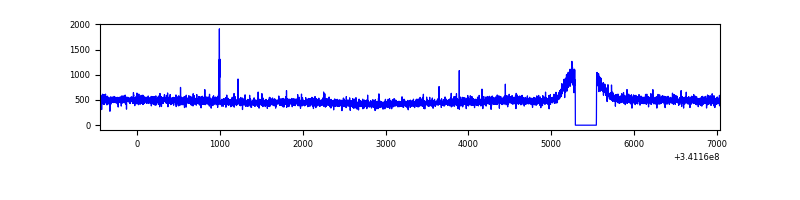 |
| B | 7481 | 7226 | 4 | 4 | 0.05% | 0.06% | 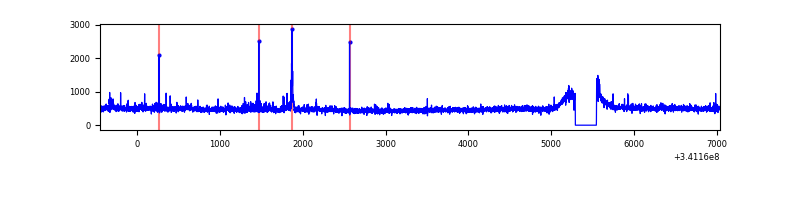 |
| C | 7482 | 7227 | 9 | 9 | 0.12% | 0.12% | 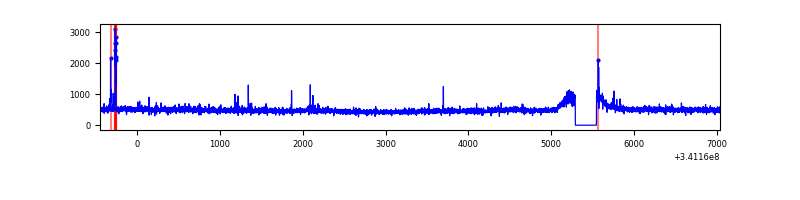 |
| D | 7482 | 7227 | 255 | 255 | 3.41% | 3.53% | 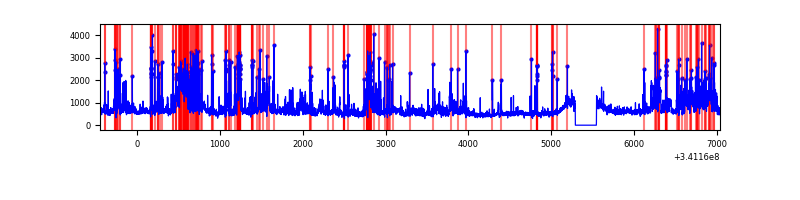 |
Top three noisy pixels from each quadrant. If the there are fewer than three noisy pixels in the level2.evt file, extra rows are filled as -1
| Pixel properties | Quadrant properties | ||||||
|---|---|---|---|---|---|---|---|
| Quadrant | DetID | PixID | Counts | Sigma | Mean | Median | Sigma |
| A | 13 | 254 | 11825 | 59.79 | 907 | 889 | 182.9 |
| A | 0 | 31 | 10559 | 52.87 | 907 | 889 | 182.9 |
| A | 3 | 137 | 8829 | 43.41 | 907 | 889 | 182.9 |
| B | 0 | 190 | 34496 | 194.81 | 891 | 869 | 172.6 |
| B | 15 | 32 | 33344 | 188.14 | 891 | 869 | 172.6 |
| B | 4 | 200 | 24397 | 136.3 | 891 | 869 | 172.6 |
| C | 14 | 238 | 136179 | 661.94 | 863 | 870 | 204.4 |
| C | 2 | 16 | 68786 | 332.25 | 863 | 870 | 204.4 |
| C | 3 | 233 | 21155 | 99.24 | 863 | 870 | 204.4 |
| D | 1 | 52 | 2066989 | 9916.88 | 868 | 846 | 208.3 |
| D | 2 | 250 | 253900 | 1214.59 | 868 | 846 | 208.3 |
| D | 12 | 227 | 74165 | 351.91 | 868 | 846 | 208.3 |
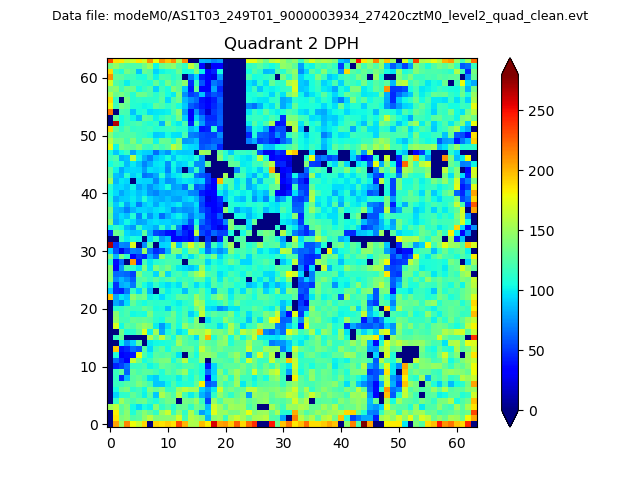
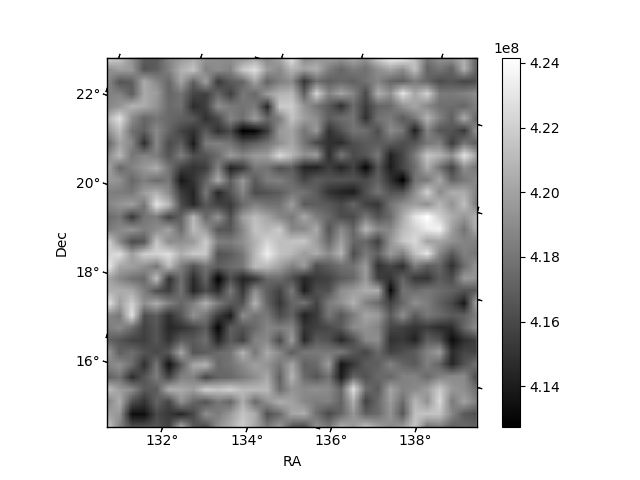
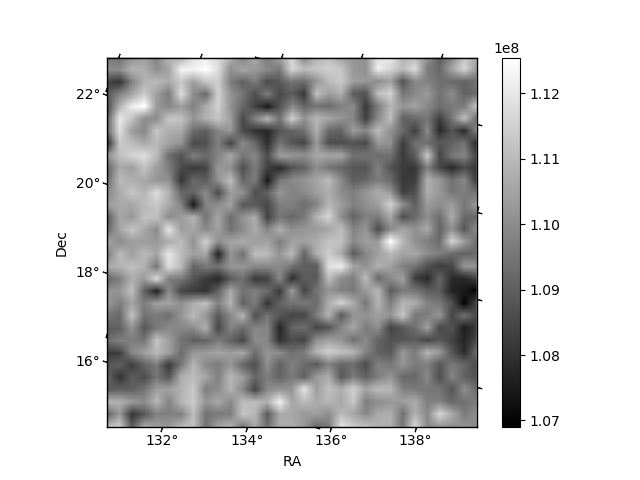
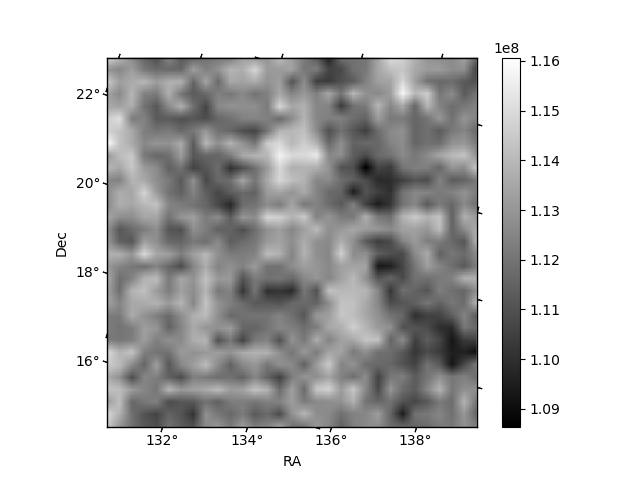
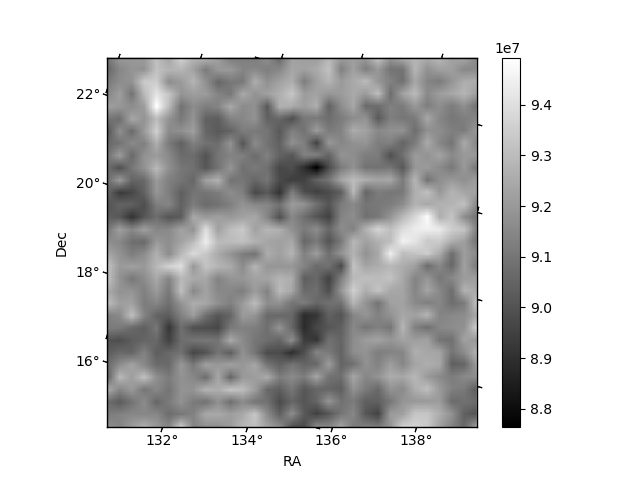
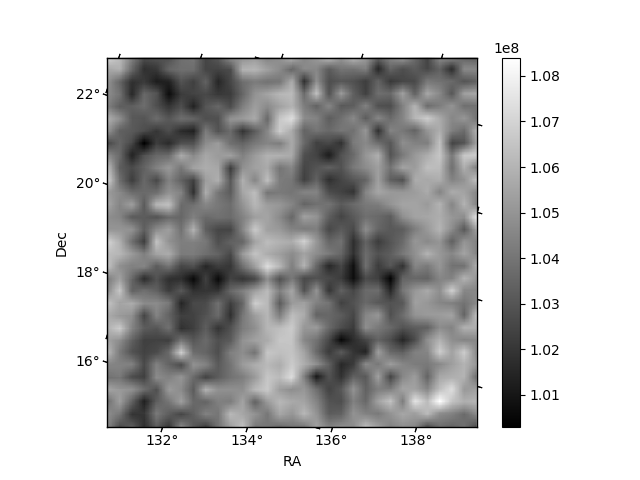
Histogram calculated using DETX and DETY for each event in the final _common_clean file
| Quadrant A | 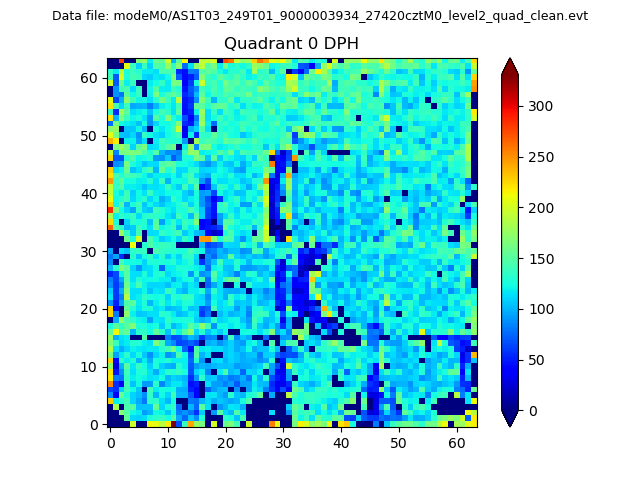 |
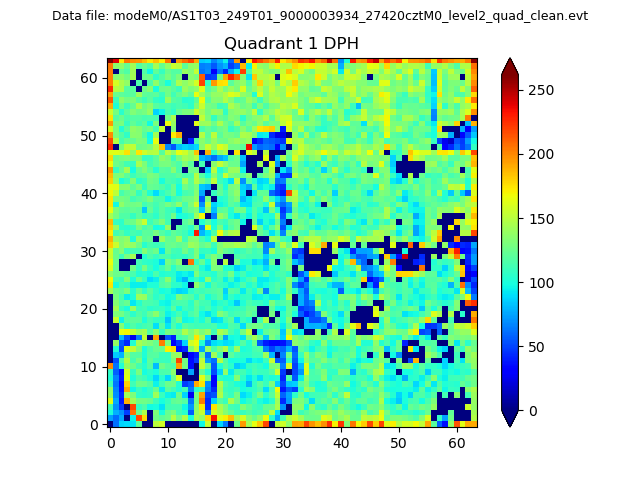 |
Quadrant B |
|---|---|---|---|
| Quadrant D | 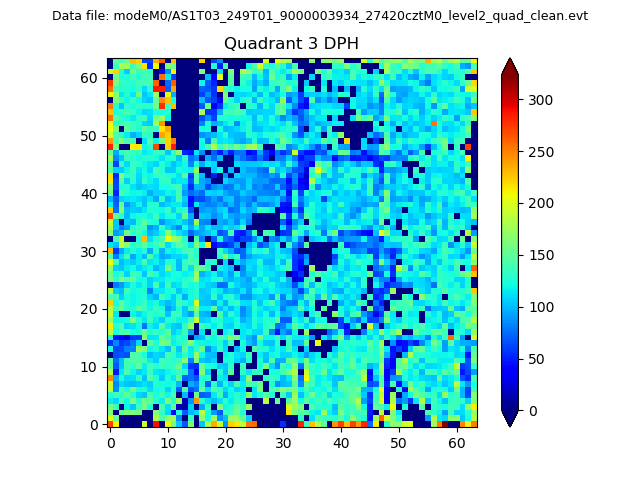 |
 |
Quadrant C |
| Plot type | Count rate plots | Images |
|---|---|---|
| Comparison with Poisson distribution Blue bars denote a histogram of data divided into 1 sec bins. Red curve is a Poisson curve with rate = median count rate of data. |
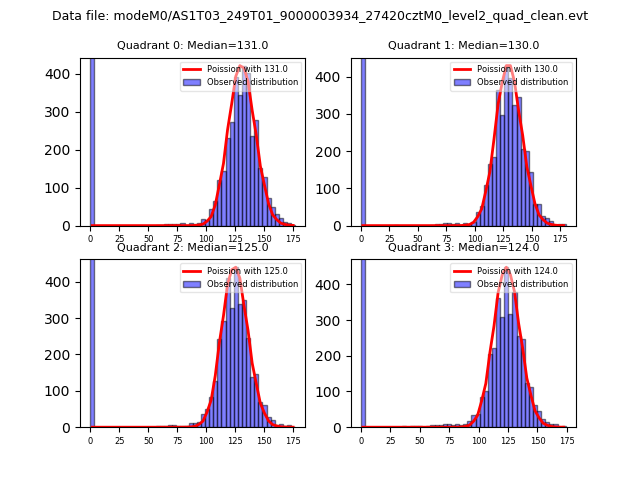 |
 |
| Quadrant-wise count rates Data is divided into 100 sec bins |
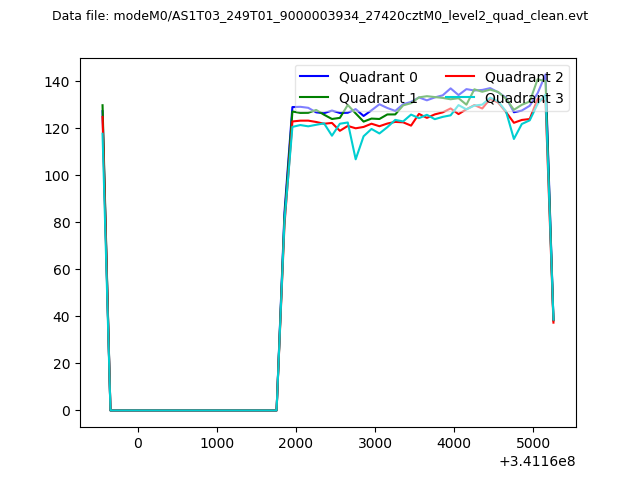 |
|
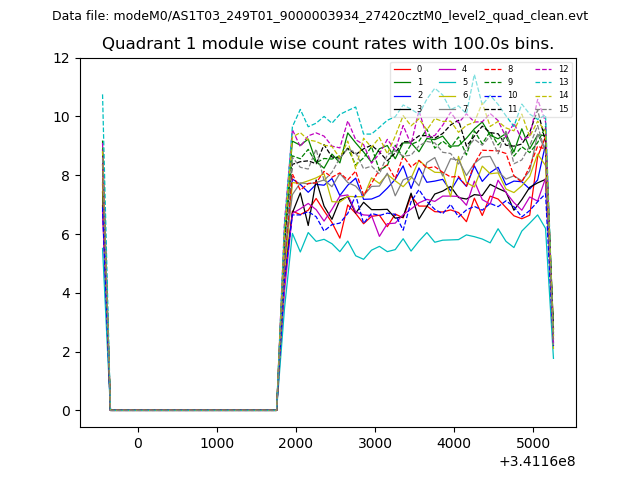
| Module-wise count rates for Quadrant A Data is divided into 100 sec bins |
 |
 |
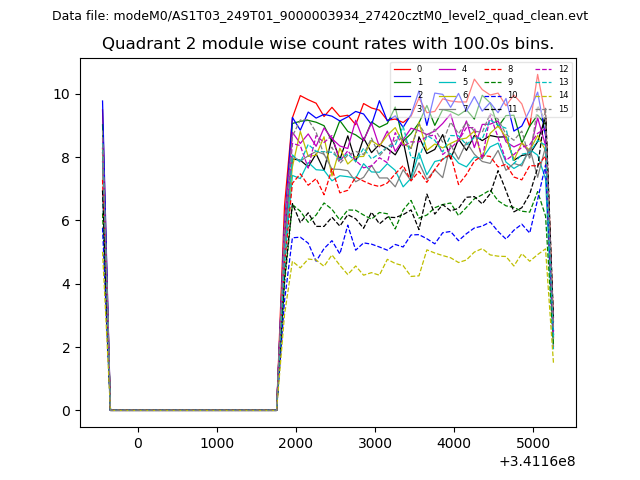
| Module-wise count rates for Quadrant B Data is divided into 100 sec bins |
 |
 |
| Module-wise count rates for Quadrant C Data is divided into 100 sec bins |
 |
 |
| Module-wise count rates for Quadrant D Data is divided into 100 sec bins |
 |
 |
| Parameter | Plot |
|---|---|
| CZT HV Monitor | 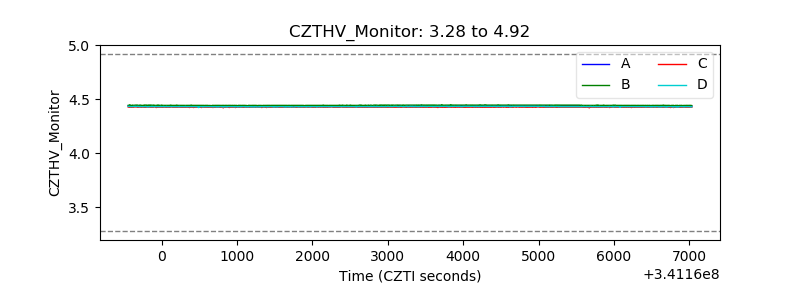 |
| D_VDD | 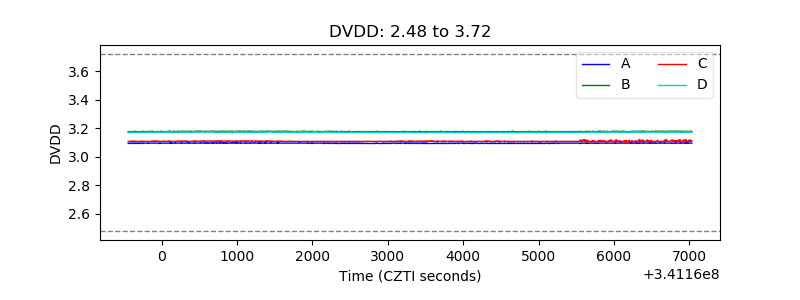 |
| Temperature 1 | 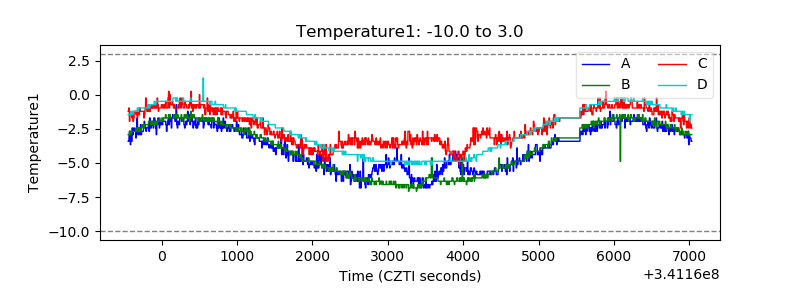 |
| Veto HV Monitor | 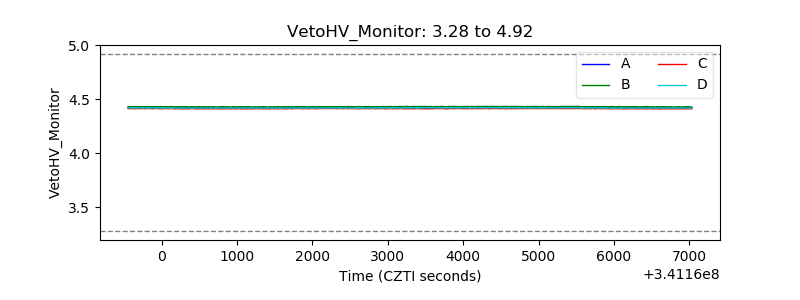 |
| Veto LLD | 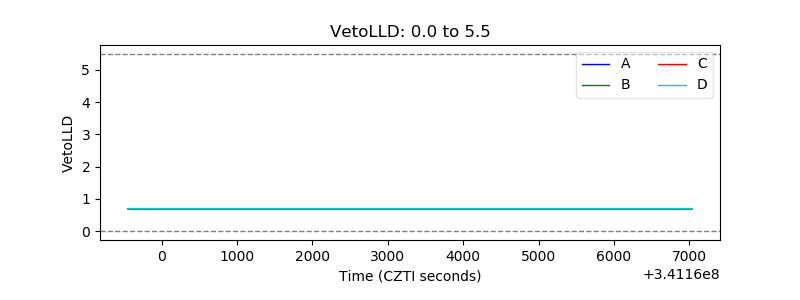 |
| Alpha Counter | 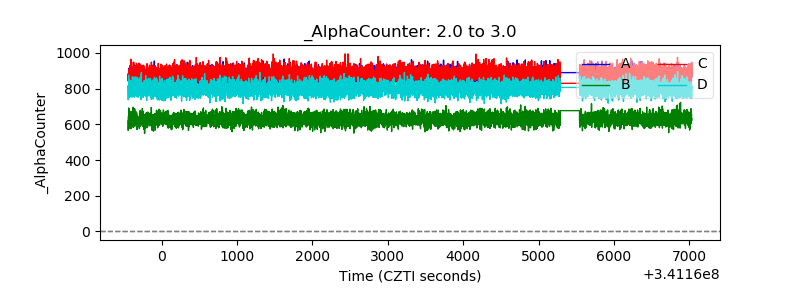 |
| _CPM_Rate | 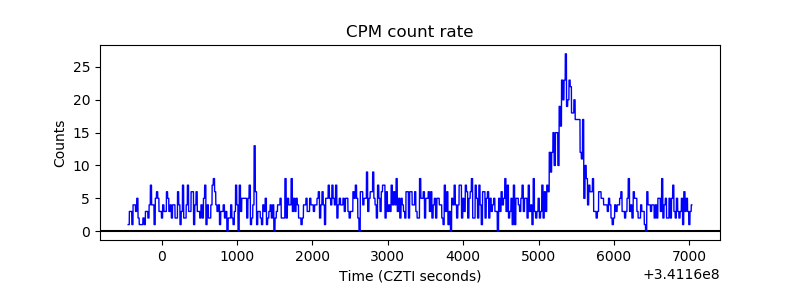 |
| CZT Counter | 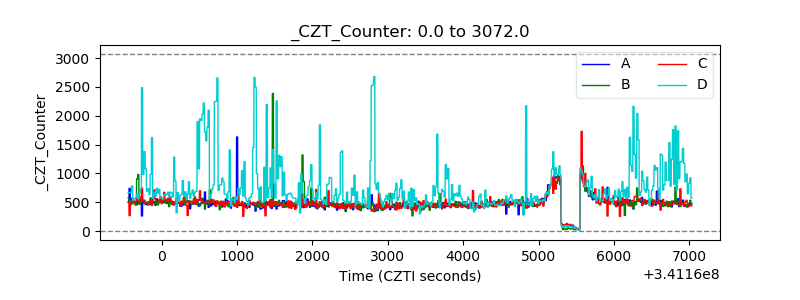 |
| +2.5 Volts monitor |  |
| +5 Volts monitor |  |
| _ROLL_ROT | 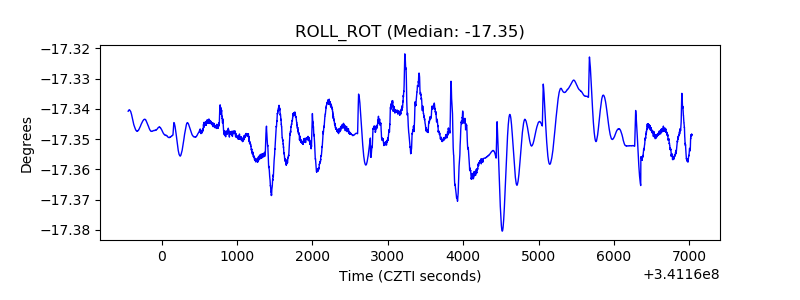 |
| _Roll_DEC | 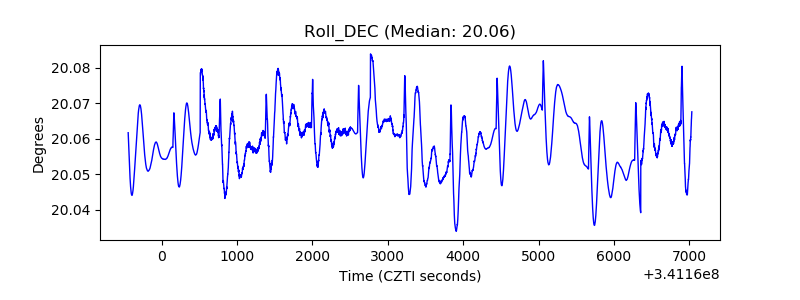 |
| _Roll_RA | 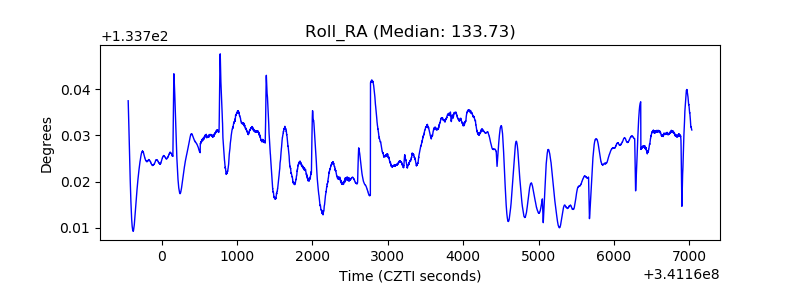 |
| Veto Counter | 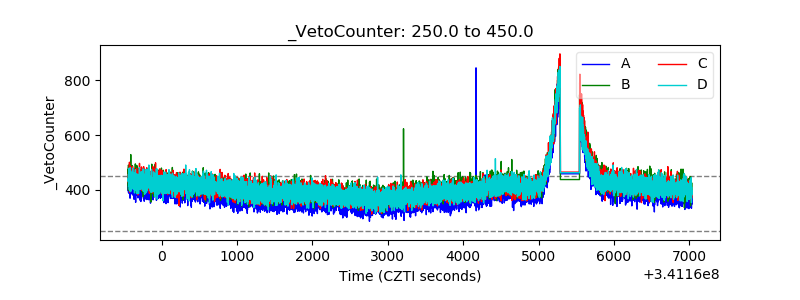 |