| Param | Original file | Final file |
|---|---|---|
| Filename | modeM0/AS1T03_249T01_9000003934_27421cztM0_level2.evt | modeM0/AS1T03_249T01_9000003934_27421cztM0_level2_quad_clean.evt |
| Size (bytes) | 599,731,200 | 79,542,720 |
| Size | 571.9 MB | 75.9 MB |
| Events in quadrant A | 3,765,728 | 486,314 |
| Events in quadrant B | 3,850,338 | 482,629 |
| Events in quadrant C | 4,076,853 | 457,806 |
| Events in quadrant D | 5,951,325 | 449,477 |
| Mode M0 | |||
|---|---|---|---|
| Quadrant | BADHDUFLAG | Total packets | Discarded packets |
| A | 0 | 16005 | 0 |
| B | 0 | 16215 | 0 |
| C | 0 | 16800 | 0 |
| D | 0 | 22999 | 0 |
| Mode M9 | |||
|---|---|---|---|
| Quadrant | BADHDUFLAG | Total packets | Discarded packets |
| A | 0 | 7 | 0 |
| B | 0 | 7 | 0 |
| C | 0 | 7 | 0 |
| D | 0 | 7 | 0 |
| Quadrant | Total seconds | Saturated seconds | Saturation percentage |
|---|---|---|---|
| A | 7655 | 173 | 2.259961% |
| B | 7650 | 206 | 2.692810% |
| C | 7644 | 285 | 3.728414% |
| D | 7635 | 532 | 6.967911% |
Noise dominated data is calculated using 1-second bins in cleaned event files. If a bin has >2000 counts, and if more than 50% of those come from <1% of pixels, then it is considered to be noise-dominated and hence unusable.
| Quadrant | # 1 sec bins | Bins with >0 counts | Bins with >2000 counts | High rate bins dominated by noise | Noise dominated (total time) | Noise dominated (detector-on time) | Marked lightcurve |
|---|---|---|---|---|---|---|---|
| A | 8373 | 7681 | 2 | 2 | 0.02% | 0.03% | 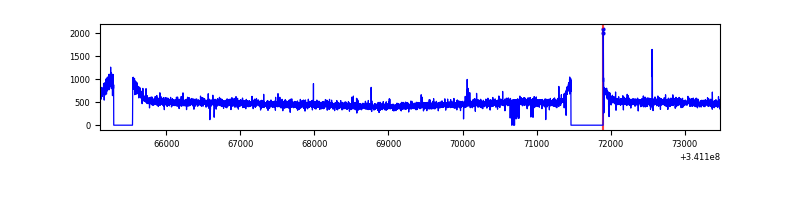 |
| B | 8373 | 7682 | 0 | 0 | 0.00% | 0.00% | 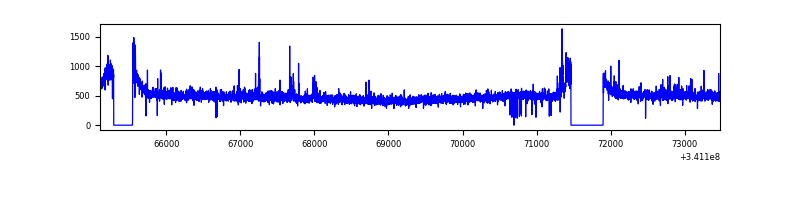 |
| C | 8372 | 7681 | 32 | 32 | 0.38% | 0.42% | 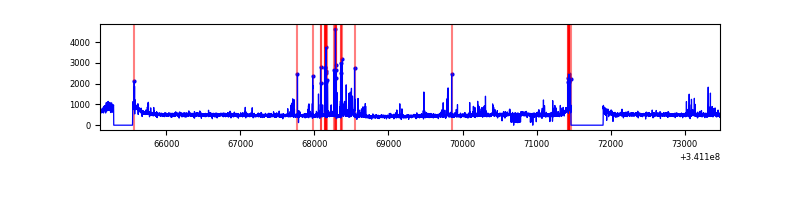 |
| D | 8372 | 7677 | 346 | 346 | 4.13% | 4.51% | 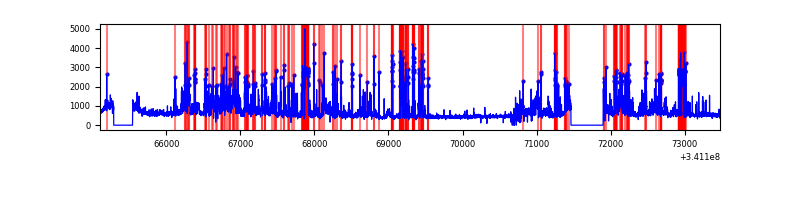 |
Top three noisy pixels from each quadrant. If the there are fewer than three noisy pixels in the level2.evt file, extra rows are filled as -1
| Pixel properties | Quadrant properties | ||||||
|---|---|---|---|---|---|---|---|
| Quadrant | DetID | PixID | Counts | Sigma | Mean | Median | Sigma |
| A | 13 | 254 | 12724 | 59.51 | 971 | 948 | 197.9 |
| A | 3 | 137 | 9366 | 42.54 | 971 | 948 | 197.9 |
| A | 0 | 226 | 8311 | 37.21 | 971 | 948 | 197.9 |
| B | 0 | 190 | 54134 | 283.77 | 956 | 929 | 187.5 |
| B | 12 | 111 | 22989 | 117.66 | 956 | 929 | 187.5 |
| B | 11 | 111 | 20656 | 105.22 | 956 | 929 | 187.5 |
| C | 2 | 16 | 321459 | 1467.52 | 919 | 924 | 218.4 |
| C | 14 | 238 | 145307 | 661.03 | 919 | 924 | 218.4 |
| C | 8 | 128 | 12373 | 52.42 | 919 | 924 | 218.4 |
| D | 1 | 52 | 2060147 | 9217.63 | 923 | 895 | 223.4 |
| D | 2 | 250 | 204432 | 911.07 | 923 | 895 | 223.4 |
| D | 12 | 227 | 92684 | 410.87 | 923 | 895 | 223.4 |
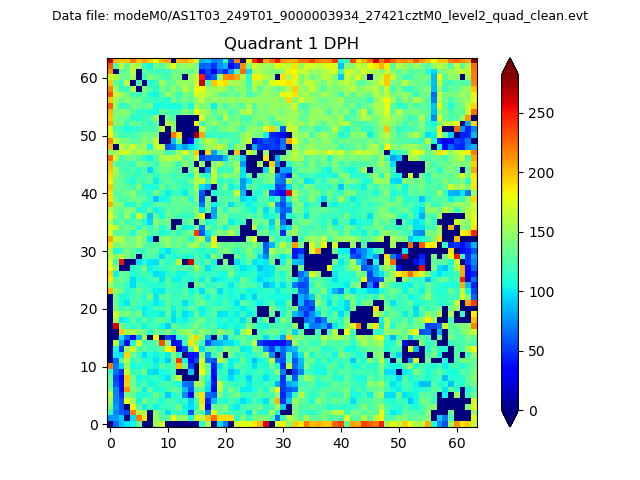
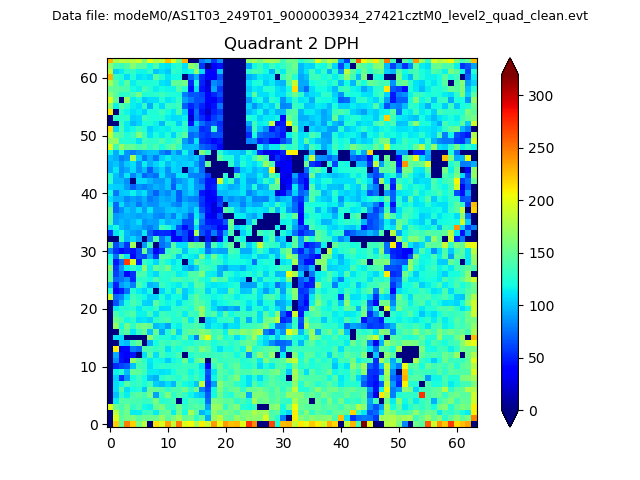
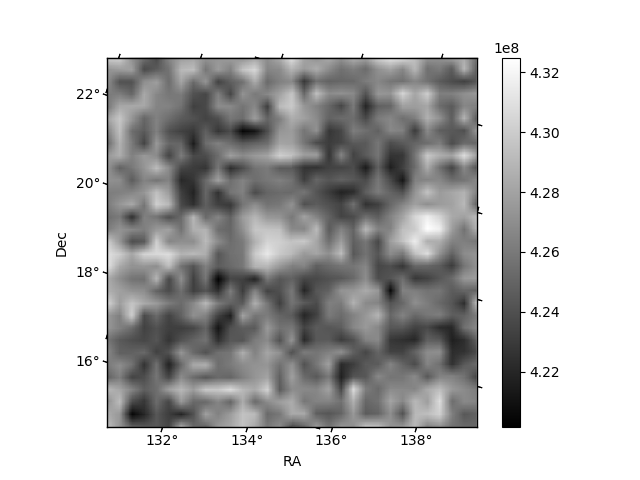
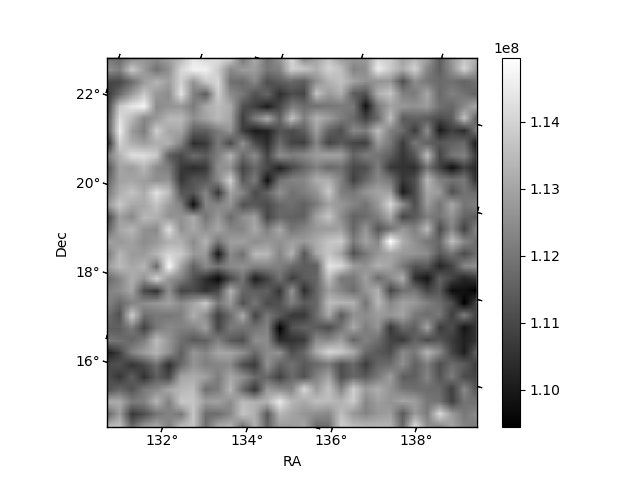
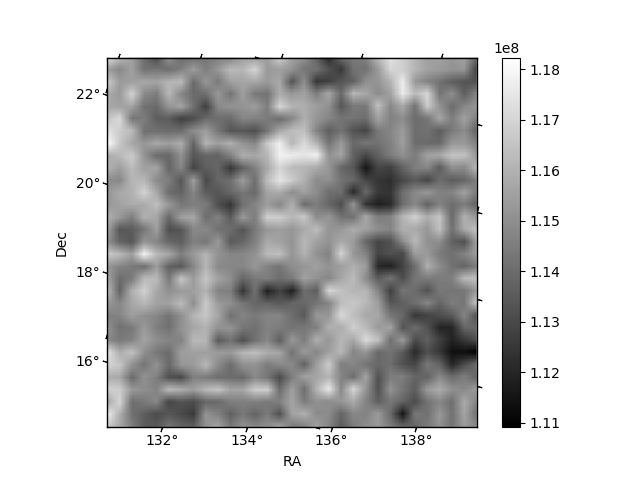
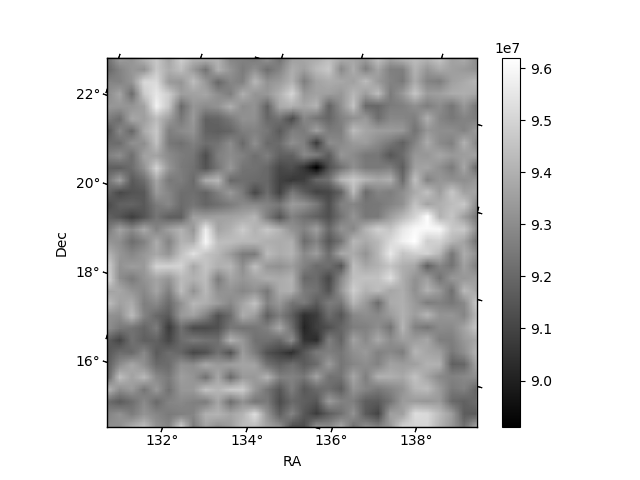
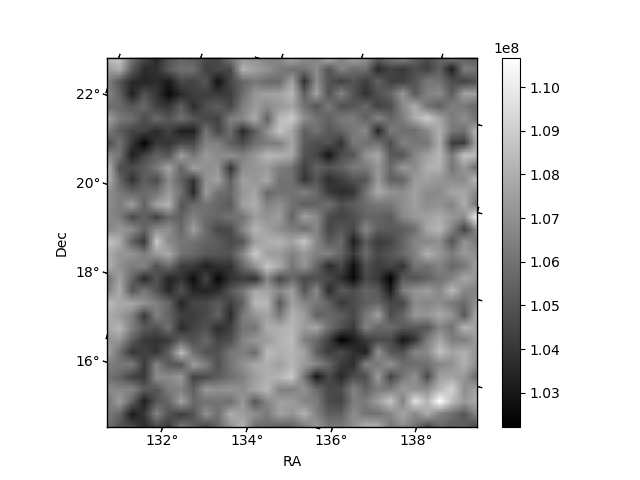
Histogram calculated using DETX and DETY for each event in the final _common_clean file
| Quadrant A |  |
 |
Quadrant B |
|---|---|---|---|
| Quadrant D | 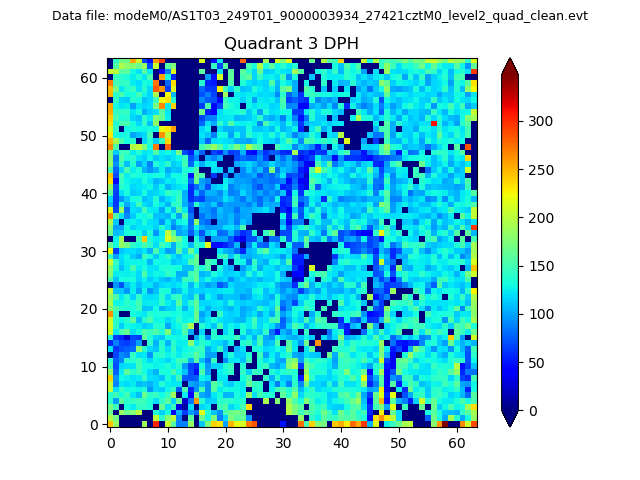 |
 |
Quadrant C |
| Plot type | Count rate plots | Images |
|---|---|---|
| Comparison with Poisson distribution Blue bars denote a histogram of data divided into 1 sec bins. Red curve is a Poisson curve with rate = median count rate of data. |
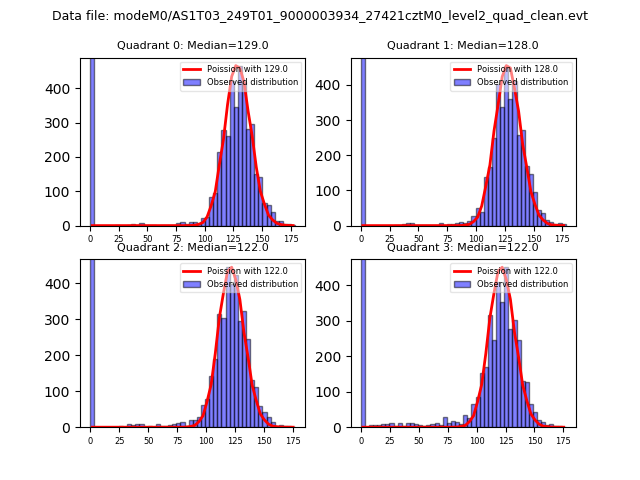 |
 |
| Quadrant-wise count rates Data is divided into 100 sec bins |
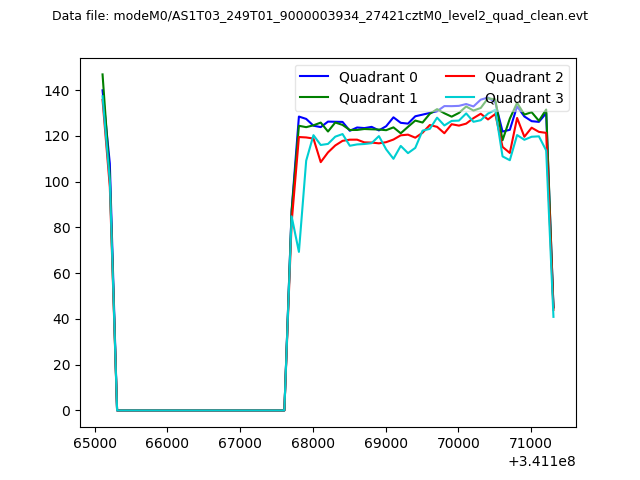 |
|
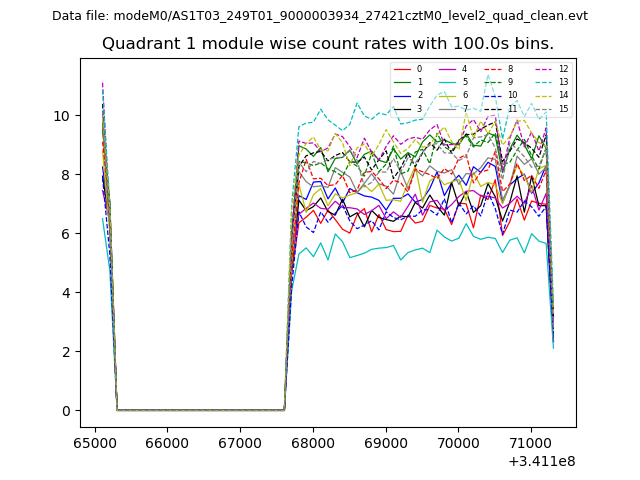
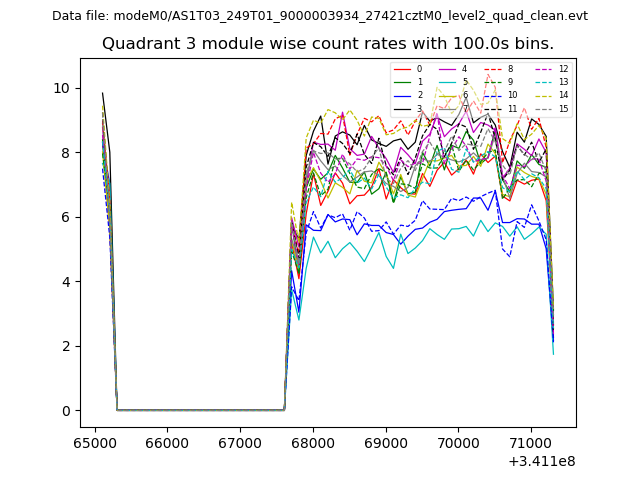
| Module-wise count rates for Quadrant A Data is divided into 100 sec bins |
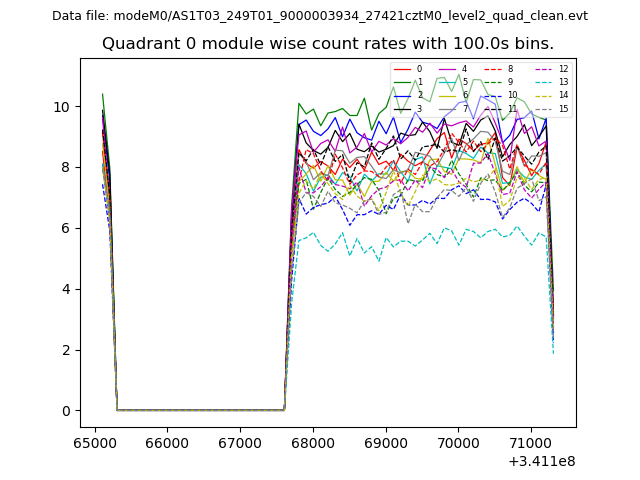 |
 |
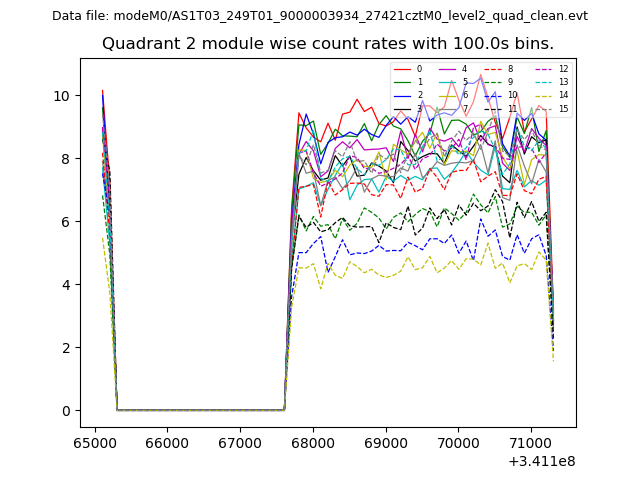
| Module-wise count rates for Quadrant B Data is divided into 100 sec bins |
 |
 |
| Module-wise count rates for Quadrant C Data is divided into 100 sec bins |
 |
 |
| Module-wise count rates for Quadrant D Data is divided into 100 sec bins |
 |
 |
| Parameter | Plot |
|---|---|
| CZT HV Monitor | 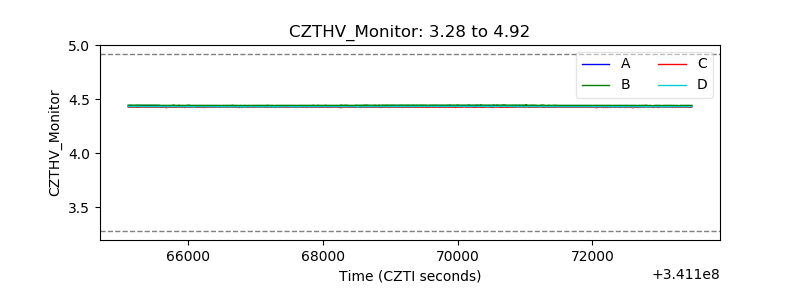 |
| D_VDD | 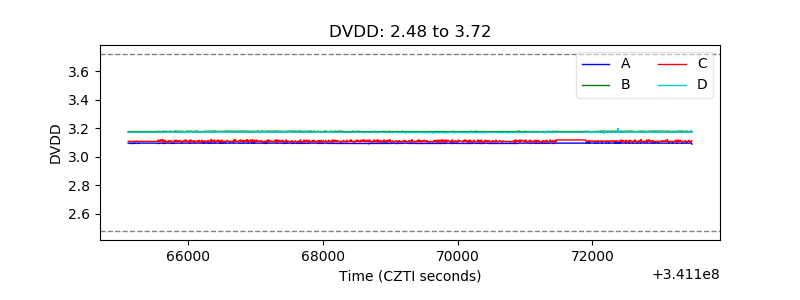 |
| Temperature 1 | 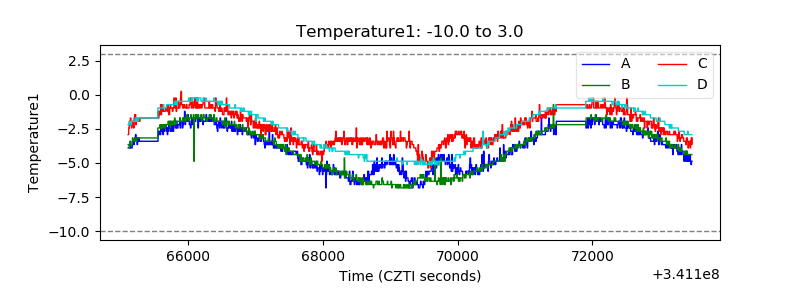 |
| Veto HV Monitor | 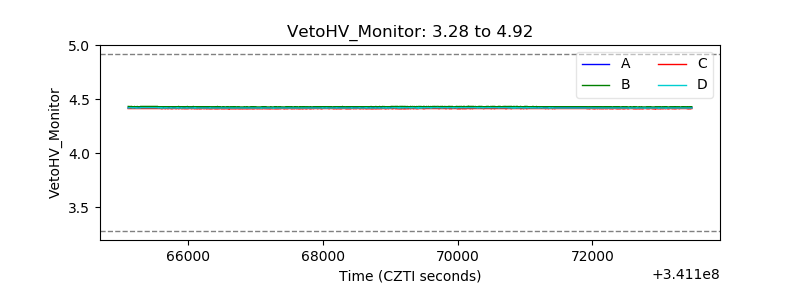 |
| Veto LLD | 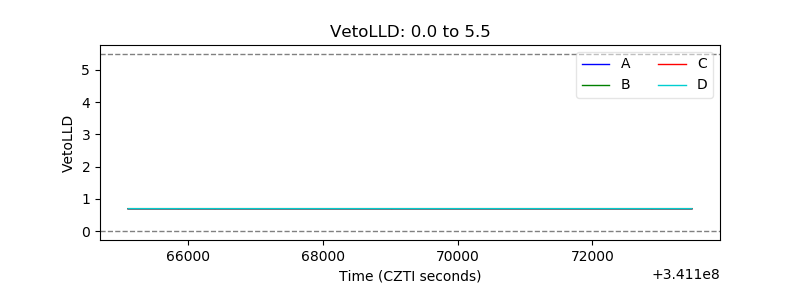 |
| Alpha Counter | 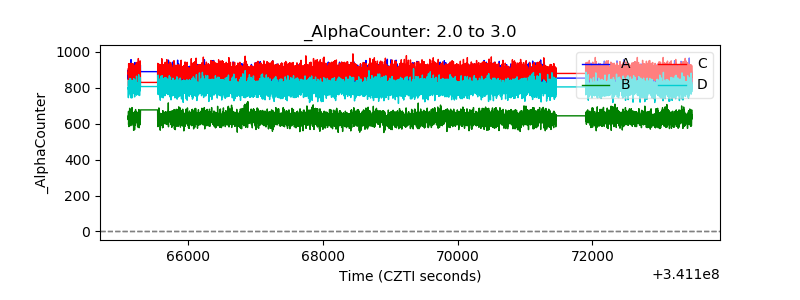 |
| _CPM_Rate | 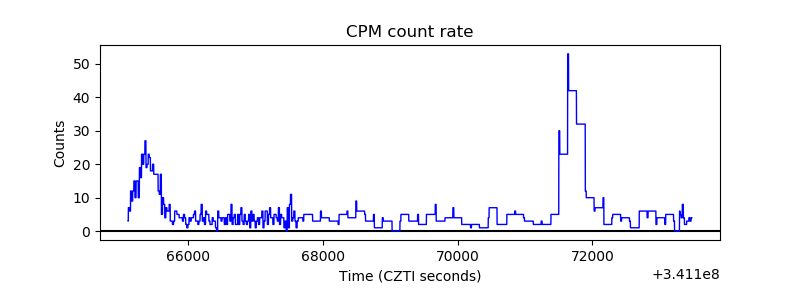 |
| CZT Counter | 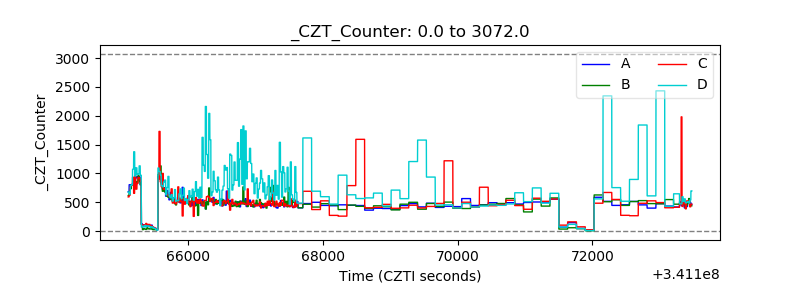 |
| +2.5 Volts monitor |  |
| +5 Volts monitor |  |
| _ROLL_ROT | 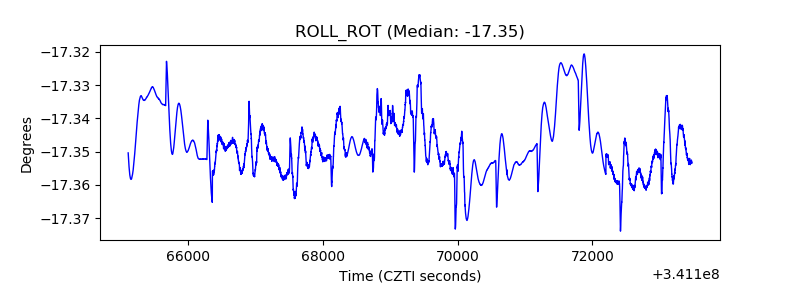 |
| _Roll_DEC | 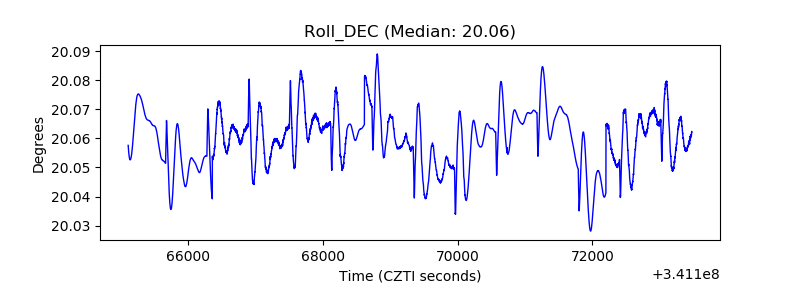 |
| _Roll_RA |  |
| Veto Counter | 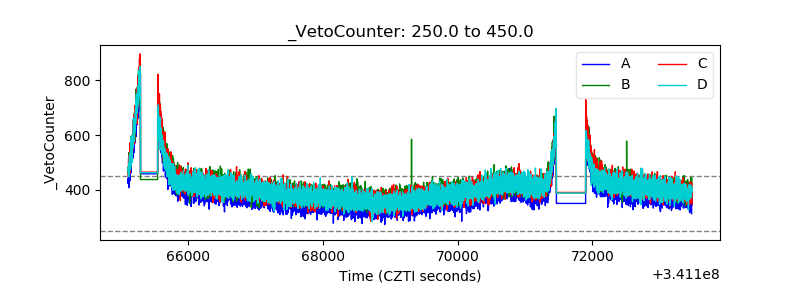 |