| Param | Original file | Final file |
|---|---|---|
| Filename | modeM0/AS1T03_249T01_9000003934_27424cztM0_level2.evt | modeM0/AS1T03_249T01_9000003934_27424cztM0_level2_quad_clean.evt |
| Size (bytes) | 358,493,760 | 62,285,760 |
| Size | 341.9 MB | 59.4 MB |
| Events in quadrant A | 2,302,966 | 397,706 |
| Events in quadrant B | 2,388,001 | 393,282 |
| Events in quadrant C | 2,683,733 | 369,787 |
| Events in quadrant D | 3,145,004 | 377,889 |
| Mode M0 | |||
|---|---|---|---|
| Quadrant | BADHDUFLAG | Total packets | Discarded packets |
| A | 0 | 10158 | 0 |
| B | 0 | 10357 | 0 |
| C | 0 | 11238 | 0 |
| D | 0 | 12775 | 0 |
| Mode M9 | |||
|---|---|---|---|
| Quadrant | BADHDUFLAG | Total packets | Discarded packets |
| A | 0 | 5 | 0 |
| B | 0 | 5 | 0 |
| C | 0 | 5 | 0 |
| D | 0 | 5 | 0 |
| Quadrant | Total seconds | Saturated seconds | Saturation percentage |
|---|---|---|---|
| A | 4952 | 40 | 0.807754% |
| B | 4952 | 47 | 0.949111% |
| C | 4952 | 164 | 3.311793% |
| D | 4952 | 172 | 3.473344% |
Noise dominated data is calculated using 1-second bins in cleaned event files. If a bin has >2000 counts, and if more than 50% of those come from <1% of pixels, then it is considered to be noise-dominated and hence unusable.
| Quadrant | # 1 sec bins | Bins with >0 counts | Bins with >2000 counts | High rate bins dominated by noise | Noise dominated (total time) | Noise dominated (detector-on time) | Marked lightcurve |
|---|---|---|---|---|---|---|---|
| A | 5387 | 4953 | 2 | 2 | 0.04% | 0.04% | 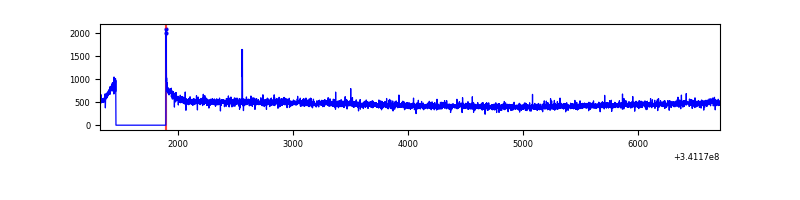 |
| B | 5387 | 4953 | 0 | 0 | 0.00% | 0.00% | 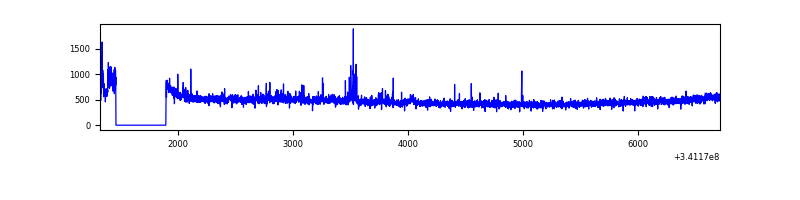 |
| C | 5386 | 4952 | 76 | 76 | 1.41% | 1.53% | 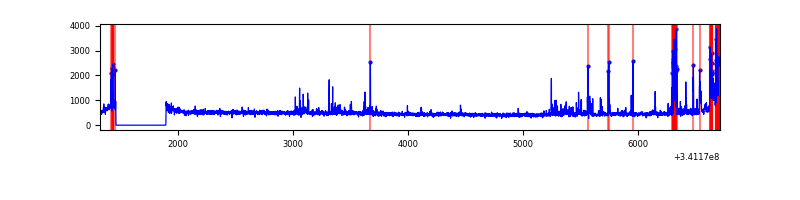 |
| D | 5387 | 4953 | 125 | 125 | 2.32% | 2.52% | 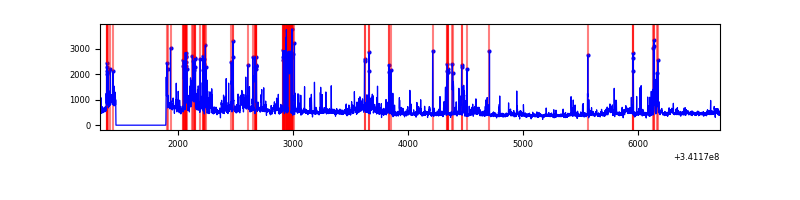 |
Top three noisy pixels from each quadrant. If the there are fewer than three noisy pixels in the level2.evt file, extra rows are filled as -1
| Pixel properties | Quadrant properties | ||||||
|---|---|---|---|---|---|---|---|
| Quadrant | DetID | PixID | Counts | Sigma | Mean | Median | Sigma |
| A | 13 | 254 | 8371 | 64.21 | 593 | 581 | 121.3 |
| A | 8 | 192 | 6987 | 52.8 | 593 | 581 | 121.3 |
| A | 3 | 137 | 5785 | 42.89 | 593 | 581 | 121.3 |
| B | 0 | 190 | 30311 | 259.46 | 586 | 571 | 114.6 |
| B | 0 | 189 | 17243 | 145.45 | 586 | 571 | 114.6 |
| B | 0 | 244 | 16602 | 139.86 | 586 | 571 | 114.6 |
| C | 2 | 16 | 323828 | 2435.39 | 559 | 563 | 132.7 |
| C | 14 | 238 | 88265 | 660.72 | 559 | 563 | 132.7 |
| C | 7 | 221 | 68164 | 509.29 | 559 | 563 | 132.7 |
| D | 1 | 52 | 712114 | 5168.27 | 568 | 552 | 137.7 |
| D | 2 | 250 | 147033 | 1063.93 | 568 | 552 | 137.7 |
| D | 10 | 50 | 86834 | 626.69 | 568 | 552 | 137.7 |
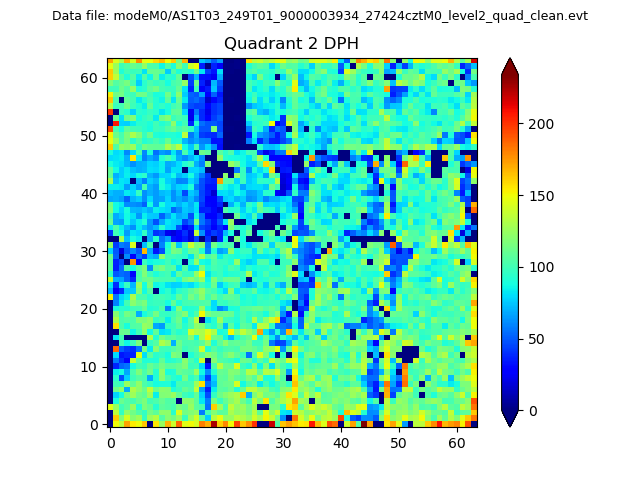
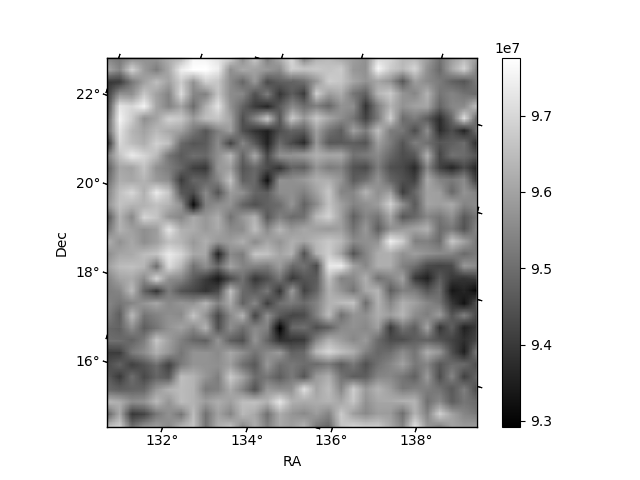
Histogram calculated using DETX and DETY for each event in the final _common_clean file
| Quadrant A | 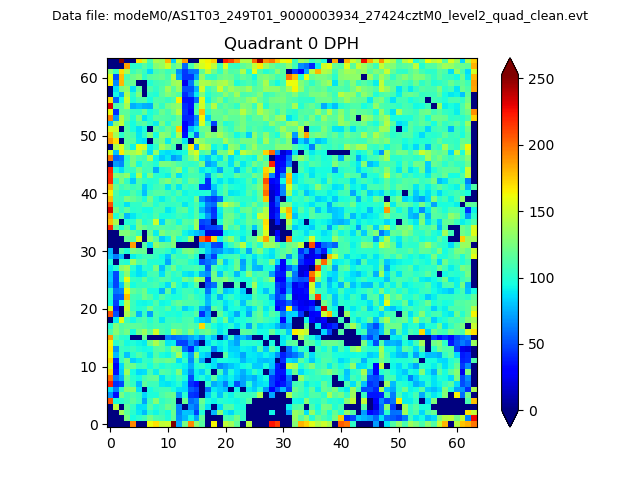 |
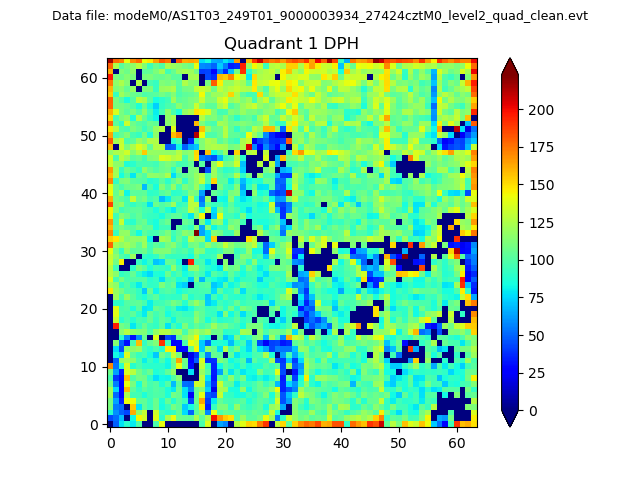 |
Quadrant B |
|---|---|---|---|
| Quadrant D | 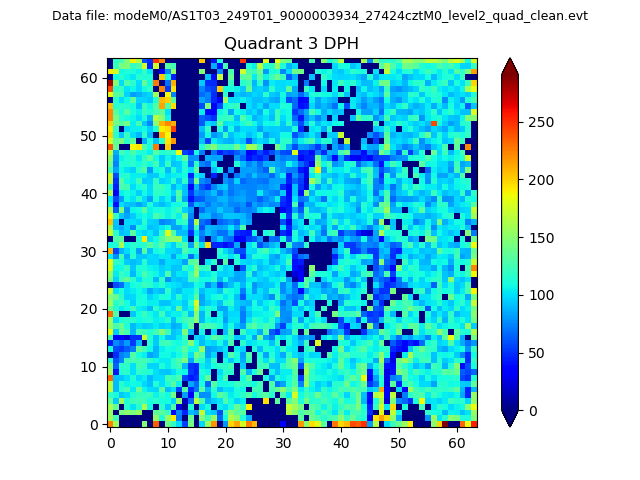 |
 |
Quadrant C |
| Plot type | Count rate plots | Images |
|---|---|---|
| Comparison with Poisson distribution Blue bars denote a histogram of data divided into 1 sec bins. Red curve is a Poisson curve with rate = median count rate of data. |
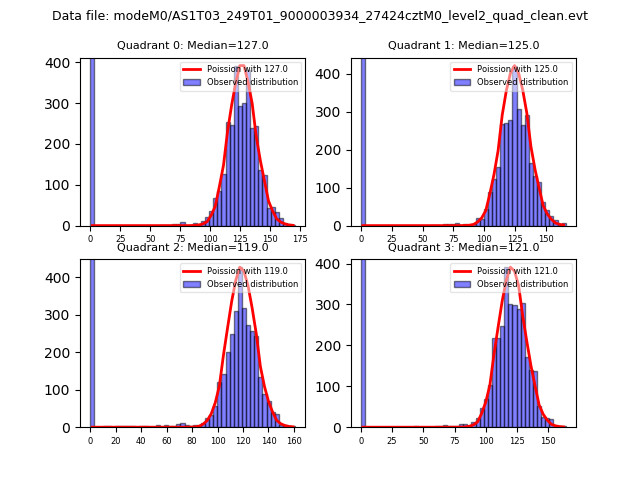 |
 |
| Quadrant-wise count rates Data is divided into 100 sec bins |
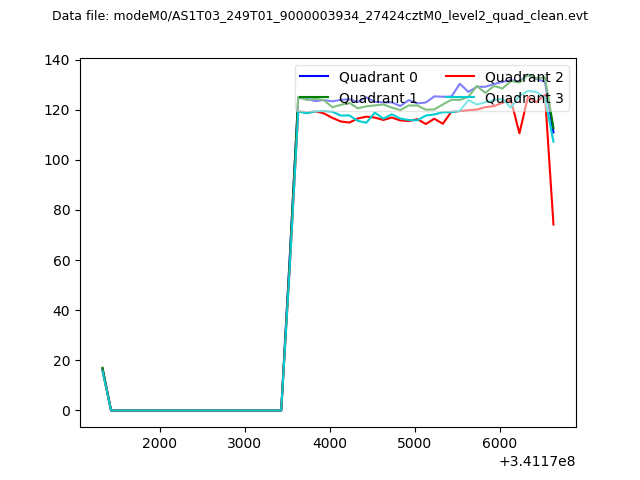 |
|
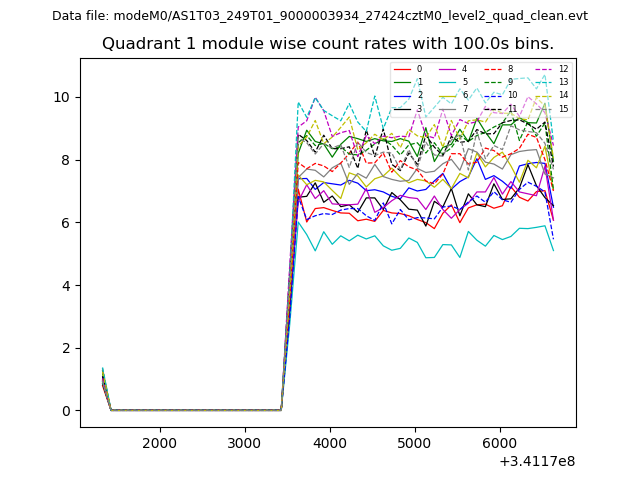
| Module-wise count rates for Quadrant A Data is divided into 100 sec bins |
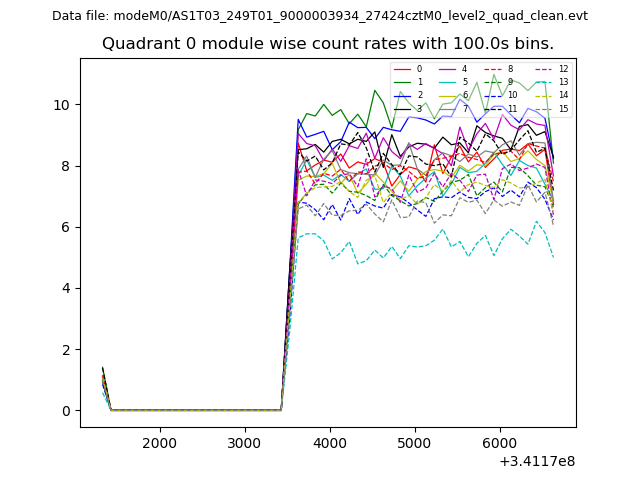 |
 |
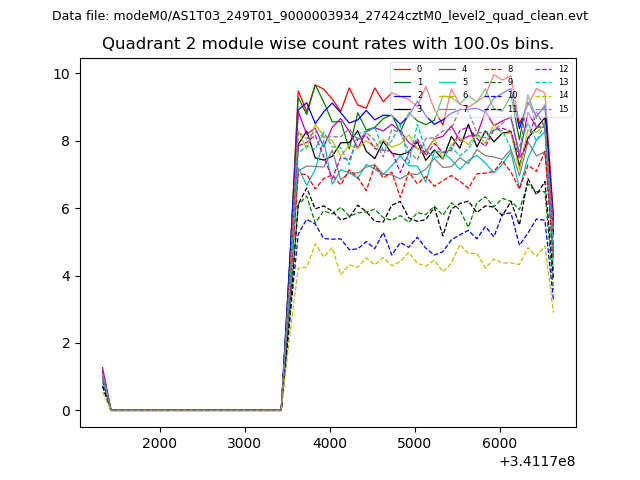
| Module-wise count rates for Quadrant B Data is divided into 100 sec bins |
 |
 |
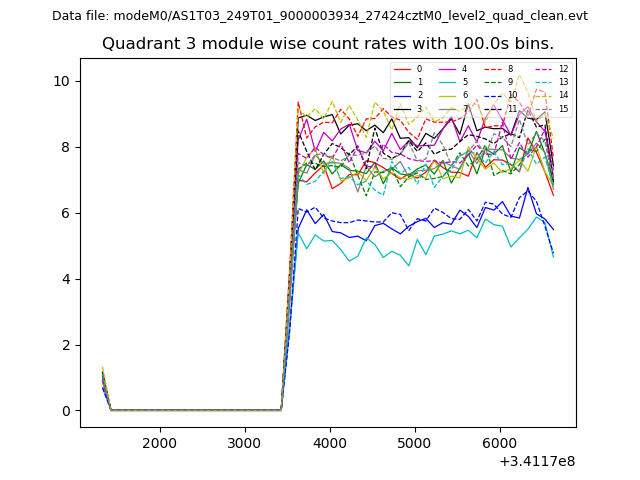
| Module-wise count rates for Quadrant C Data is divided into 100 sec bins |
 |
 |
| Module-wise count rates for Quadrant D Data is divided into 100 sec bins |
 |
 |
| Parameter | Plot |
|---|---|
| CZT HV Monitor | 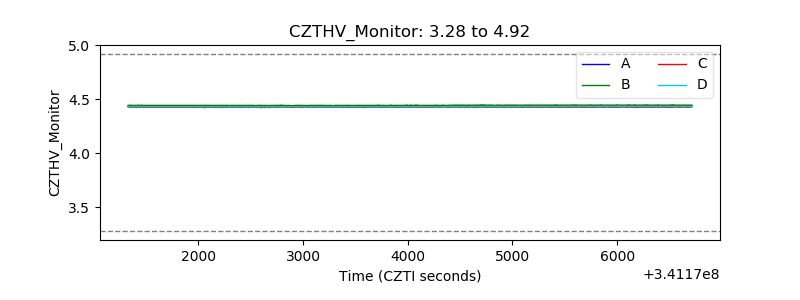 |
| D_VDD | 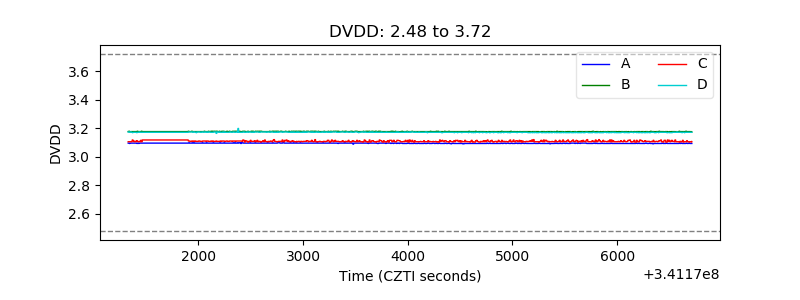 |
| Temperature 1 | 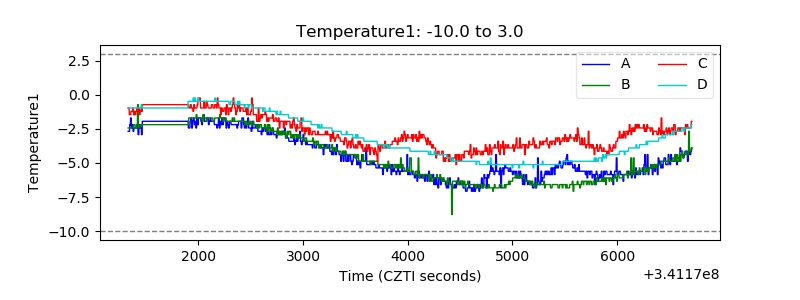 |
| Veto HV Monitor | 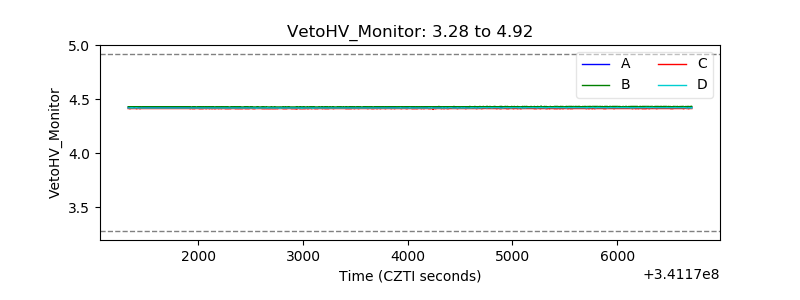 |
| Veto LLD | 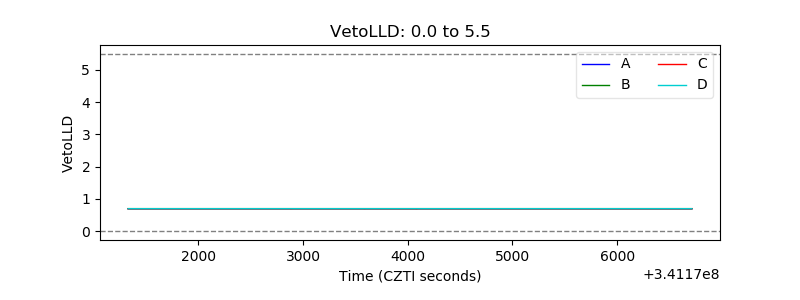 |
| Alpha Counter | 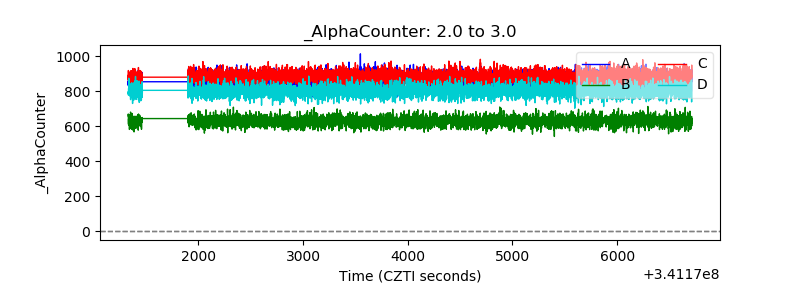 |
| _CPM_Rate | 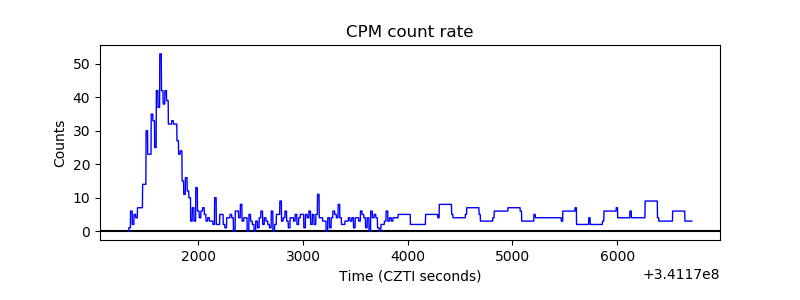 |
| CZT Counter |  |
| +2.5 Volts monitor |  |
| +5 Volts monitor |  |
| _ROLL_ROT | 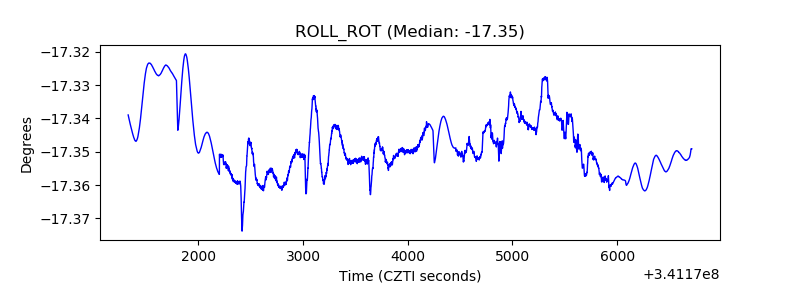 |
| _Roll_DEC | 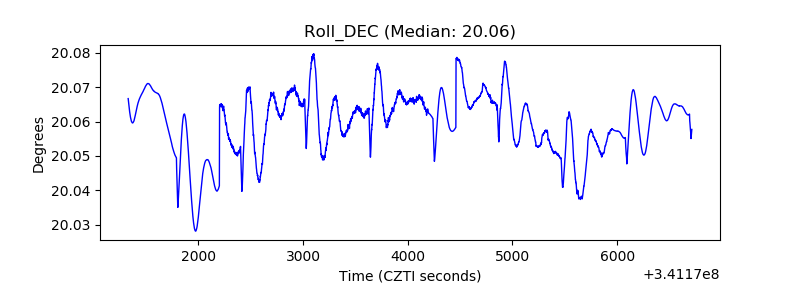 |
| _Roll_RA |  |
| Veto Counter | 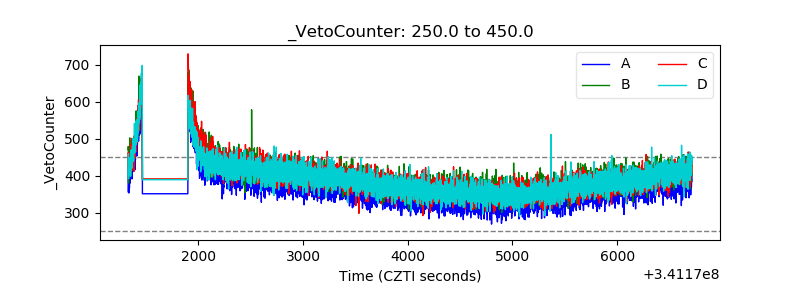 |