| Param | Original file | Final file |
|---|---|---|
| Filename | modeM0/AS1T03_249T01_9000003934_27425cztM0_level2.evt | modeM0/AS1T03_249T01_9000003934_27425cztM0_level2_quad_clean.evt |
| Size (bytes) | 1,209,764,160 | 201,355,200 |
| Size | 1.1 GB | 192.0 MB |
| Events in quadrant A | 7,031,054 | 1,315,463 |
| Events in quadrant B | 7,391,444 | 1,315,919 |
| Events in quadrant C | 13,436,910 | 1,186,050 |
| Events in quadrant D | 7,768,996 | 1,249,523 |
| Mode M0 | |||
|---|---|---|---|
| Quadrant | BADHDUFLAG | Total packets | Discarded packets |
| A | 0 | 30607 | 0 |
| B | 0 | 31885 | 0 |
| C | 0 | 50046 | 0 |
| D | 0 | 33607 | 0 |
| Mode M9 | |||
|---|---|---|---|
| Quadrant | BADHDUFLAG | Total packets | Discarded packets |
| A | 0 | 22 | 0 |
| B | 0 | 22 | 0 |
| C | 0 | 22 | 0 |
| D | 0 | 22 | 0 |
| Quadrant | Total seconds | Saturated seconds | Saturation percentage |
|---|---|---|---|
| A | 14943 | 97 | 0.649133% |
| B | 14944 | 146 | 0.976981% |
| C | 14944 | 2142 | 14.333512% |
| D | 14944 | 251 | 1.679604% |
Noise dominated data is calculated using 1-second bins in cleaned event files. If a bin has >2000 counts, and if more than 50% of those come from <1% of pixels, then it is considered to be noise-dominated and hence unusable.
| Quadrant | # 1 sec bins | Bins with >0 counts | Bins with >2000 counts | High rate bins dominated by noise | Noise dominated (total time) | Noise dominated (detector-on time) | Marked lightcurve |
|---|---|---|---|---|---|---|---|
| A | 17073 | 14946 | 0 | 0 | 0.00% | 0.00% | 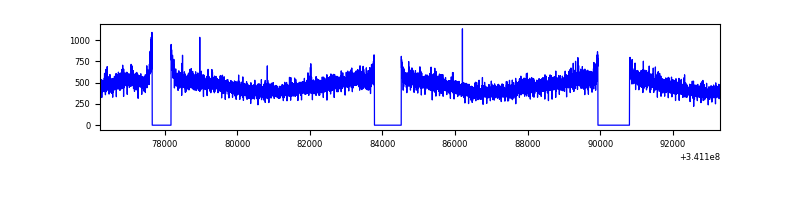 |
| B | 17074 | 14946 | 1 | 1 | 0.01% | 0.01% | 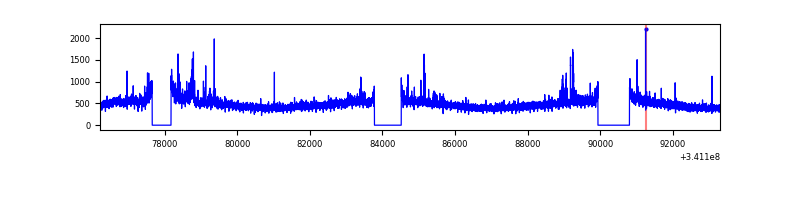 |
| C | 17074 | 14944 | 1206 | 1206 | 7.06% | 8.07% | 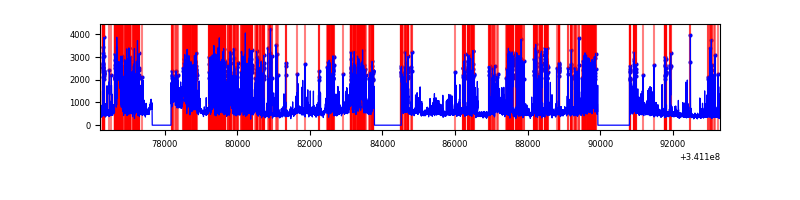 |
| D | 17074 | 14945 | 154 | 154 | 0.90% | 1.03% | 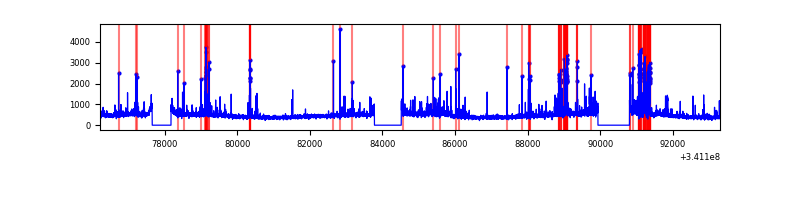 |
Top three noisy pixels from each quadrant. If the there are fewer than three noisy pixels in the level2.evt file, extra rows are filled as -1
| Pixel properties | Quadrant properties | ||||||
|---|---|---|---|---|---|---|---|
| Quadrant | DetID | PixID | Counts | Sigma | Mean | Median | Sigma |
| A | 13 | 254 | 24380 | 61.82 | 1818 | 1779 | 365.6 |
| A | 3 | 137 | 17480 | 42.95 | 1818 | 1779 | 365.6 |
| A | 0 | 226 | 15606 | 37.82 | 1818 | 1779 | 365.6 |
| B | 0 | 190 | 145915 | 420.66 | 1797 | 1752 | 342.7 |
| B | 0 | 189 | 112207 | 322.3 | 1797 | 1752 | 342.7 |
| B | 12 | 111 | 43043 | 120.49 | 1797 | 1752 | 342.7 |
| C | 7 | 221 | 3323454 | 8659.81 | 1647 | 1655 | 383.6 |
| C | 2 | 16 | 3145205 | 8195.12 | 1647 | 1655 | 383.6 |
| C | 14 | 238 | 260789 | 675.55 | 1647 | 1655 | 383.6 |
| D | 1 | 52 | 650819 | 1564.2 | 1748 | 1701 | 415.0 |
| D | 2 | 250 | 400508 | 961.02 | 1748 | 1701 | 415.0 |
| D | 2 | 234 | 61663 | 144.49 | 1748 | 1701 | 415.0 |
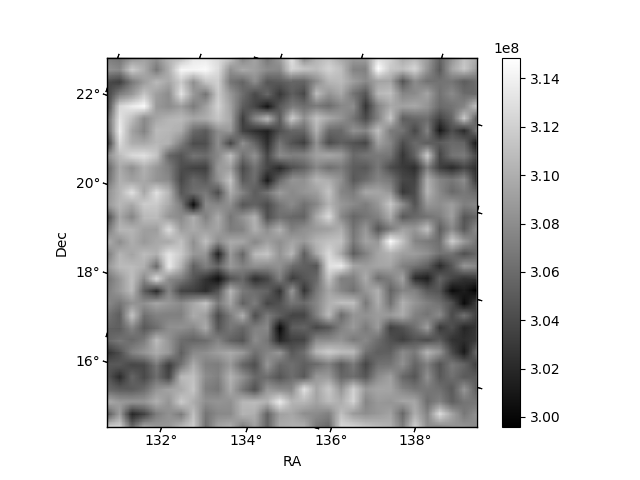
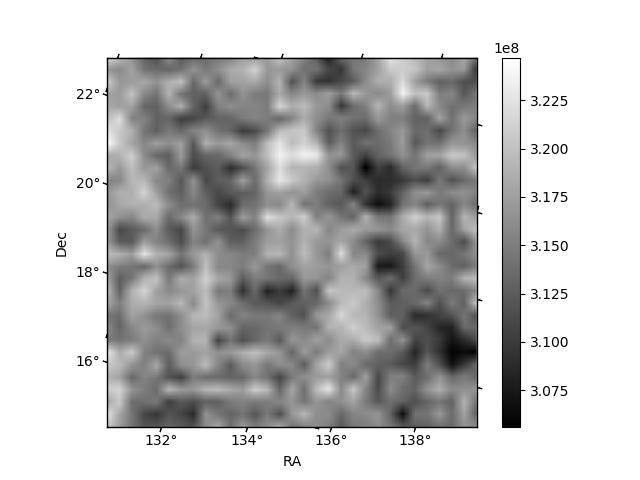
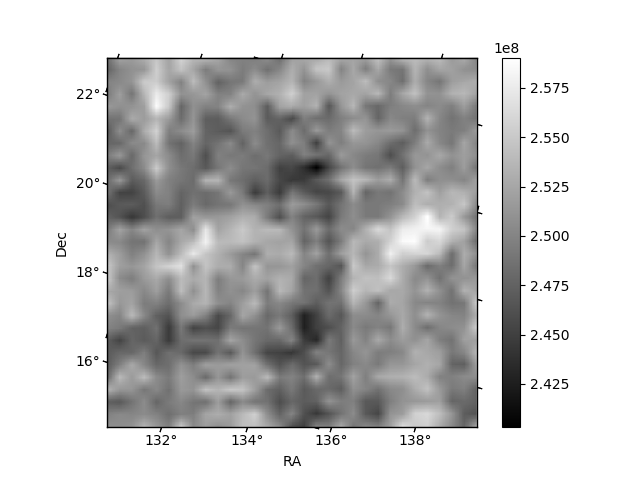
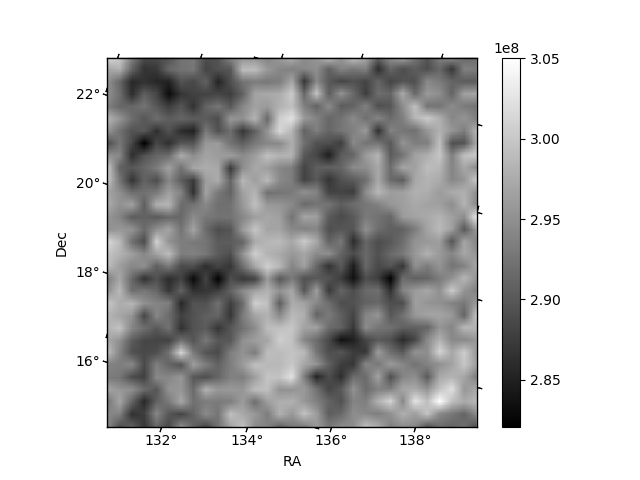
Histogram calculated using DETX and DETY for each event in the final _common_clean file
| Quadrant A | 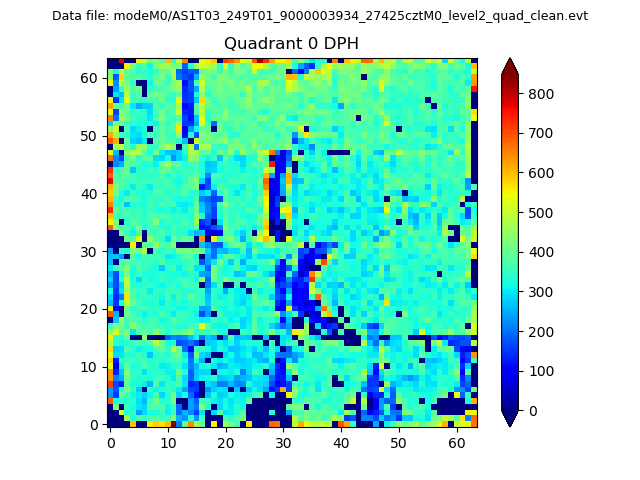 |
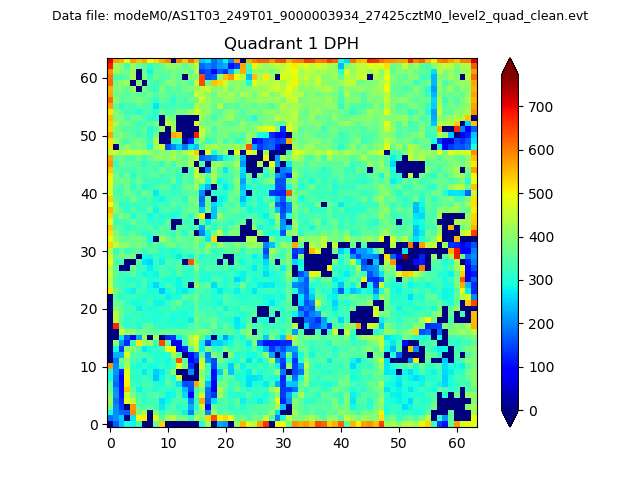 |
Quadrant B |
|---|---|---|---|
| Quadrant D |  |
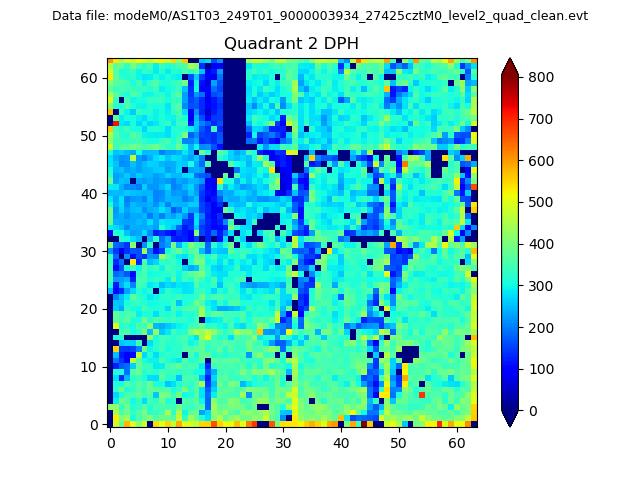 |
Quadrant C |
| Plot type | Count rate plots | Images |
|---|---|---|
| Comparison with Poisson distribution Blue bars denote a histogram of data divided into 1 sec bins. Red curve is a Poisson curve with rate = median count rate of data. |
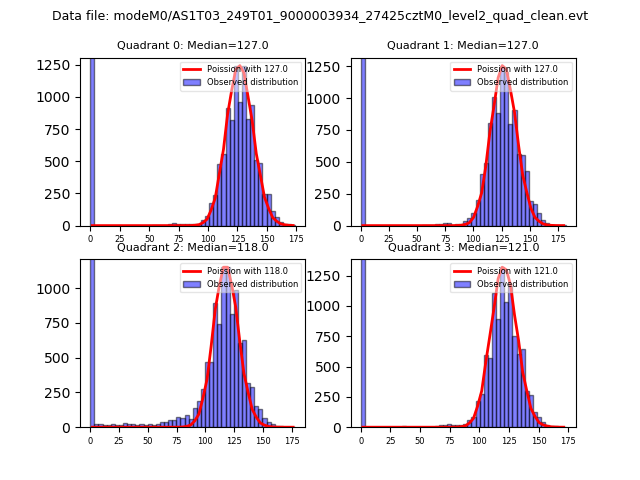 |
 |
| Quadrant-wise count rates Data is divided into 100 sec bins |
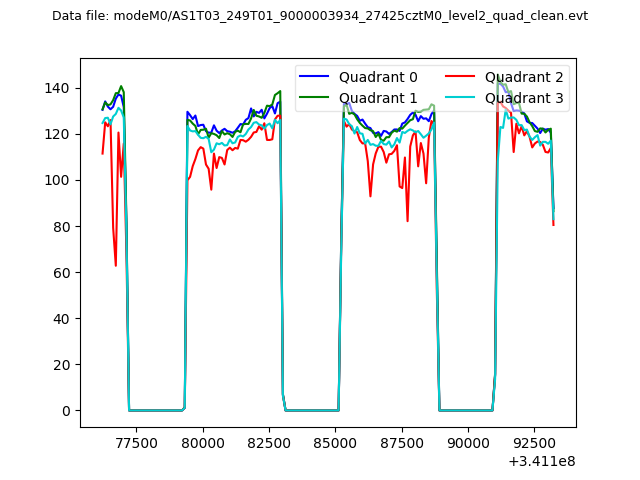 |
|
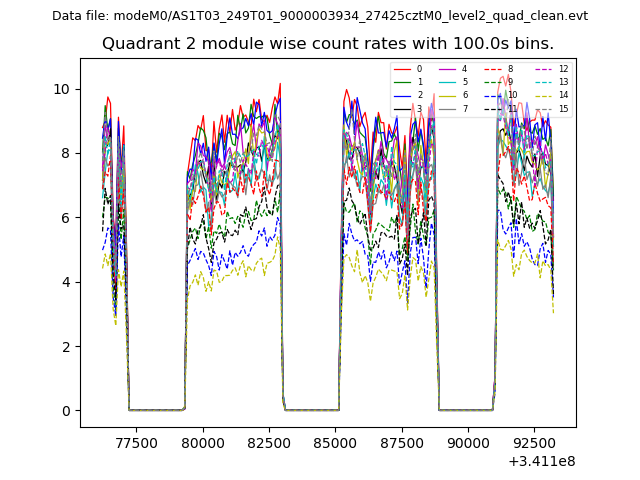
| Module-wise count rates for Quadrant A Data is divided into 100 sec bins |
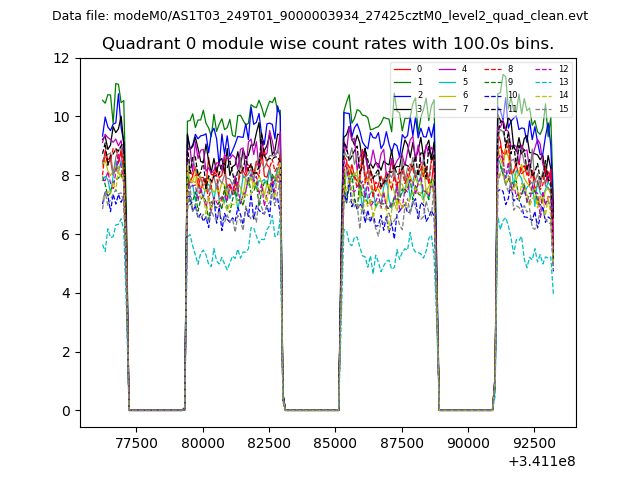 |
 |
| Module-wise count rates for Quadrant B Data is divided into 100 sec bins |
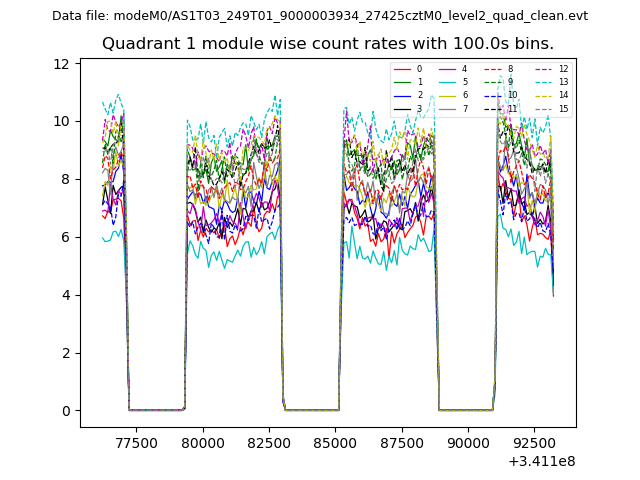 |
 |
| Module-wise count rates for Quadrant C Data is divided into 100 sec bins |
 |
 |
| Module-wise count rates for Quadrant D Data is divided into 100 sec bins |
 |
 |
| Parameter | Plot |
|---|---|
| CZT HV Monitor | 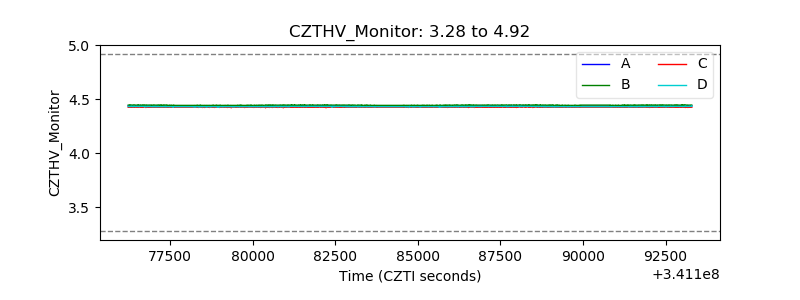 |
| D_VDD | 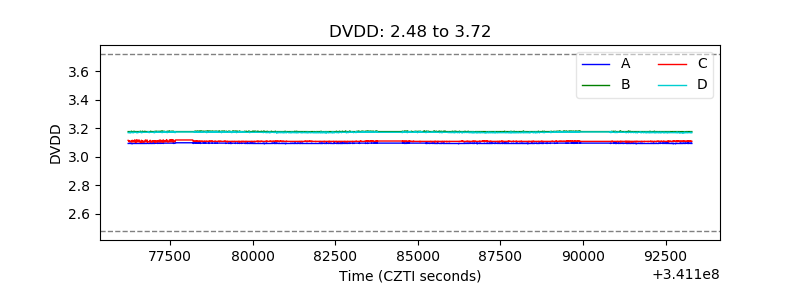 |
| Temperature 1 | 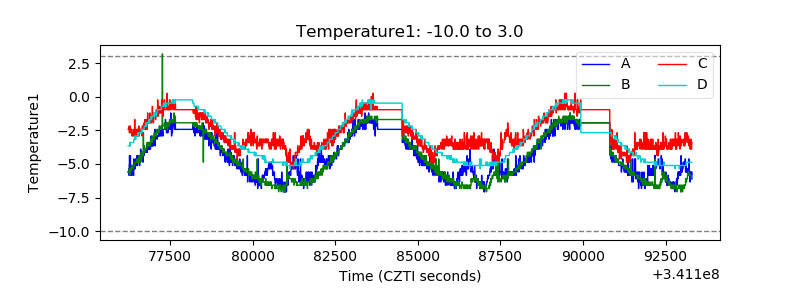 |
| Veto HV Monitor | 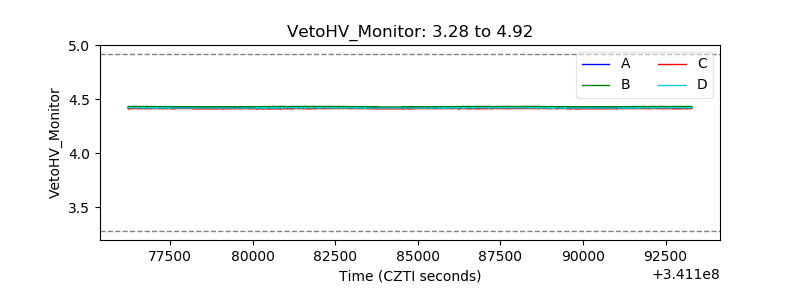 |
| Veto LLD |  |
| Alpha Counter | 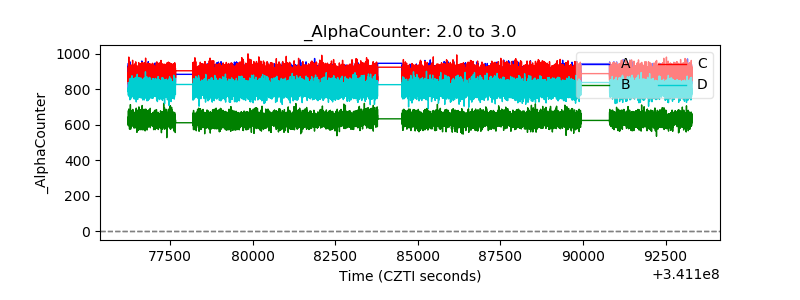 |
| _CPM_Rate | 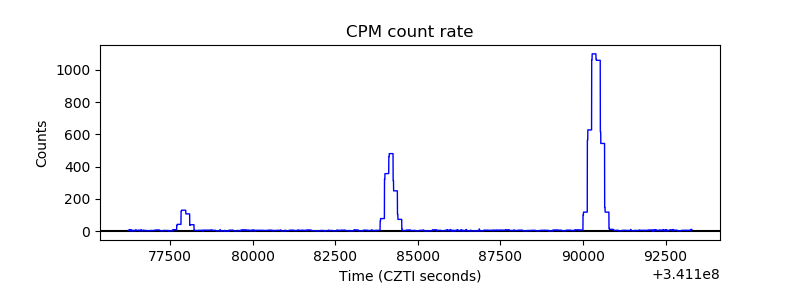 |
| CZT Counter | 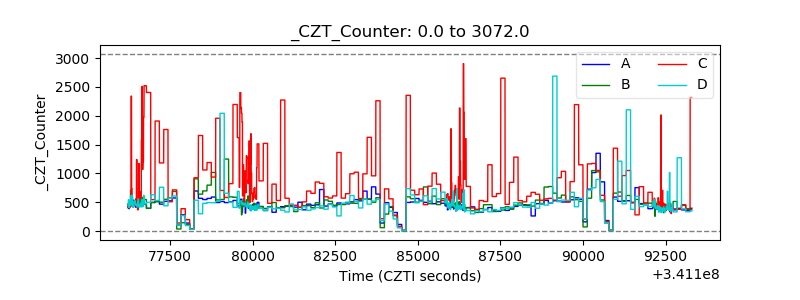 |
| +2.5 Volts monitor |  |
| +5 Volts monitor | 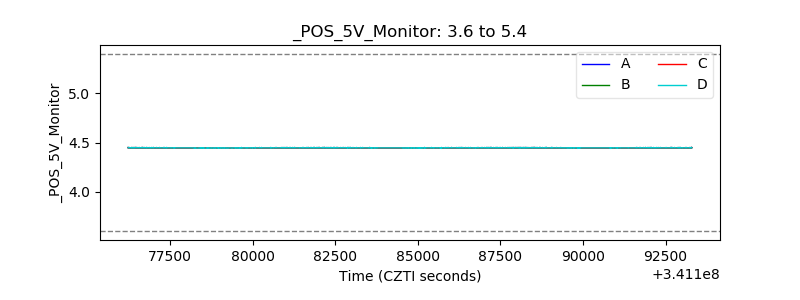 |
| _ROLL_ROT |  |
| _Roll_DEC | 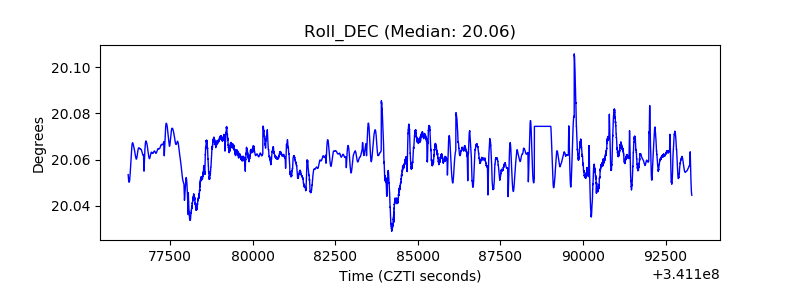 |
| _Roll_RA | 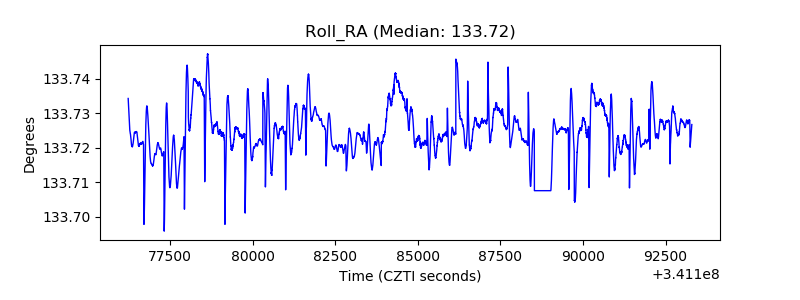 |
| Veto Counter | 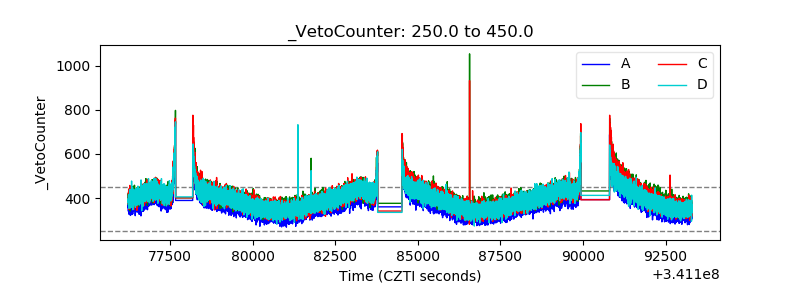 |