| Param | Original file | Final file |
|---|---|---|
| Filename | modeM0/AS1T03_249T01_9000003934_27427cztM0_level2.evt | modeM0/AS1T03_249T01_9000003934_27427cztM0_level2_quad_clean.evt |
| Size (bytes) | 723,928,320 | 150,235,200 |
| Size | 690.4 MB | 143.3 MB |
| Events in quadrant A | 4,878,327 | 987,051 |
| Events in quadrant B | 5,007,875 | 1,000,464 |
| Events in quadrant C | 5,363,190 | 941,748 |
| Events in quadrant D | 5,983,102 | 913,659 |
| Mode M0 | |||
|---|---|---|---|
| Quadrant | BADHDUFLAG | Total packets | Discarded packets |
| A | 0 | 21096 | 0 |
| B | 0 | 21524 | 0 |
| C | 0 | 22556 | 0 |
| D | 0 | 24747 | 0 |
| Mode M9 | |||
|---|---|---|---|
| Quadrant | BADHDUFLAG | Total packets | Discarded packets |
| A | 0 | 22 | 0 |
| B | 0 | 22 | 0 |
| C | 0 | 22 | 0 |
| D | 0 | 22 | 0 |
| Quadrant | Total seconds | Saturated seconds | Saturation percentage |
|---|---|---|---|
| A | 10211 | 29 | 0.284007% |
| B | 10211 | 61 | 0.597395% |
| C | 10211 | 157 | 1.537558% |
| D | 10211 | 401 | 3.927137% |
Noise dominated data is calculated using 1-second bins in cleaned event files. If a bin has >2000 counts, and if more than 50% of those come from <1% of pixels, then it is considered to be noise-dominated and hence unusable.
| Quadrant | # 1 sec bins | Bins with >0 counts | Bins with >2000 counts | High rate bins dominated by noise | Noise dominated (total time) | Noise dominated (detector-on time) | Marked lightcurve |
|---|---|---|---|---|---|---|---|
| A | 12381 | 10213 | 0 | 0 | 0.00% | 0.00% |  |
| B | 12381 | 10213 | 2 | 2 | 0.02% | 0.02% |  |
| C | 12381 | 10212 | 24 | 24 | 0.19% | 0.24% |  |
| D | 12381 | 10212 | 331 | 331 | 2.67% | 3.24% |  |
Top three noisy pixels from each quadrant. If the there are fewer than three noisy pixels in the level2.evt file, extra rows are filled as -1
| Pixel properties | Quadrant properties | ||||||
|---|---|---|---|---|---|---|---|
| Quadrant | DetID | PixID | Counts | Sigma | Mean | Median | Sigma |
| A | 13 | 254 | 15296 | 56.03 | 1261 | 1237 | 250.9 |
| A | 10 | 67 | 11881 | 42.42 | 1261 | 1237 | 250.9 |
| A | 3 | 137 | 11662 | 41.54 | 1261 | 1237 | 250.9 |
| B | 0 | 190 | 69339 | 285.73 | 1252 | 1222 | 238.4 |
| B | 12 | 111 | 29017 | 116.59 | 1252 | 1222 | 238.4 |
| B | 11 | 111 | 26139 | 104.52 | 1252 | 1222 | 238.4 |
| C | 2 | 16 | 222284 | 790.72 | 1200 | 1209 | 279.6 |
| C | 14 | 238 | 194094 | 689.89 | 1200 | 1209 | 279.6 |
| C | 7 | 221 | 178003 | 632.34 | 1200 | 1209 | 279.6 |
| D | 1 | 52 | 1420769 | 5134.1 | 1181 | 1152 | 276.5 |
| D | 2 | 250 | 49536 | 174.98 | 1181 | 1152 | 276.5 |
| D | 2 | 234 | 38803 | 136.17 | 1181 | 1152 | 276.5 |
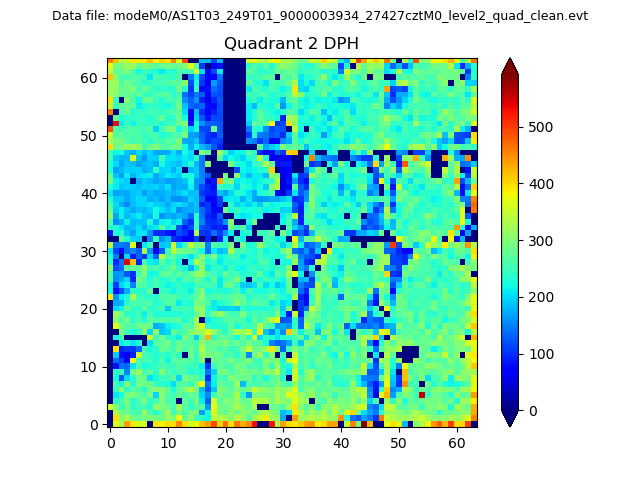
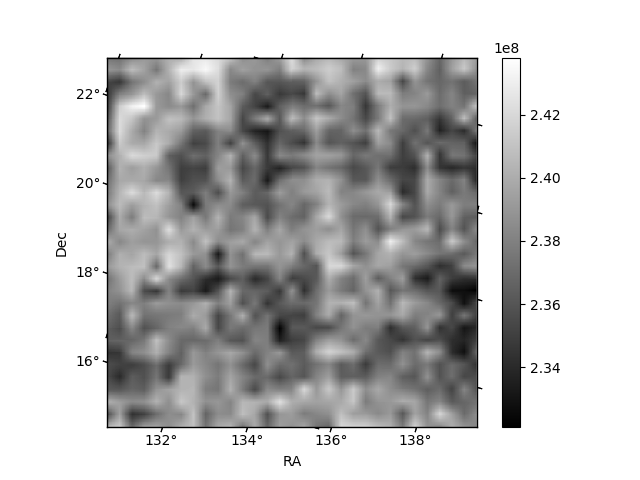
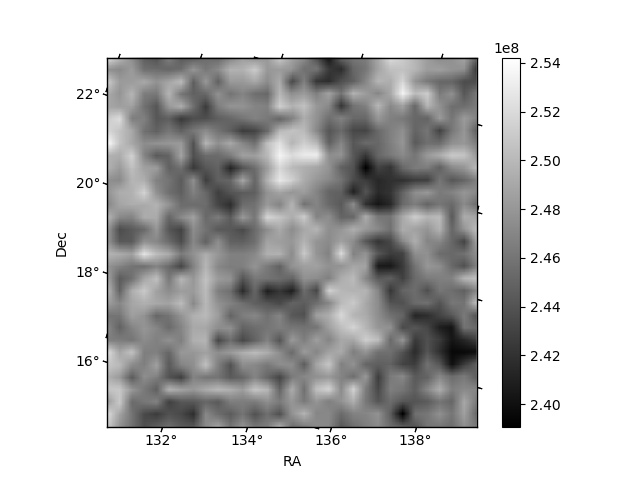
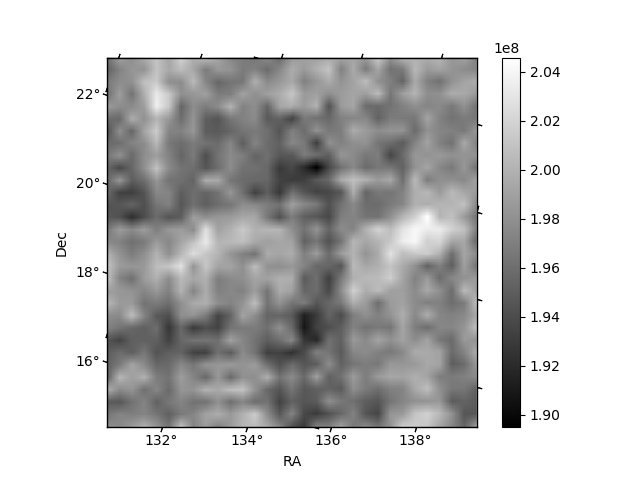
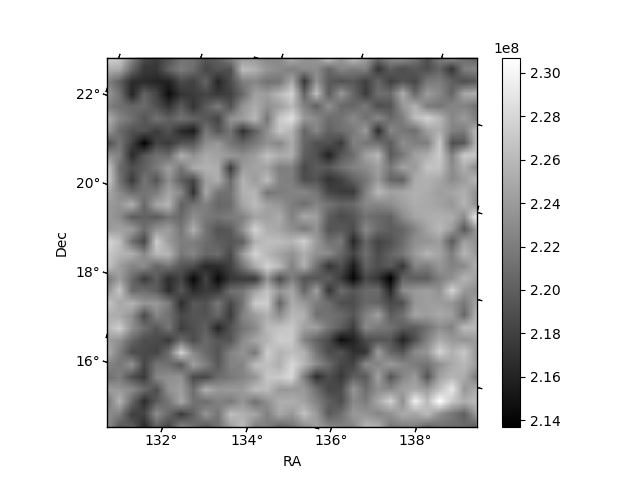
Histogram calculated using DETX and DETY for each event in the final _common_clean file
| Quadrant A | 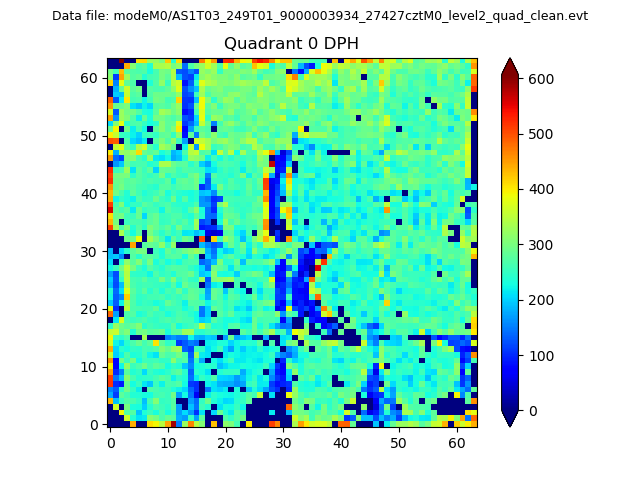 |
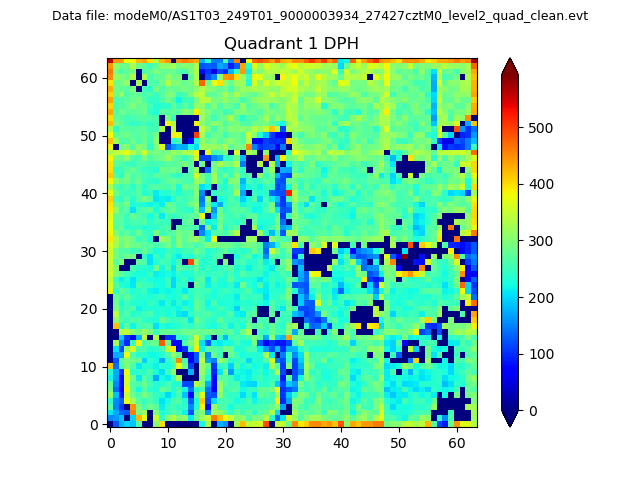 |
Quadrant B |
|---|---|---|---|
| Quadrant D | 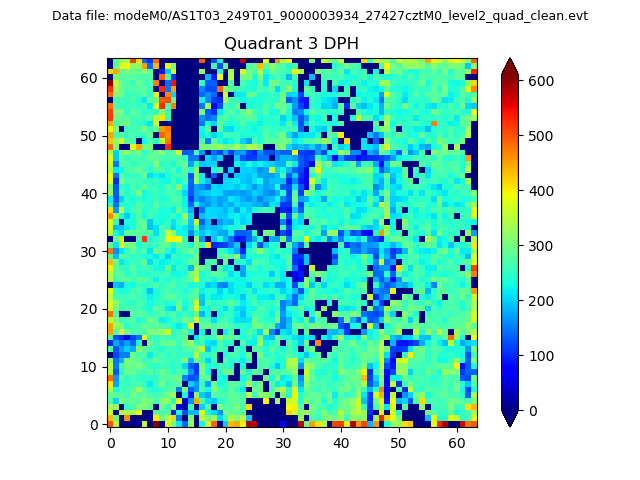 |
 |
Quadrant C |
| Plot type | Count rate plots | Images |
|---|---|---|
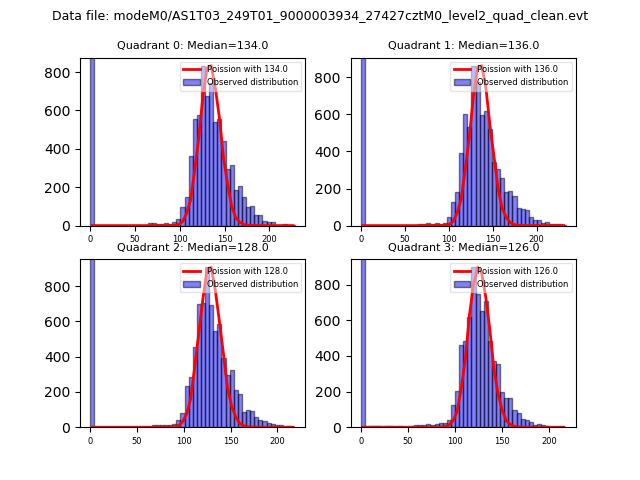
| Comparison with Poisson distribution Blue bars denote a histogram of data divided into 1 sec bins. Red curve is a Poisson curve with rate = median count rate of data. |
 |
 |
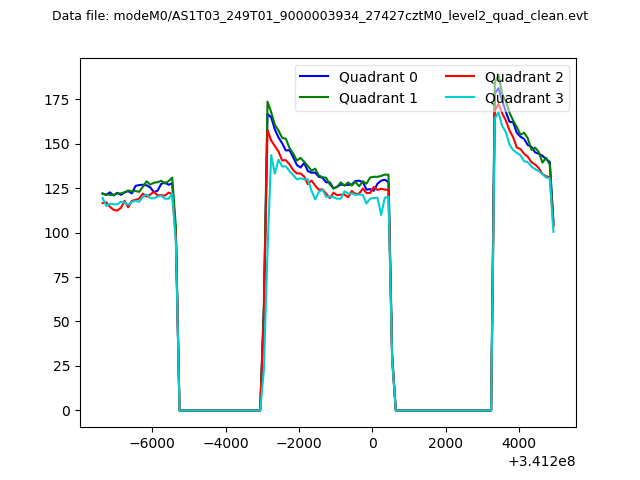
| Quadrant-wise count rates Data is divided into 100 sec bins |
 |
|
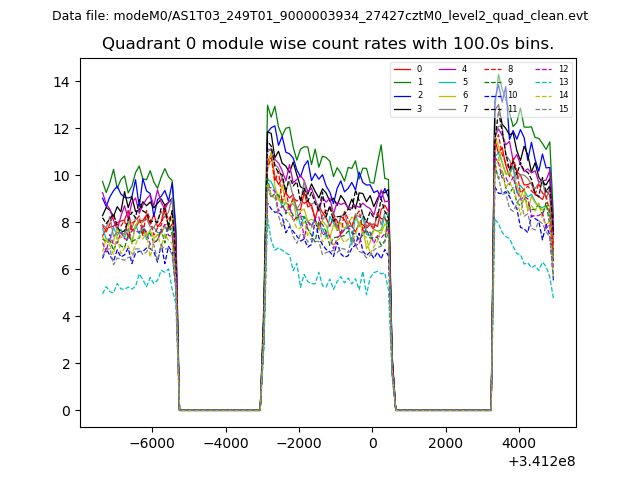
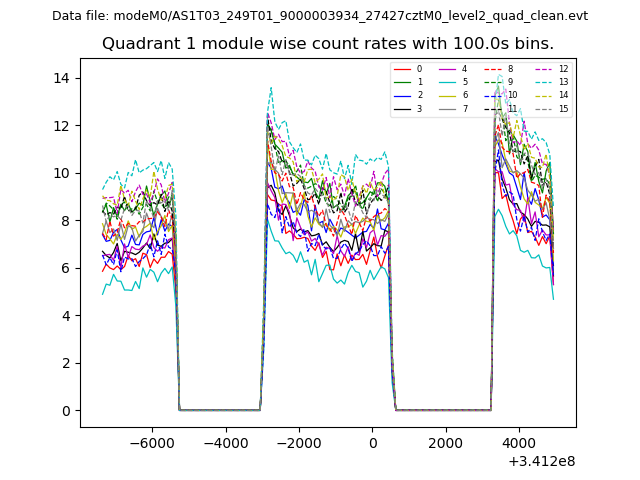
| Module-wise count rates for Quadrant A Data is divided into 100 sec bins |
 |
 |
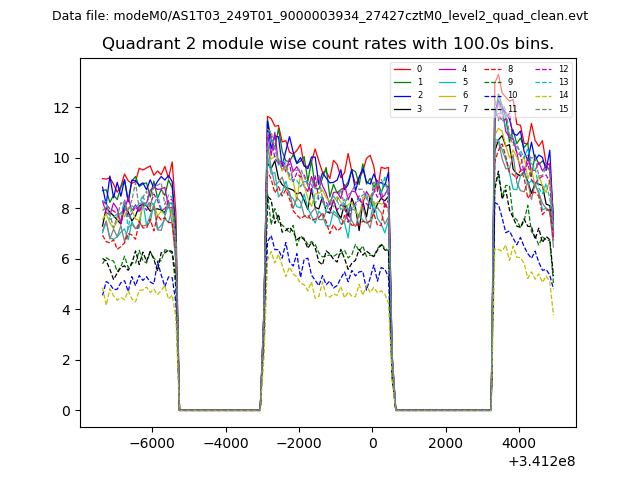
| Module-wise count rates for Quadrant B Data is divided into 100 sec bins |
 |
 |
| Module-wise count rates for Quadrant C Data is divided into 100 sec bins |
 |
 |
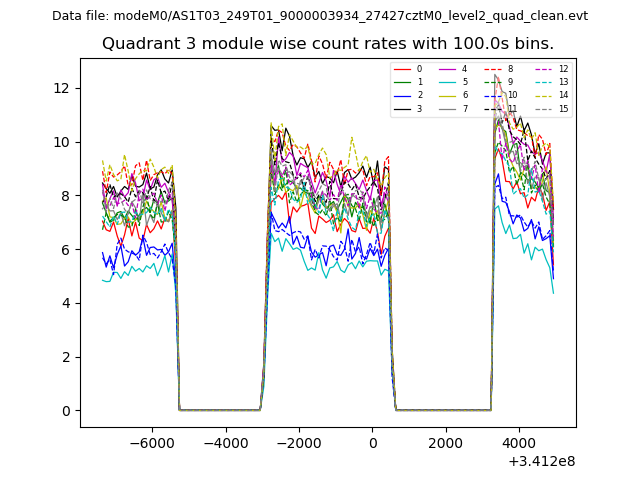
| Module-wise count rates for Quadrant D Data is divided into 100 sec bins |
 |
 |
| Parameter | Plot |
|---|---|
| CZT HV Monitor | 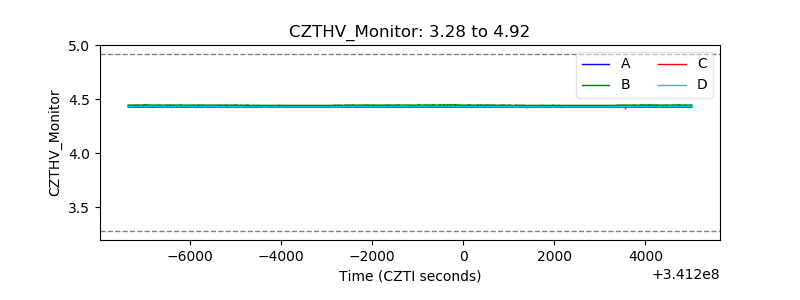 |
| D_VDD | 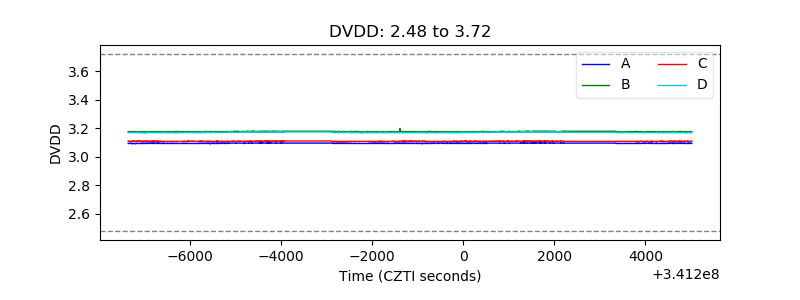 |
| Temperature 1 | 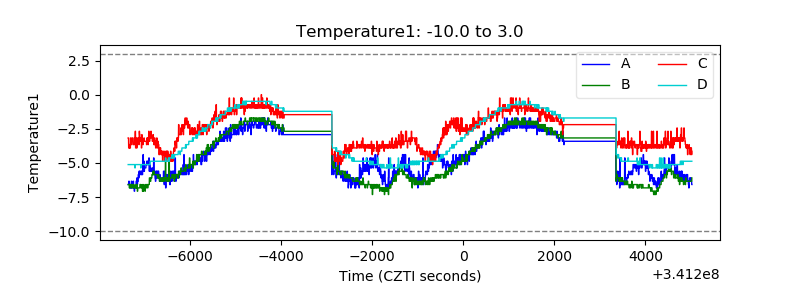 |
| Veto HV Monitor | 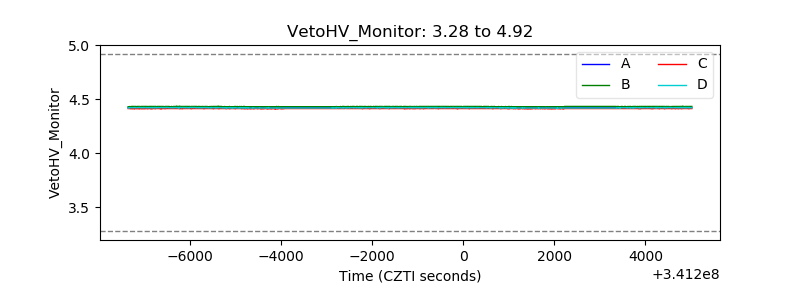 |
| Veto LLD | 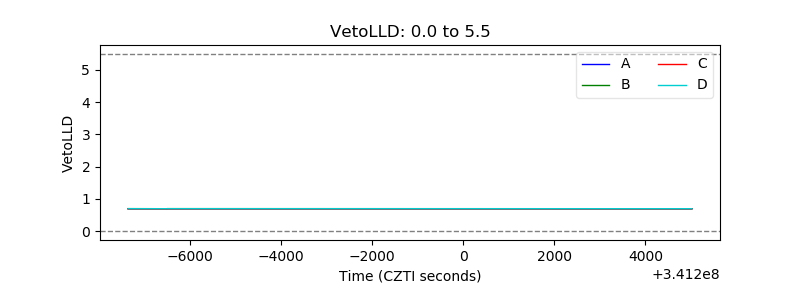 |
| Alpha Counter | 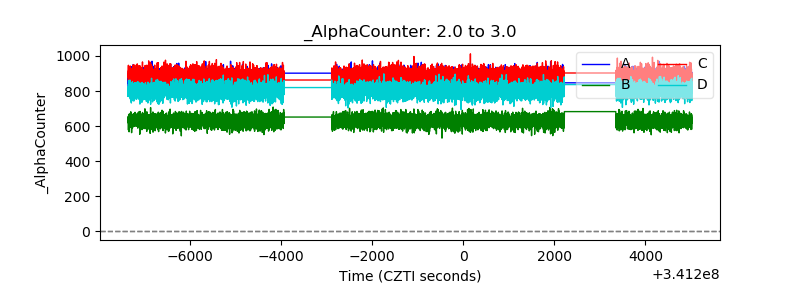 |
| _CPM_Rate | 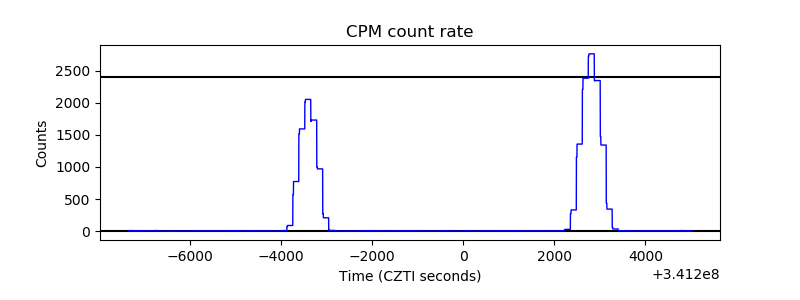 |
| CZT Counter | 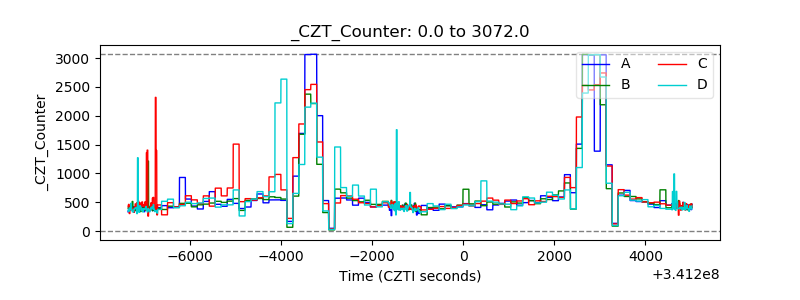 |
| +2.5 Volts monitor | 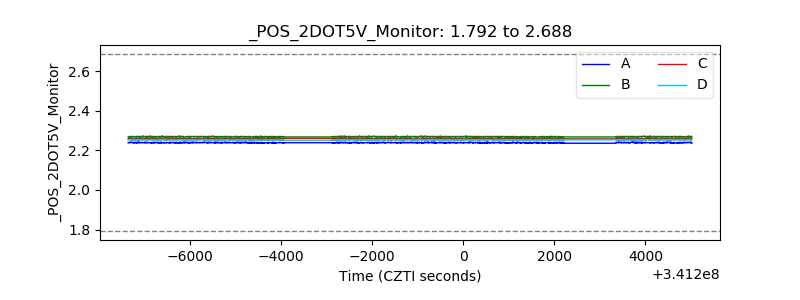 |
| +5 Volts monitor | 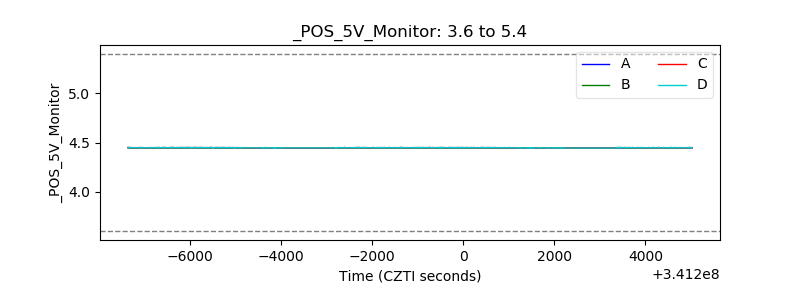 |
| _ROLL_ROT | 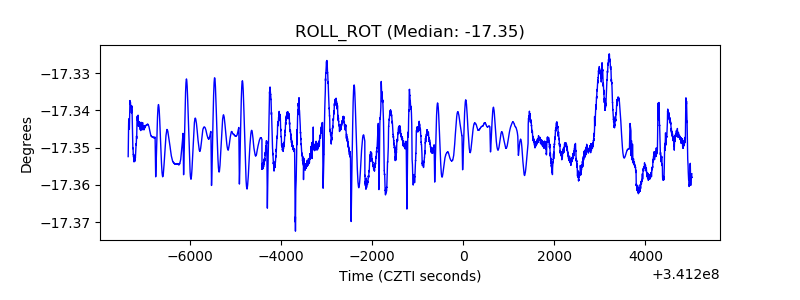 |
| _Roll_DEC | 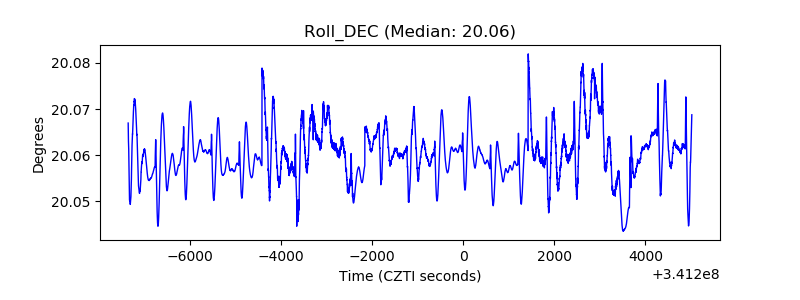 |
| _Roll_RA | 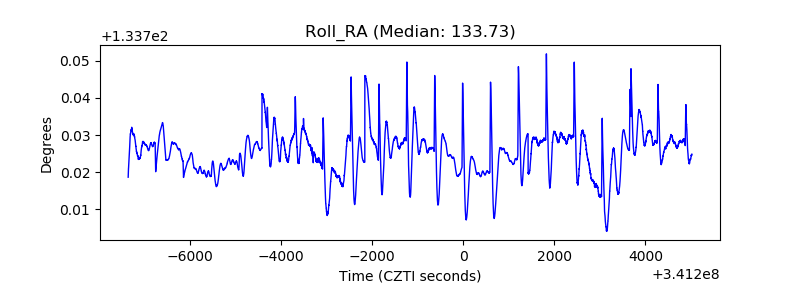 |
| Veto Counter | 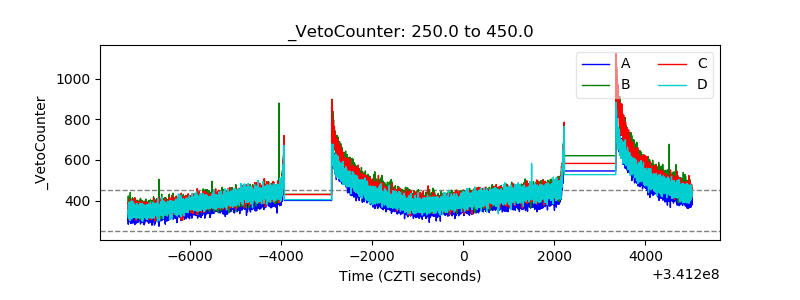 |