| Param | Original file | Final file |
|---|---|---|
| Filename | modeM0/AS1T03_249T01_9000003934_27428cztM0_level2.evt | modeM0/AS1T03_249T01_9000003934_27428cztM0_level2_quad_clean.evt |
| Size (bytes) | 472,040,640 | 106,007,040 |
| Size | 450.2 MB | 101.1 MB |
| Events in quadrant A | 3,315,953 | 705,240 |
| Events in quadrant B | 3,401,196 | 718,706 |
| Events in quadrant C | 3,414,198 | 672,919 |
| Events in quadrant D | 3,714,633 | 652,029 |
| Mode M0 | |||
|---|---|---|---|
| Quadrant | BADHDUFLAG | Total packets | Discarded packets |
| A | 0 | 13861 | 0 |
| B | 0 | 14099 | 0 |
| C | 0 | 14237 | 0 |
| D | 0 | 15444 | 0 |
| Mode M9 | |||
|---|---|---|---|
| Quadrant | BADHDUFLAG | Total packets | Discarded packets |
| A | 0 | 14 | 0 |
| B | 0 | 15 | 0 |
| C | 0 | 15 | 0 |
| D | 0 | 15 | 0 |
| Quadrant | Total seconds | Saturated seconds | Saturation percentage |
|---|---|---|---|
| A | 6615 | 24 | 0.362812% |
| B | 6615 | 38 | 0.574452% |
| C | 6615 | 85 | 1.284958% |
| D | 6615 | 116 | 1.753590% |
Noise dominated data is calculated using 1-second bins in cleaned event files. If a bin has >2000 counts, and if more than 50% of those come from <1% of pixels, then it is considered to be noise-dominated and hence unusable.
| Quadrant | # 1 sec bins | Bins with >0 counts | Bins with >2000 counts | High rate bins dominated by noise | Noise dominated (total time) | Noise dominated (detector-on time) | Marked lightcurve |
|---|---|---|---|---|---|---|---|
| A | 7850 | 6616 | 0 | 0 | 0.00% | 0.00% | 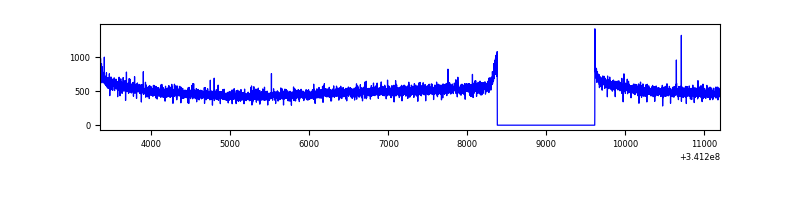 |
| B | 7850 | 6616 | 0 | 0 | 0.00% | 0.00% | 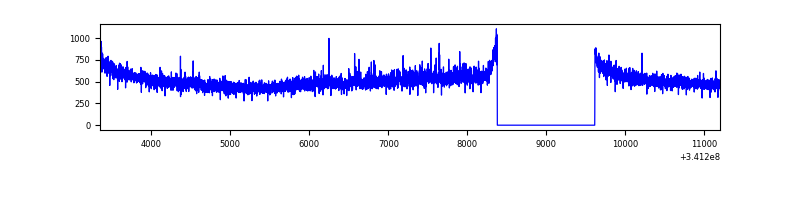 |
| C | 7850 | 6616 | 0 | 0 | 0.00% | 0.00% | 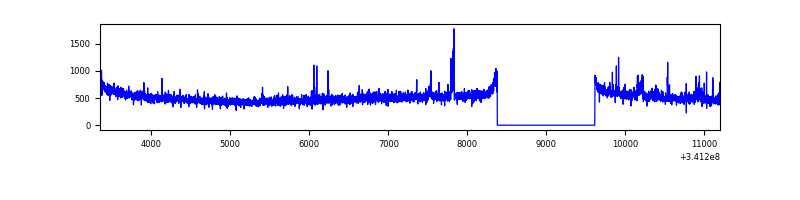 |
| D | 7850 | 6616 | 93 | 93 | 1.18% | 1.41% | 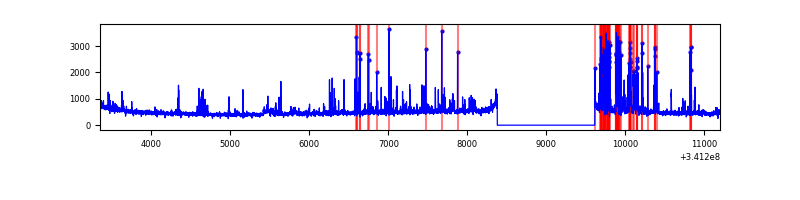 |
Top three noisy pixels from each quadrant. If the there are fewer than three noisy pixels in the level2.evt file, extra rows are filled as -1
| Pixel properties | Quadrant properties | ||||||
|---|---|---|---|---|---|---|---|
| Quadrant | DetID | PixID | Counts | Sigma | Mean | Median | Sigma |
| A | 13 | 254 | 9303 | 49.75 | 859 | 846 | 170.0 |
| A | 3 | 137 | 7540 | 39.38 | 859 | 846 | 170.0 |
| A | 0 | 226 | 7222 | 37.51 | 859 | 846 | 170.0 |
| B | 0 | 189 | 23018 | 137.87 | 858 | 838 | 160.9 |
| B | 12 | 111 | 19381 | 115.26 | 858 | 838 | 160.9 |
| B | 0 | 190 | 19217 | 114.24 | 858 | 838 | 160.9 |
| C | 14 | 238 | 132780 | 697.75 | 818 | 823 | 189.1 |
| C | 7 | 221 | 44379 | 230.31 | 818 | 823 | 189.1 |
| C | 10 | 22 | 28689 | 147.35 | 818 | 823 | 189.1 |
| D | 1 | 52 | 569399 | 2982.04 | 814 | 795 | 190.7 |
| D | 2 | 250 | 53143 | 274.54 | 814 | 795 | 190.7 |
| D | 2 | 234 | 25053 | 127.22 | 814 | 795 | 190.7 |
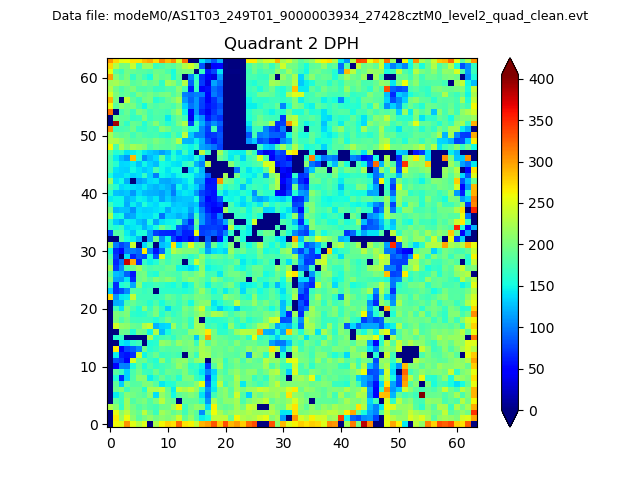
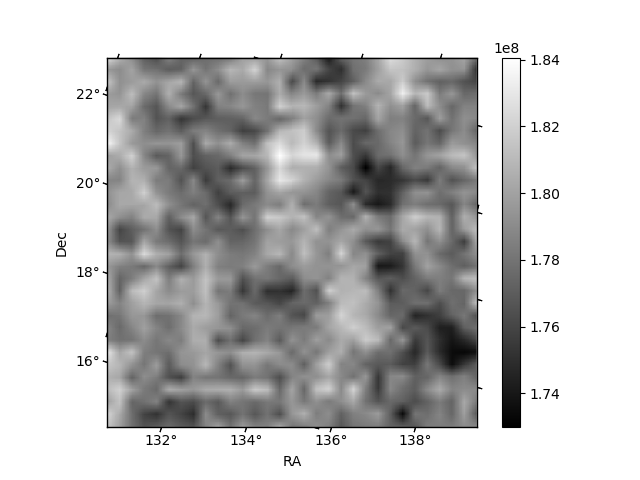
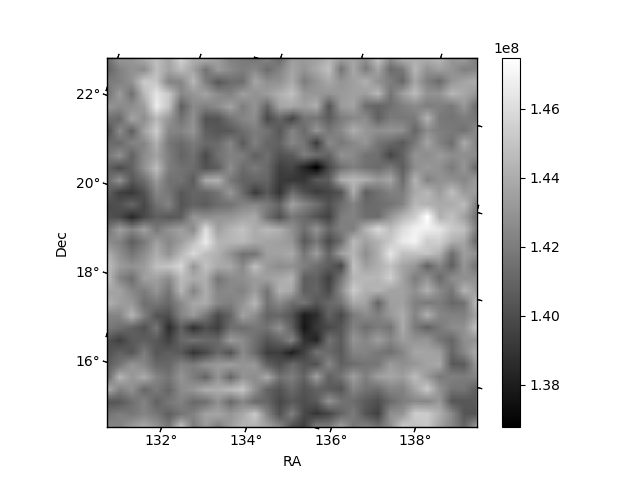
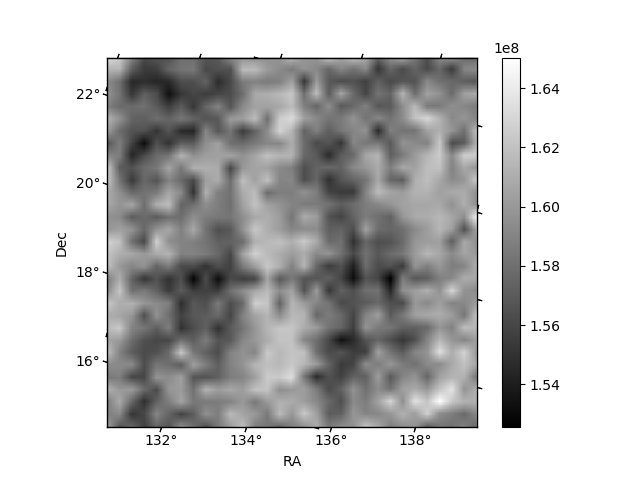
Histogram calculated using DETX and DETY for each event in the final _common_clean file
| Quadrant A | 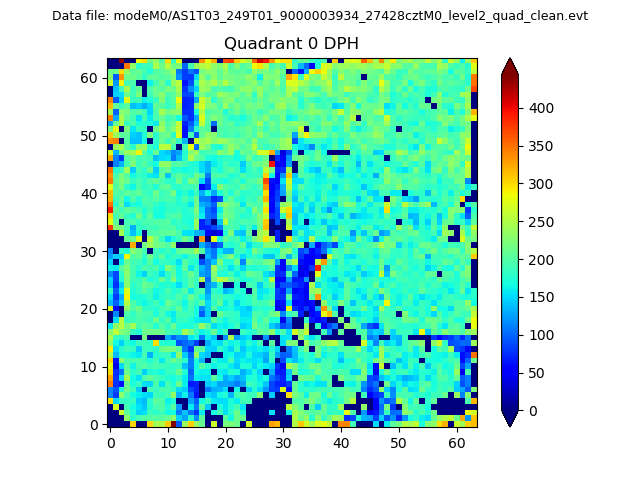 |
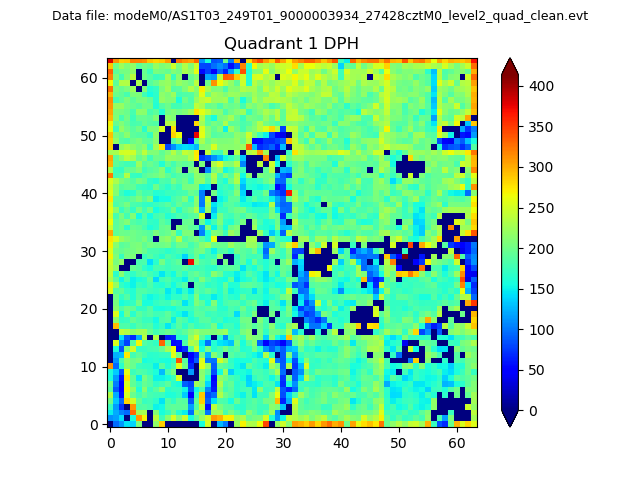 |
Quadrant B |
|---|---|---|---|
| Quadrant D | 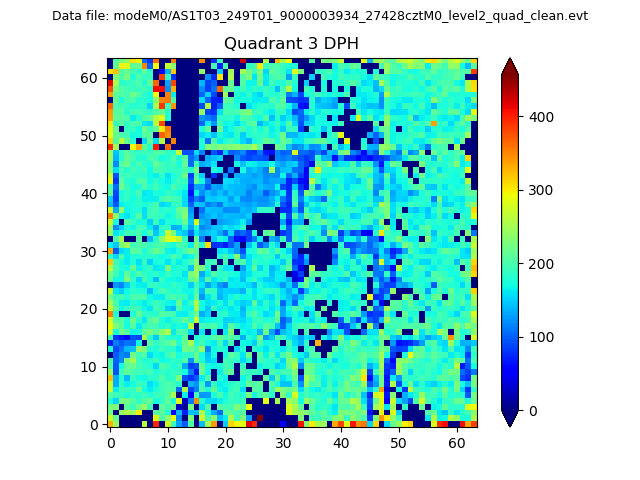 |
 |
Quadrant C |
| Plot type | Count rate plots | Images |
|---|---|---|
| Comparison with Poisson distribution Blue bars denote a histogram of data divided into 1 sec bins. Red curve is a Poisson curve with rate = median count rate of data. |
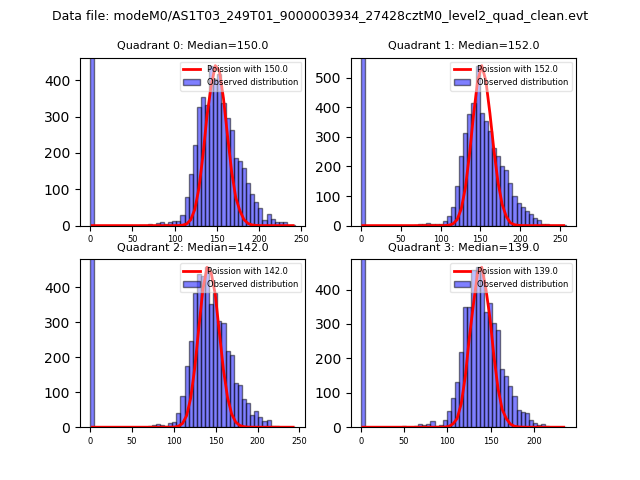 |
 |
| Quadrant-wise count rates Data is divided into 100 sec bins |
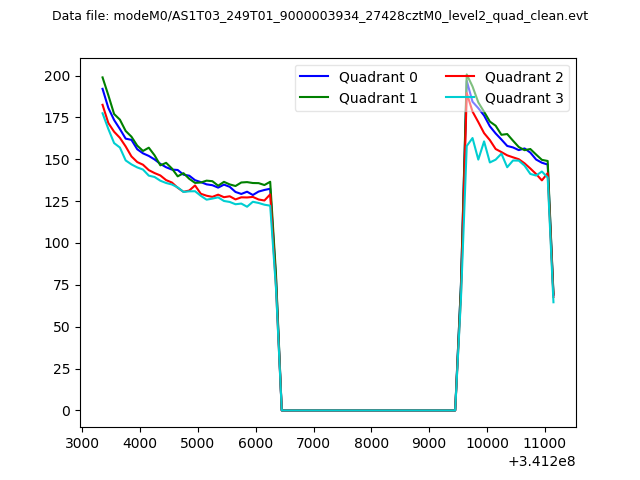 |
|
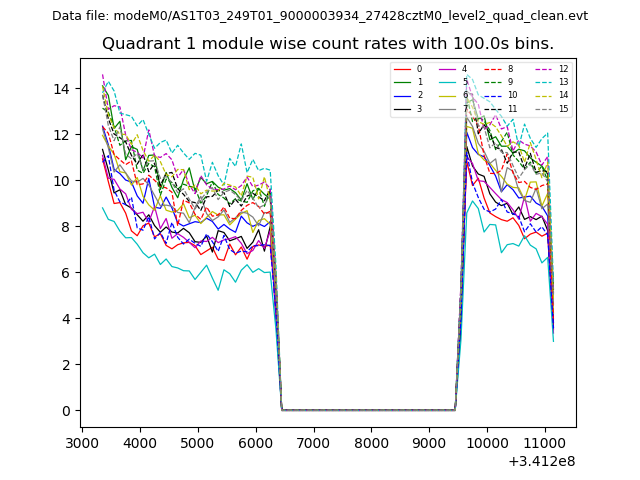
| Module-wise count rates for Quadrant A Data is divided into 100 sec bins |
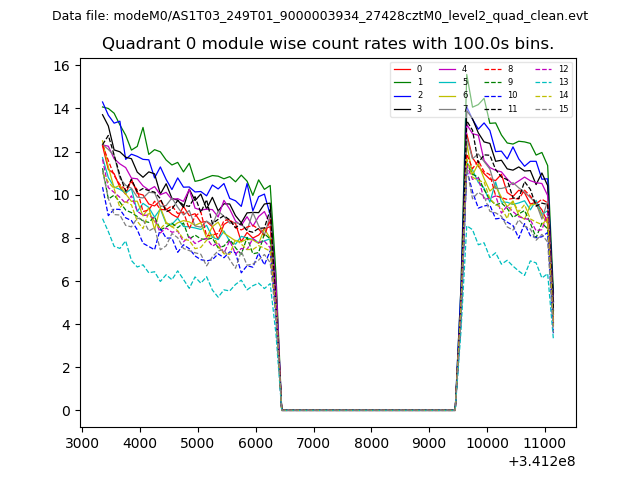 |
 |
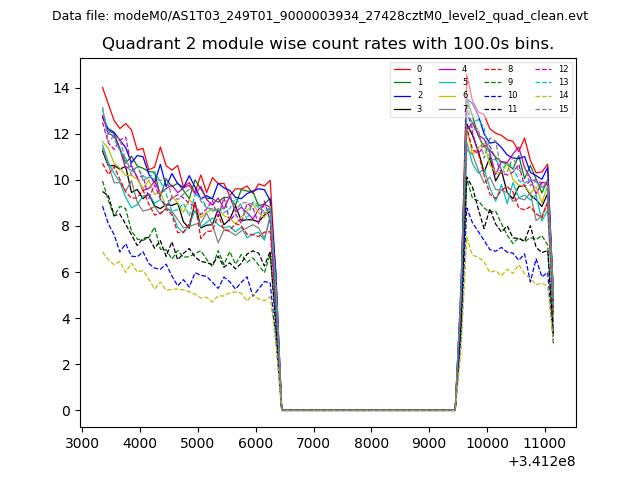
| Module-wise count rates for Quadrant B Data is divided into 100 sec bins |
 |
 |
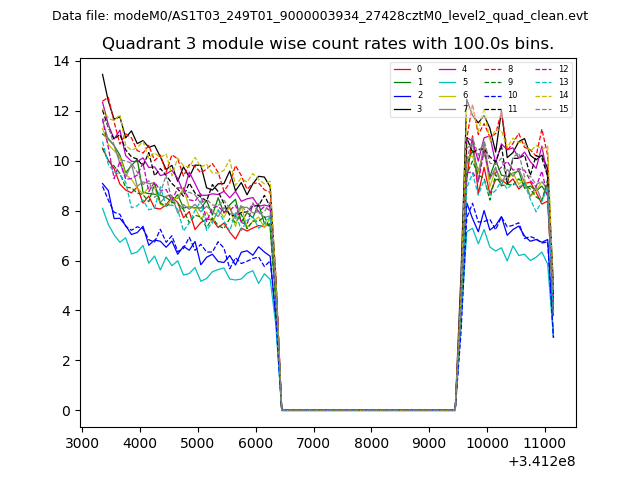
| Module-wise count rates for Quadrant C Data is divided into 100 sec bins |
 |
 |
| Module-wise count rates for Quadrant D Data is divided into 100 sec bins |
 |
 |
| Parameter | Plot |
|---|---|
| CZT HV Monitor | 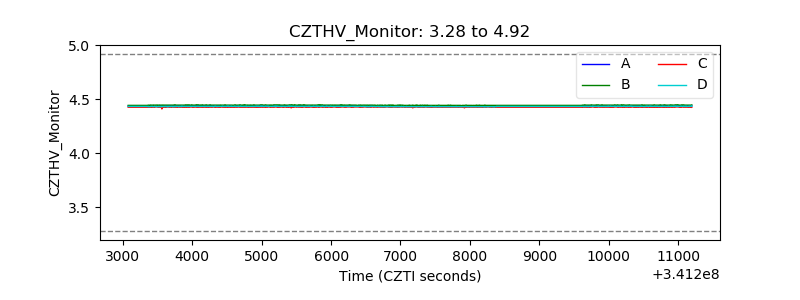 |
| D_VDD | 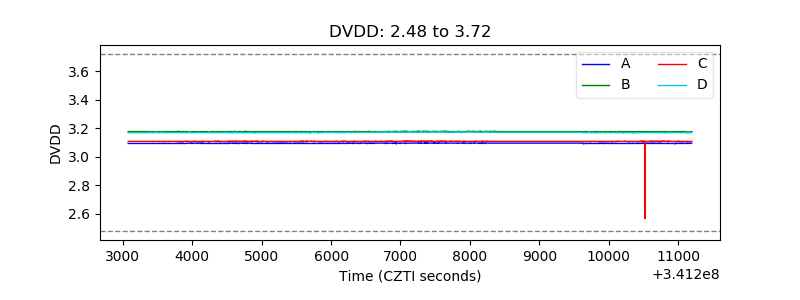 |
| Temperature 1 | 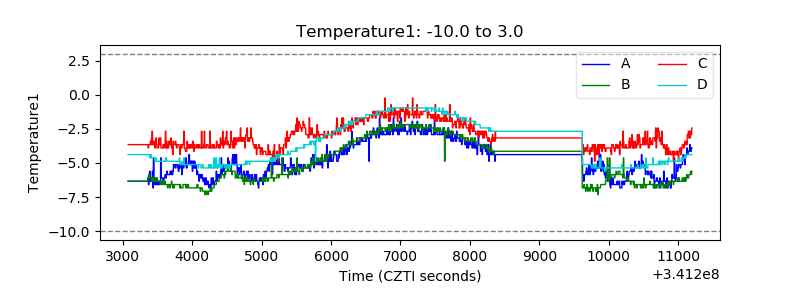 |
| Veto HV Monitor | 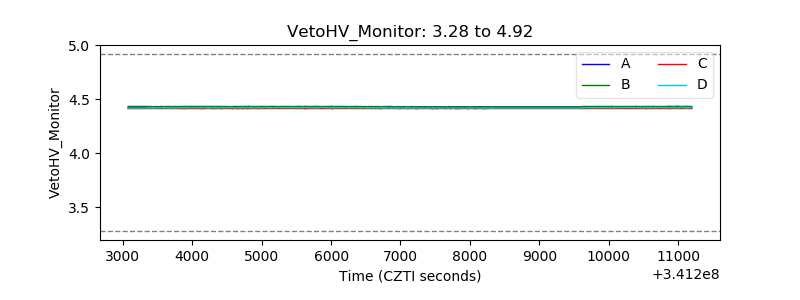 |
| Veto LLD | 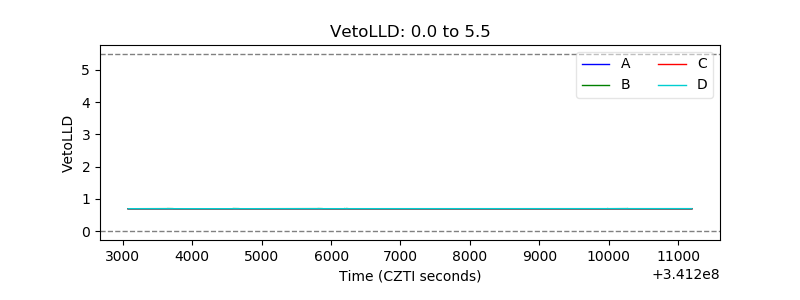 |
| Alpha Counter | 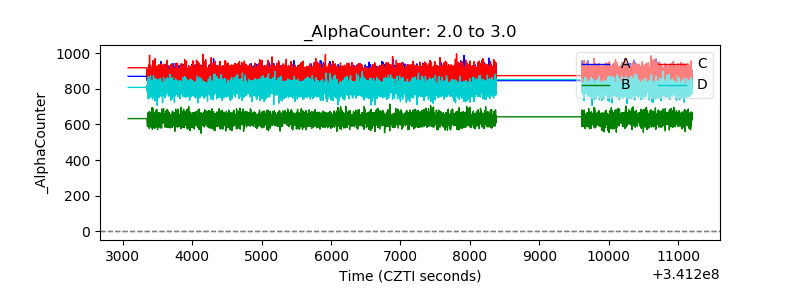 |
| _CPM_Rate | 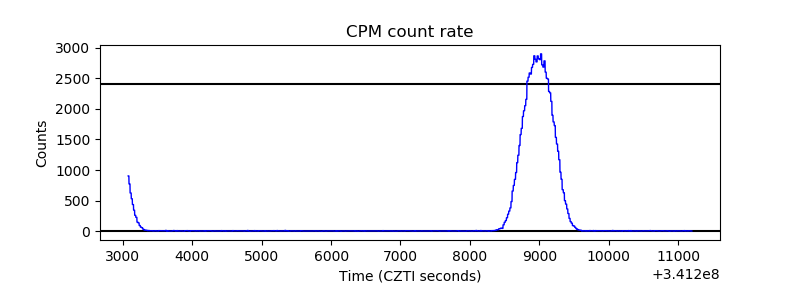 |
| CZT Counter | 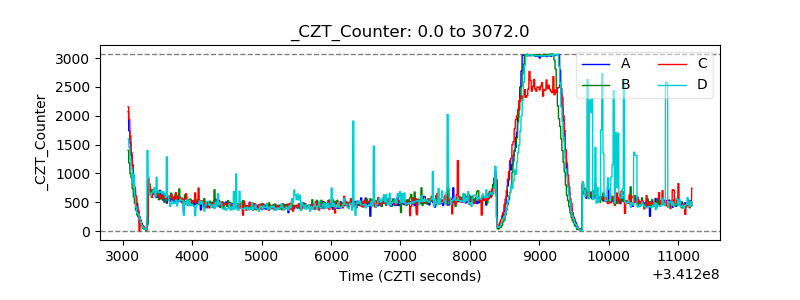 |
| +2.5 Volts monitor | 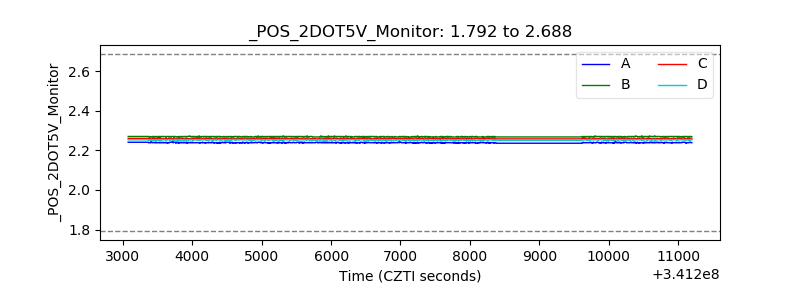 |
| +5 Volts monitor |  |
| _ROLL_ROT | 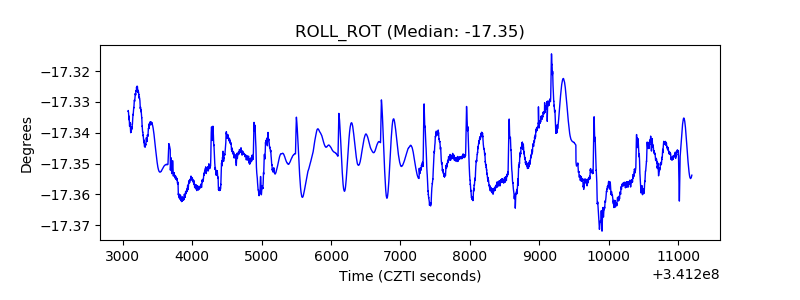 |
| _Roll_DEC | 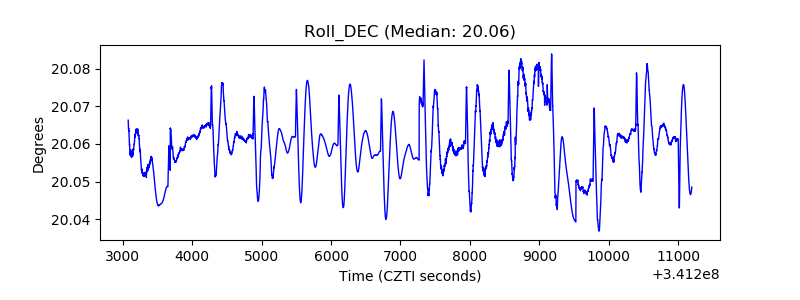 |
| _Roll_RA |  |
| Veto Counter | 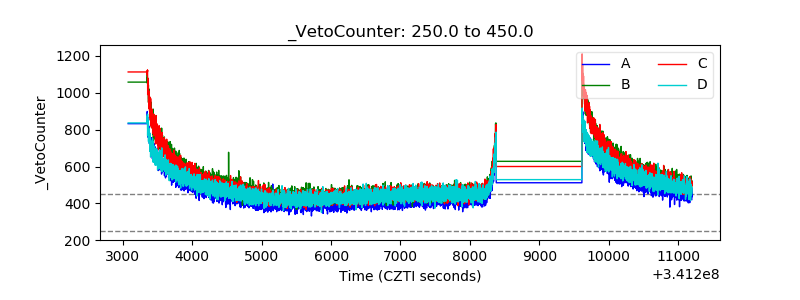 |