| Param | Original file | Final file |
|---|---|---|
| Filename | modeM0/AS1T03_249T01_9000003934_27429cztM0_level2.evt | modeM0/AS1T03_249T01_9000003934_27429cztM0_level2_quad_clean.evt |
| Size (bytes) | 550,465,920 | 102,090,240 |
| Size | 525.0 MB | 97.4 MB |
| Events in quadrant A | 3,372,740 | 679,028 |
| Events in quadrant B | 3,434,023 | 693,027 |
| Events in quadrant C | 3,792,534 | 650,464 |
| Events in quadrant D | 5,631,038 | 616,042 |
| Mode M0 | |||
|---|---|---|---|
| Quadrant | BADHDUFLAG | Total packets | Discarded packets |
| A | 0 | 13740 | 0 |
| B | 0 | 14018 | 0 |
| C | 0 | 15224 | 0 |
| D | 0 | 21039 | 0 |
| Mode M9 | |||
|---|---|---|---|
| Quadrant | BADHDUFLAG | Total packets | Discarded packets |
| A | 0 | 17 | 0 |
| B | 0 | 18 | 0 |
| C | 0 | 18 | 0 |
| D | 0 | 18 | 0 |
| Quadrant | Total seconds | Saturated seconds | Saturation percentage |
|---|---|---|---|
| A | 6498 | 39 | 0.600185% |
| B | 6498 | 60 | 0.923361% |
| C | 6498 | 143 | 2.200677% |
| D | 6498 | 704 | 10.834103% |
Noise dominated data is calculated using 1-second bins in cleaned event files. If a bin has >2000 counts, and if more than 50% of those come from <1% of pixels, then it is considered to be noise-dominated and hence unusable.
| Quadrant | # 1 sec bins | Bins with >0 counts | Bins with >2000 counts | High rate bins dominated by noise | Noise dominated (total time) | Noise dominated (detector-on time) | Marked lightcurve |
|---|---|---|---|---|---|---|---|
| A | 7763 | 6499 | 0 | 0 | 0.00% | 0.00% | 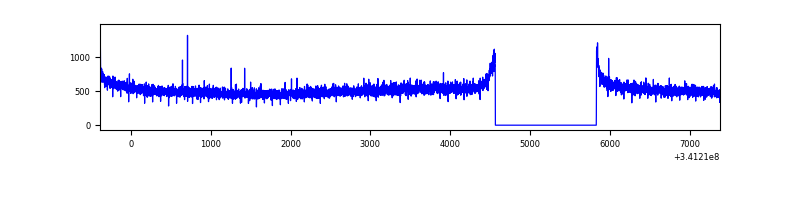 |
| B | 7763 | 6499 | 0 | 0 | 0.00% | 0.00% | 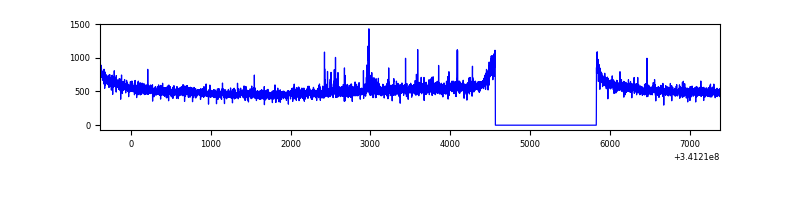 |
| C | 7763 | 6499 | 38 | 38 | 0.49% | 0.58% | 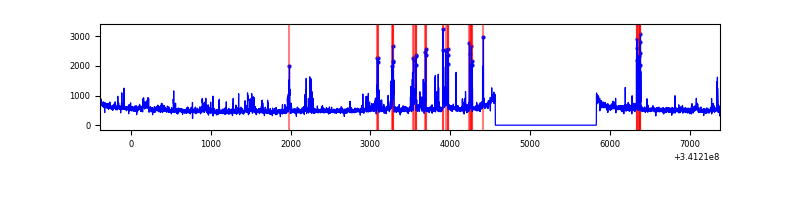 |
| D | 7763 | 6499 | 601 | 601 | 7.74% | 9.25% | 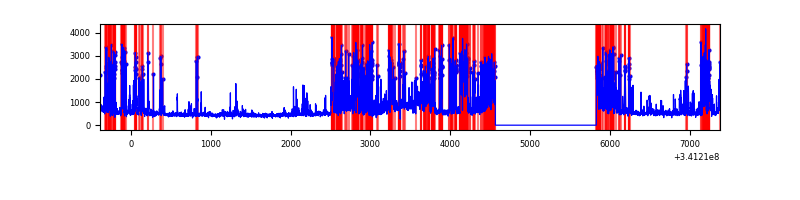 |
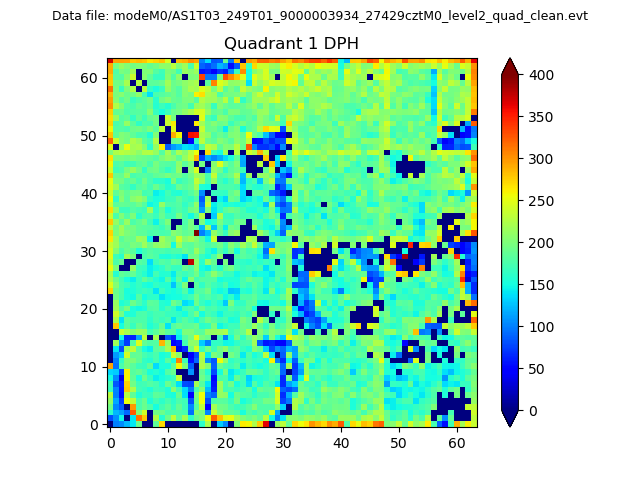
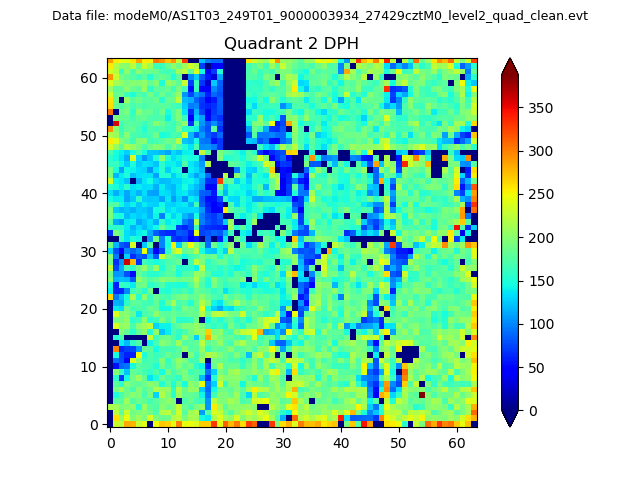
Top three noisy pixels from each quadrant. If the there are fewer than three noisy pixels in the level2.evt file, extra rows are filled as -1
| Pixel properties | Quadrant properties | ||||||
|---|---|---|---|---|---|---|---|
| Quadrant | DetID | PixID | Counts | Sigma | Mean | Median | Sigma |
| A | 13 | 254 | 9503 | 50.34 | 873 | 859 | 171.7 |
| A | 0 | 226 | 7505 | 38.71 | 873 | 859 | 171.7 |
| A | 3 | 137 | 7384 | 38.0 | 873 | 859 | 171.7 |
| B | 12 | 111 | 18842 | 110.46 | 867 | 846 | 162.9 |
| B | 11 | 111 | 17143 | 100.03 | 867 | 846 | 162.9 |
| B | 14 | 111 | 16061 | 93.39 | 867 | 846 | 162.9 |
| C | 7 | 221 | 275894 | 1441.65 | 828 | 834 | 190.8 |
| C | 14 | 238 | 136625 | 711.71 | 828 | 834 | 190.8 |
| C | 10 | 22 | 82634 | 428.73 | 828 | 834 | 190.8 |
| D | 1 | 52 | 2240466 | 12058.56 | 796 | 779 | 185.7 |
| D | 13 | 168 | 145275 | 777.97 | 796 | 779 | 185.7 |
| D | 2 | 250 | 105709 | 564.95 | 796 | 779 | 185.7 |
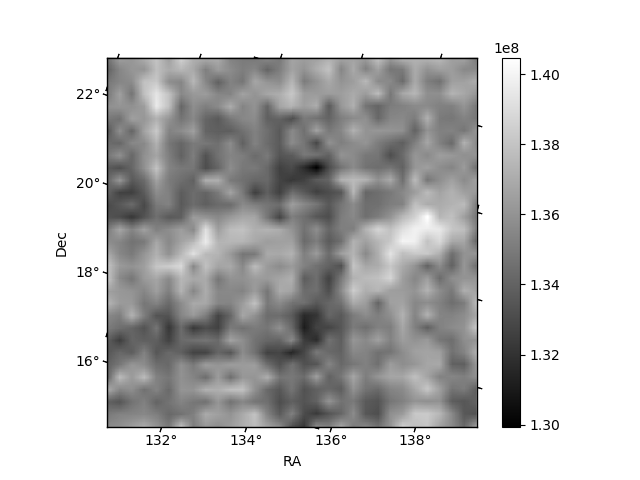
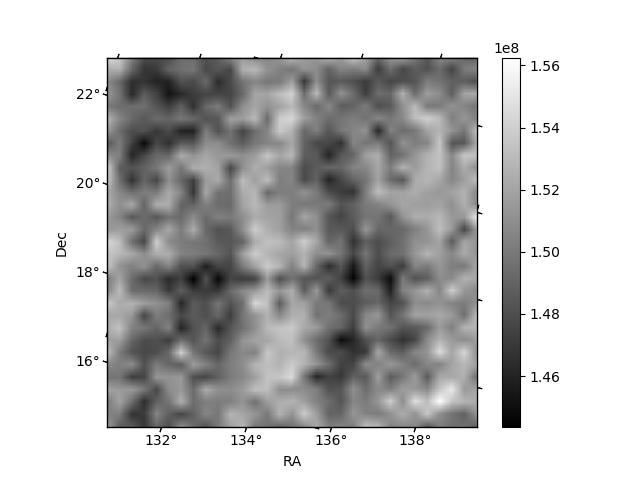
Histogram calculated using DETX and DETY for each event in the final _common_clean file
| Quadrant A | 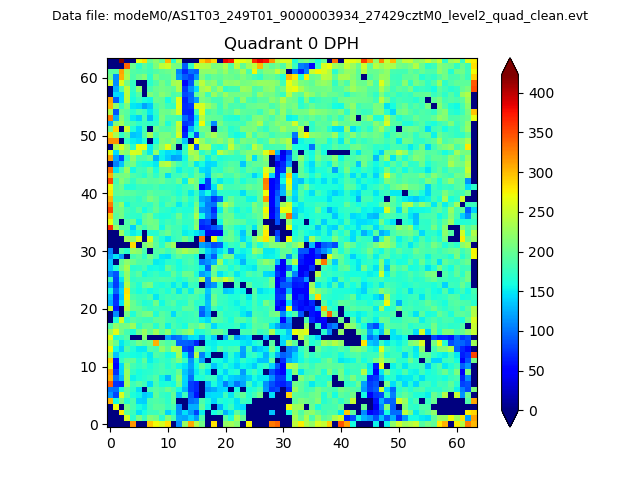 |
 |
Quadrant B |
|---|---|---|---|
| Quadrant D | 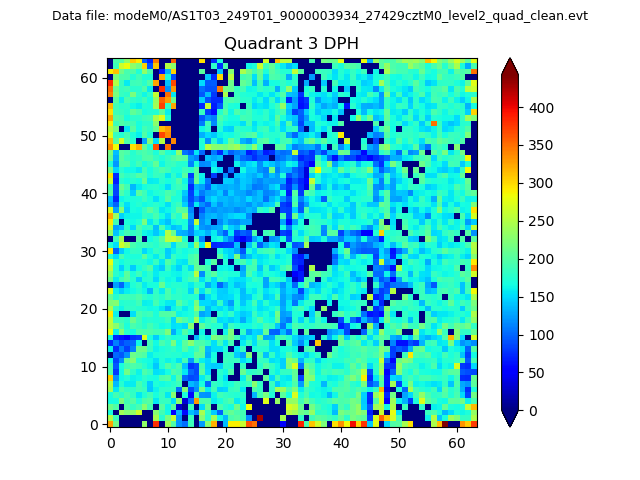 |
 |
Quadrant C |
| Plot type | Count rate plots | Images |
|---|---|---|
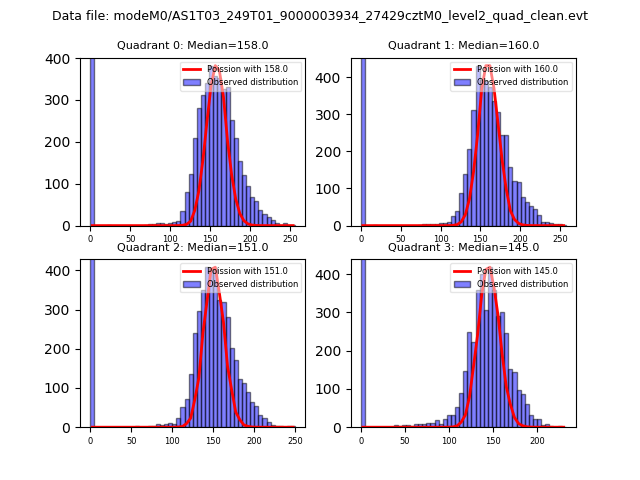
| Comparison with Poisson distribution Blue bars denote a histogram of data divided into 1 sec bins. Red curve is a Poisson curve with rate = median count rate of data. |
 |
 |
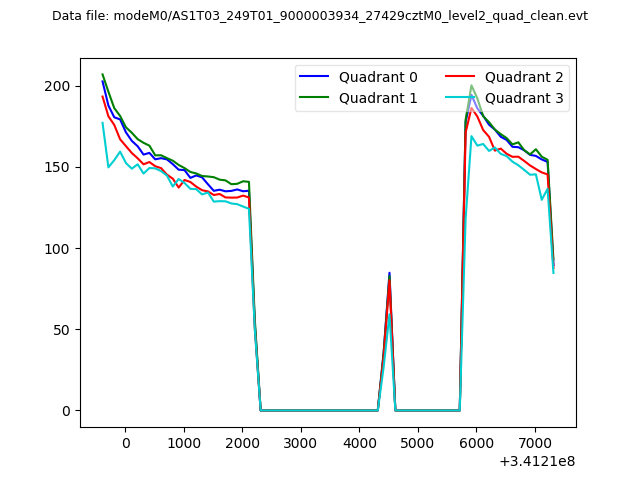
| Quadrant-wise count rates Data is divided into 100 sec bins |
 |
|
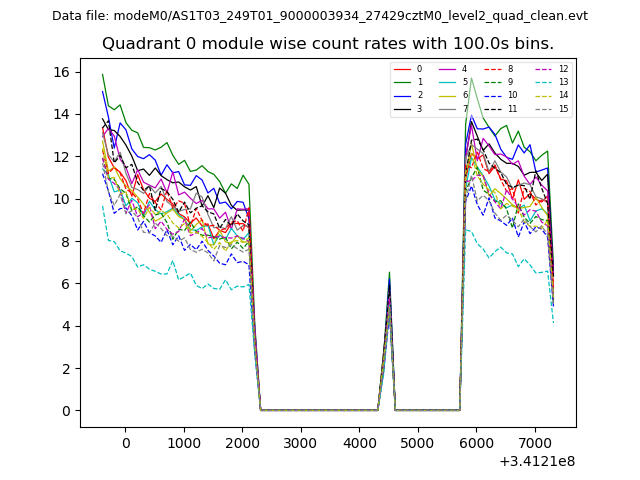
| Module-wise count rates for Quadrant A Data is divided into 100 sec bins |
 |
 |
| Module-wise count rates for Quadrant B Data is divided into 100 sec bins |
 |
 |
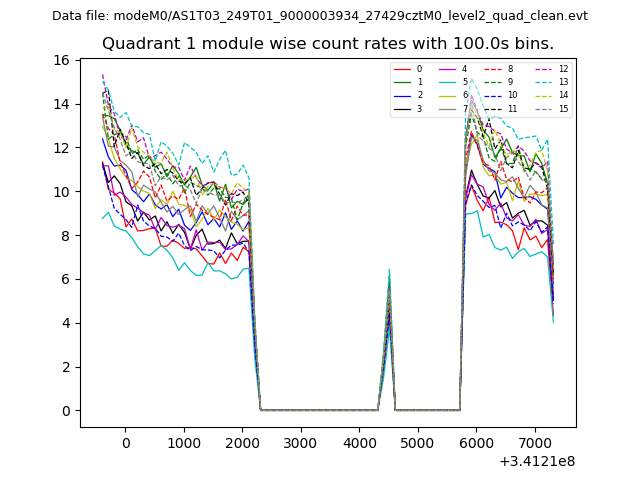
| Module-wise count rates for Quadrant C Data is divided into 100 sec bins |
 |
 |
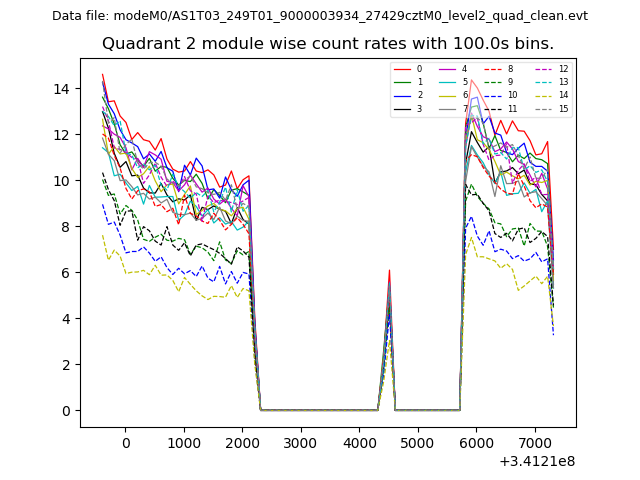
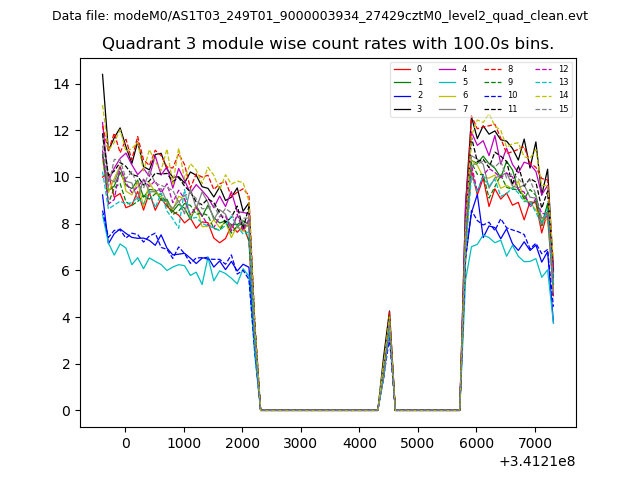
| Module-wise count rates for Quadrant D Data is divided into 100 sec bins |
 |
 |
| Parameter | Plot |
|---|---|
| CZT HV Monitor | 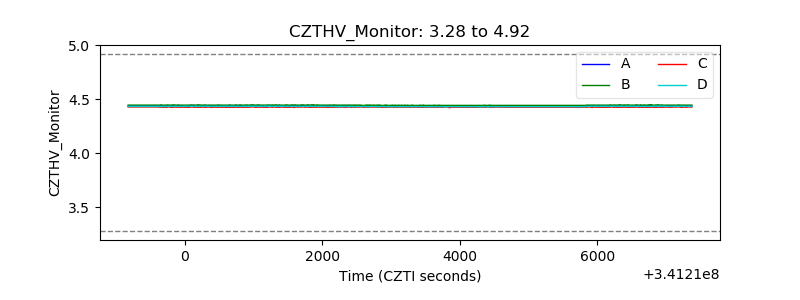 |
| D_VDD | 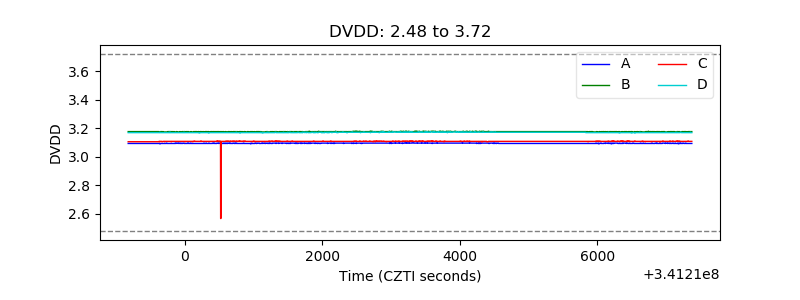 |
| Temperature 1 | 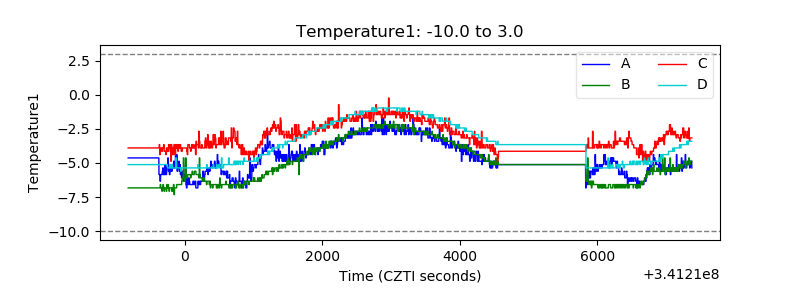 |
| Veto HV Monitor | 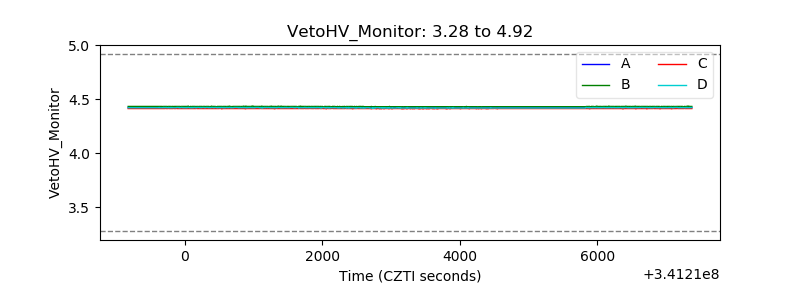 |
| Veto LLD | 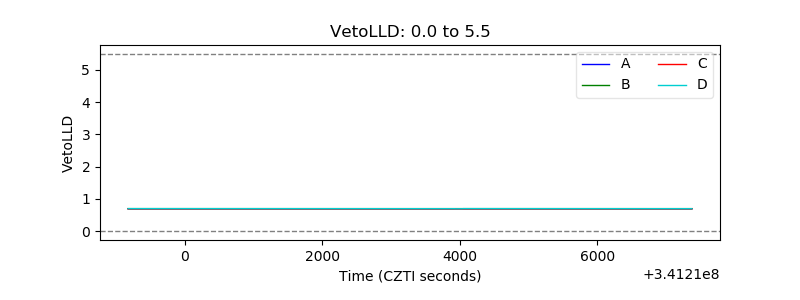 |
| Alpha Counter | 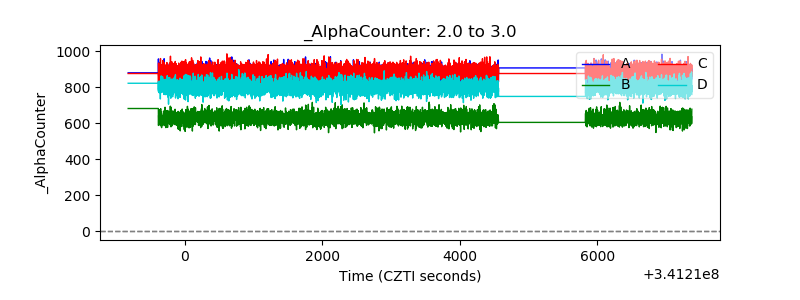 |
| _CPM_Rate | 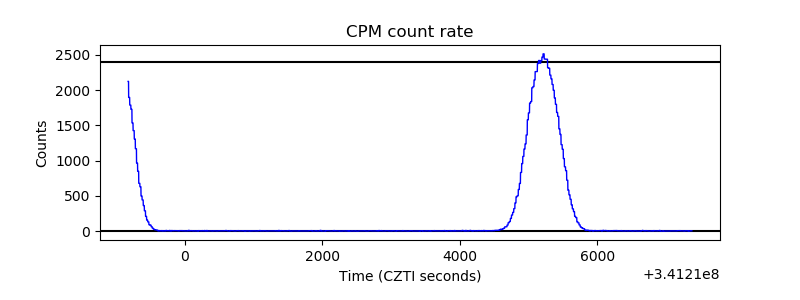 |
| CZT Counter | 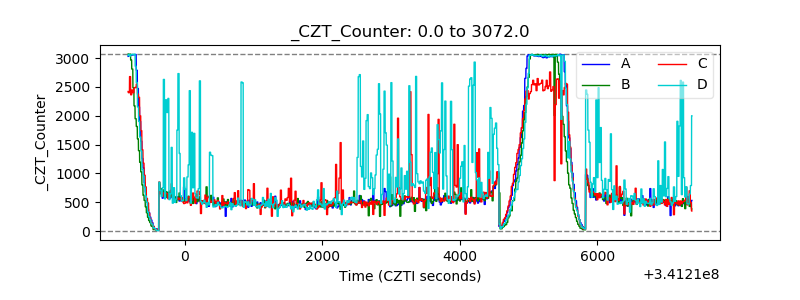 |
| +2.5 Volts monitor |  |
| +5 Volts monitor |  |
| _ROLL_ROT | 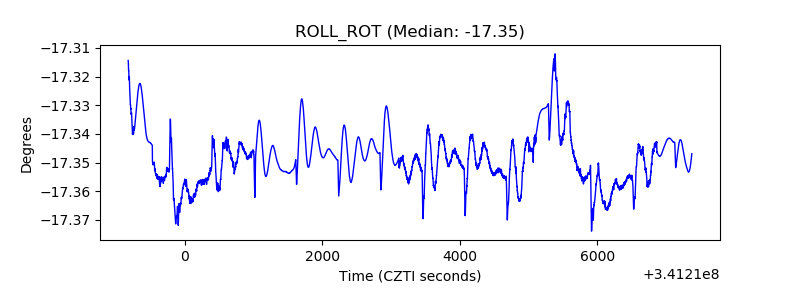 |
| _Roll_DEC | 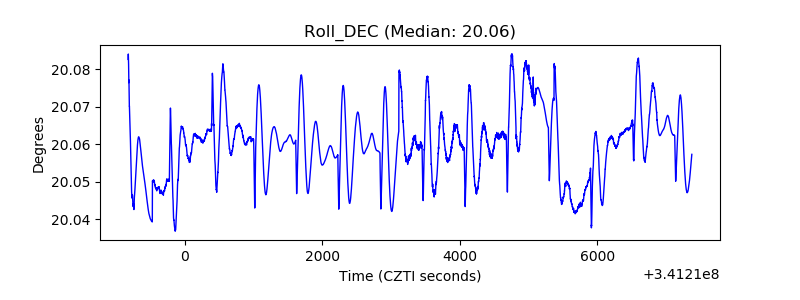 |
| _Roll_RA | 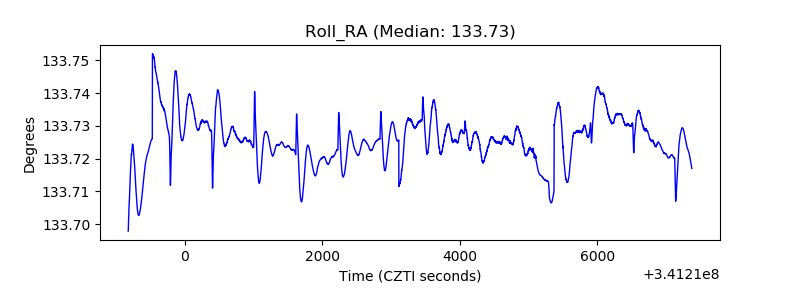 |
| Veto Counter |  |