| Param | Original file | Final file |
|---|---|---|
| Filename | modeM0/AS1T03_249T01_9000003934_27430cztM0_level2.evt | modeM0/AS1T03_249T01_9000003934_27430cztM0_level2_quad_clean.evt |
| Size (bytes) | 573,462,720 | 94,628,160 |
| Size | 546.9 MB | 90.2 MB |
| Events in quadrant A | 3,221,305 | 633,452 |
| Events in quadrant B | 3,310,975 | 638,679 |
| Events in quadrant C | 3,388,261 | 603,614 |
| Events in quadrant D | 7,025,790 | 555,834 |
| Mode M0 | |||
|---|---|---|---|
| Quadrant | BADHDUFLAG | Total packets | Discarded packets |
| A | 0 | 12978 | 0 |
| B | 0 | 13308 | 0 |
| C | 0 | 13577 | 0 |
| D | 0 | 25086 | 0 |
| Mode M9 | |||
|---|---|---|---|
| Quadrant | BADHDUFLAG | Total packets | Discarded packets |
| A | 0 | 13 | 0 |
| B | 0 | 13 | 0 |
| C | 0 | 13 | 0 |
| D | 0 | 13 | 0 |
| Quadrant | Total seconds | Saturated seconds | Saturation percentage |
|---|---|---|---|
| A | 6217 | 30 | 0.482548% |
| B | 6218 | 53 | 0.852364% |
| C | 6218 | 104 | 1.672564% |
| D | 6217 | 1151 | 18.513753% |
Noise dominated data is calculated using 1-second bins in cleaned event files. If a bin has >2000 counts, and if more than 50% of those come from <1% of pixels, then it is considered to be noise-dominated and hence unusable.
| Quadrant | # 1 sec bins | Bins with >0 counts | Bins with >2000 counts | High rate bins dominated by noise | Noise dominated (total time) | Noise dominated (detector-on time) | Marked lightcurve |
|---|---|---|---|---|---|---|---|
| A | 7517 | 6218 | 0 | 0 | 0.00% | 0.00% | 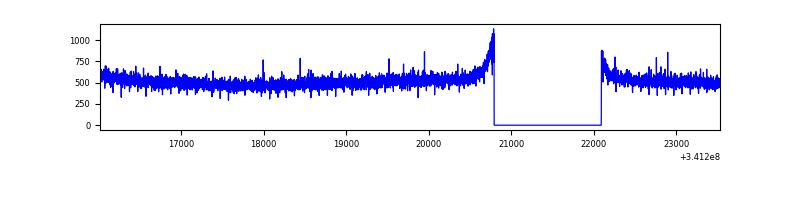 |
| B | 7518 | 6219 | 7 | 7 | 0.09% | 0.11% | 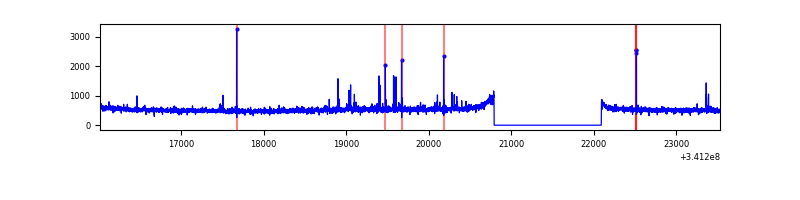 |
| C | 7518 | 6219 | 17 | 17 | 0.23% | 0.27% | 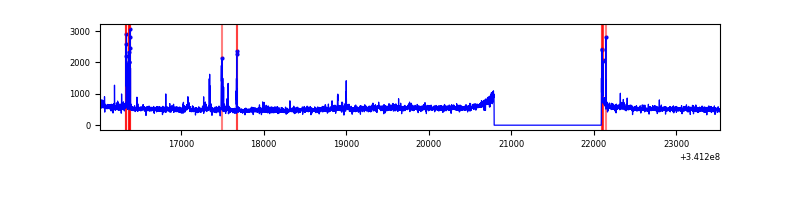 |
| D | 7517 | 6217 | 1074 | 1074 | 14.29% | 17.28% | 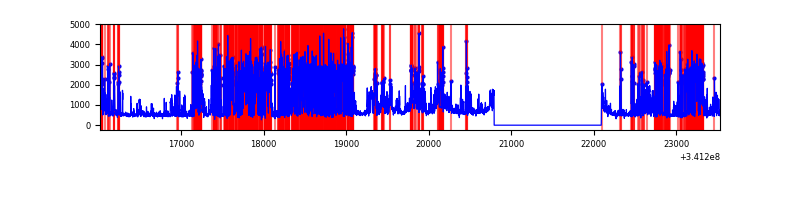 |
Top three noisy pixels from each quadrant. If the there are fewer than three noisy pixels in the level2.evt file, extra rows are filled as -1
| Pixel properties | Quadrant properties | ||||||
|---|---|---|---|---|---|---|---|
| Quadrant | DetID | PixID | Counts | Sigma | Mean | Median | Sigma |
| A | 13 | 254 | 10101 | 56.08 | 835 | 820 | 165.5 |
| A | 0 | 226 | 7313 | 39.23 | 835 | 820 | 165.5 |
| A | 3 | 137 | 7218 | 38.66 | 835 | 820 | 165.5 |
| B | 0 | 189 | 30252 | 191.12 | 821 | 803 | 154.1 |
| B | 12 | 111 | 18209 | 112.96 | 821 | 803 | 154.1 |
| B | 0 | 190 | 17556 | 108.73 | 821 | 803 | 154.1 |
| C | 14 | 238 | 129124 | 696.75 | 791 | 798 | 184.2 |
| C | 2 | 16 | 99832 | 537.71 | 791 | 798 | 184.2 |
| C | 7 | 221 | 55871 | 299.02 | 791 | 798 | 184.2 |
| D | 1 | 52 | 3902207 | 22400.61 | 742 | 724 | 174.2 |
| D | 12 | 227 | 187580 | 1072.84 | 742 | 724 | 174.2 |
| D | 2 | 250 | 58401 | 331.15 | 742 | 724 | 174.2 |
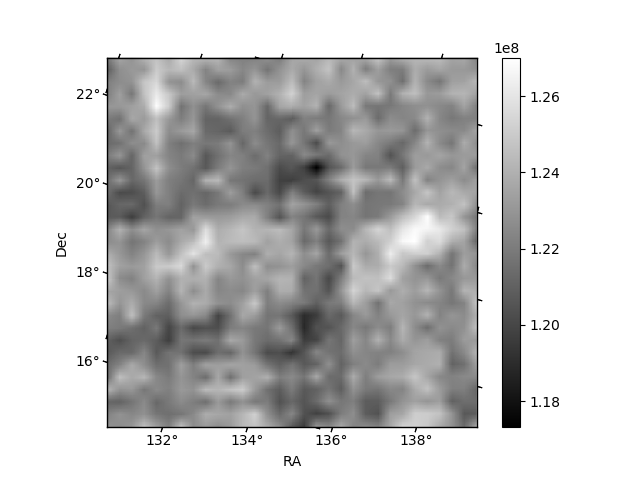
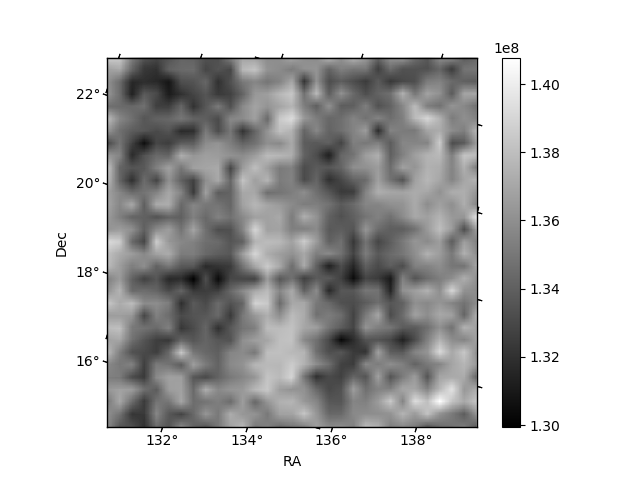
Histogram calculated using DETX and DETY for each event in the final _common_clean file
| Quadrant A | 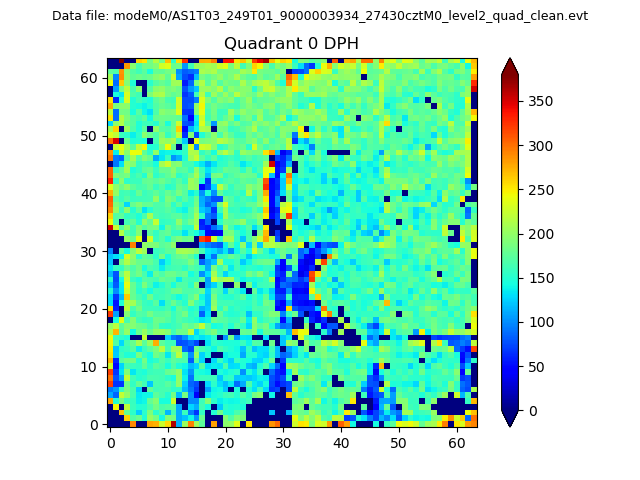 |
 |
Quadrant B |
|---|---|---|---|
| Quadrant D | 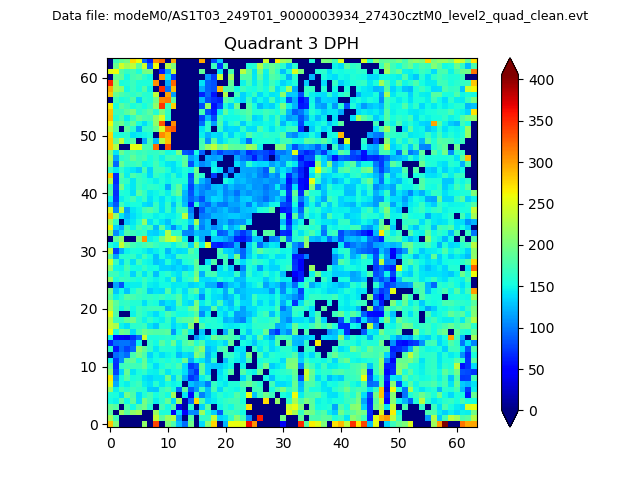 |
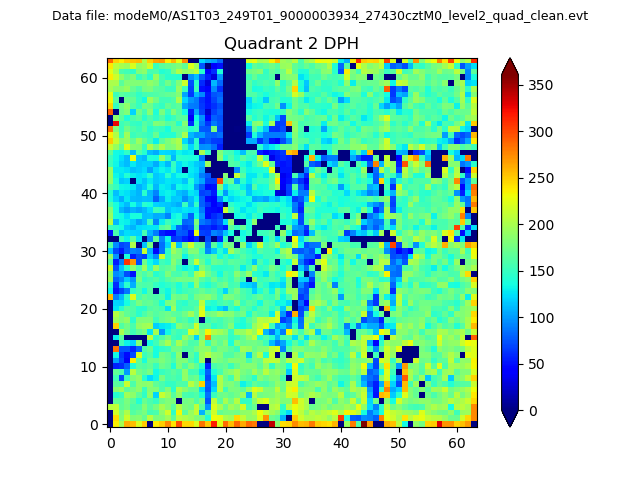 |
Quadrant C |
| Plot type | Count rate plots | Images |
|---|---|---|
| Comparison with Poisson distribution Blue bars denote a histogram of data divided into 1 sec bins. Red curve is a Poisson curve with rate = median count rate of data. |
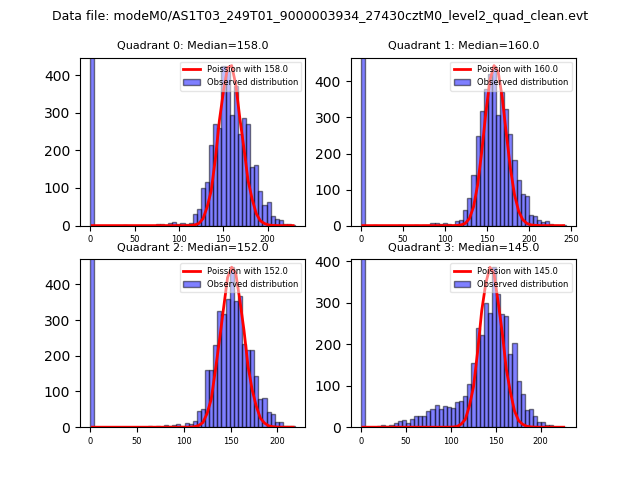 |
 |
| Quadrant-wise count rates Data is divided into 100 sec bins |
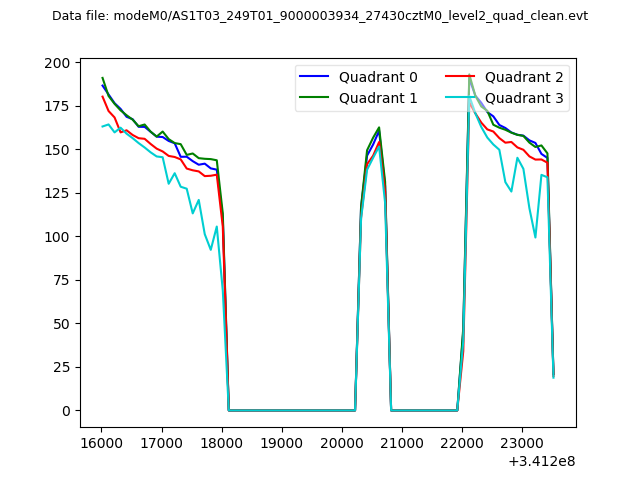 |
|
| Module-wise count rates for Quadrant A Data is divided into 100 sec bins |
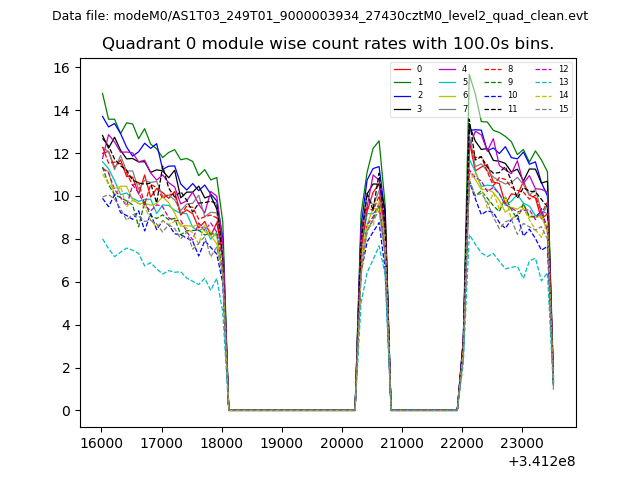 |
 |
| Module-wise count rates for Quadrant B Data is divided into 100 sec bins |
 |
 |
| Module-wise count rates for Quadrant C Data is divided into 100 sec bins |
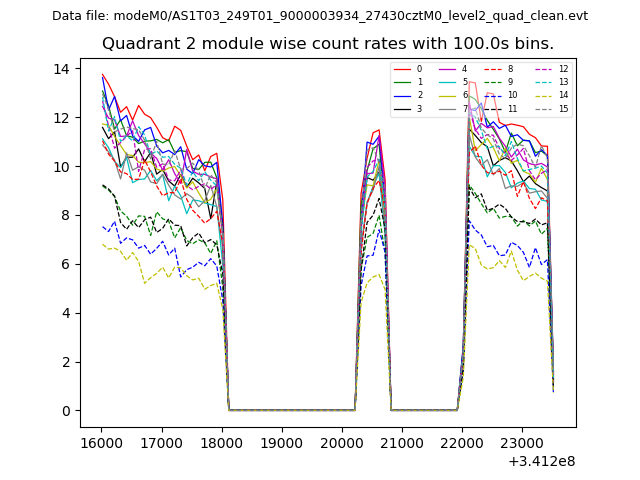 |
 |
| Module-wise count rates for Quadrant D Data is divided into 100 sec bins |
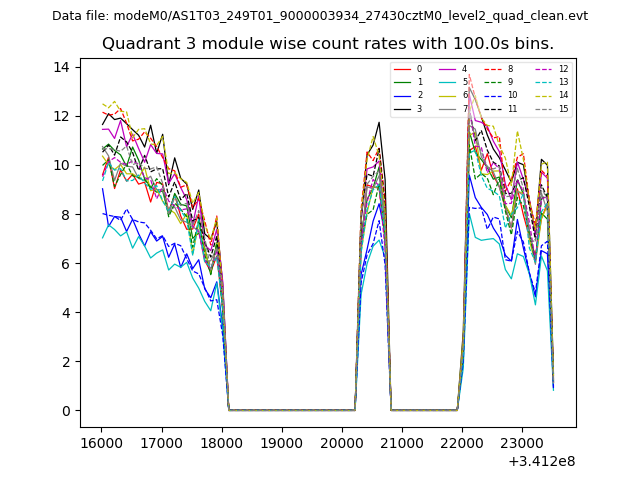 |
 |
| Parameter | Plot |
|---|---|
| CZT HV Monitor | 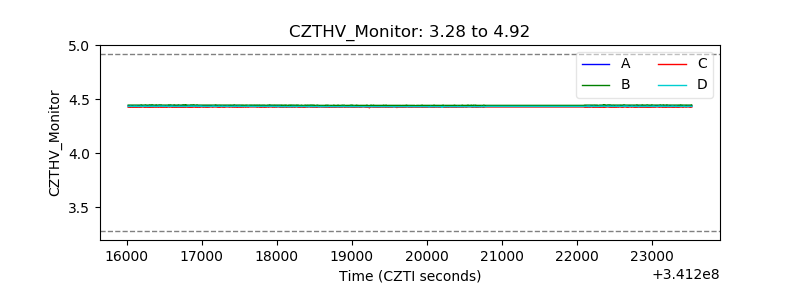 |
| D_VDD | 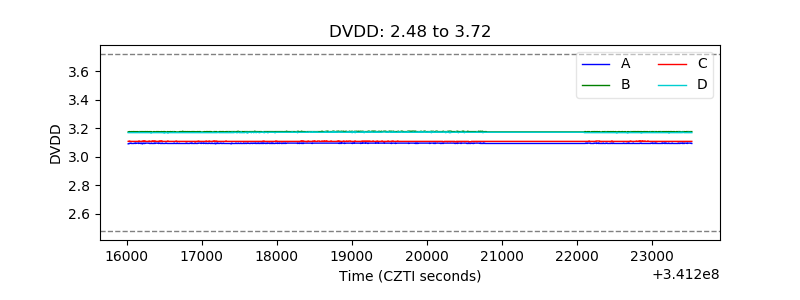 |
| Temperature 1 | 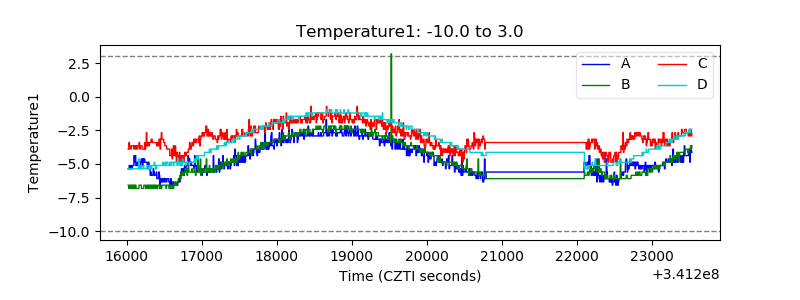 |
| Veto HV Monitor | 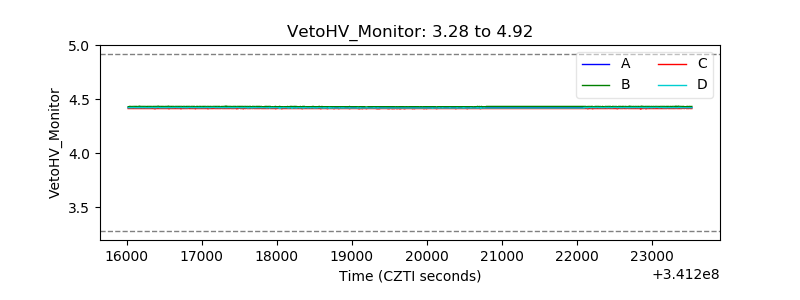 |
| Veto LLD | 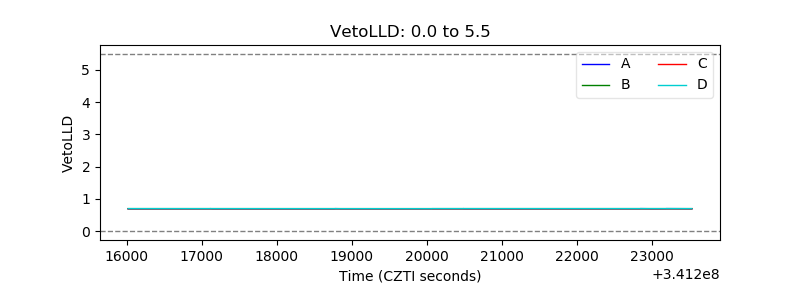 |
| Alpha Counter | 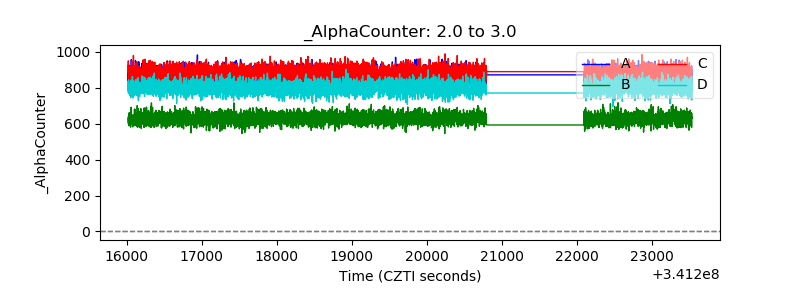 |
| _CPM_Rate | 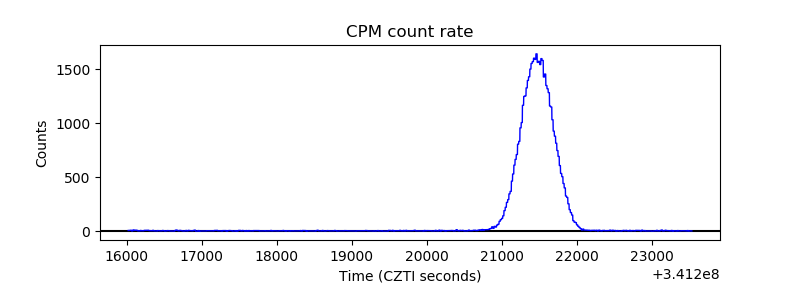 |
| CZT Counter | 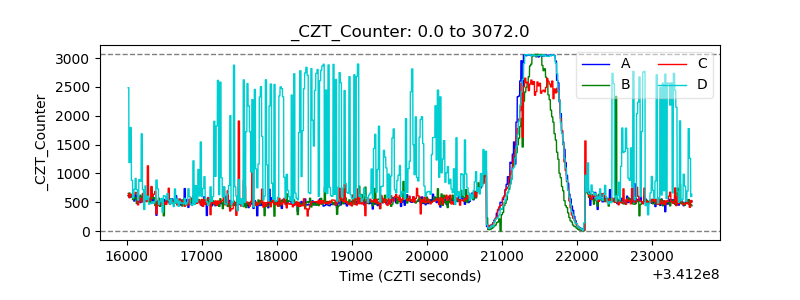 |
| +2.5 Volts monitor |  |
| +5 Volts monitor |  |
| _ROLL_ROT | 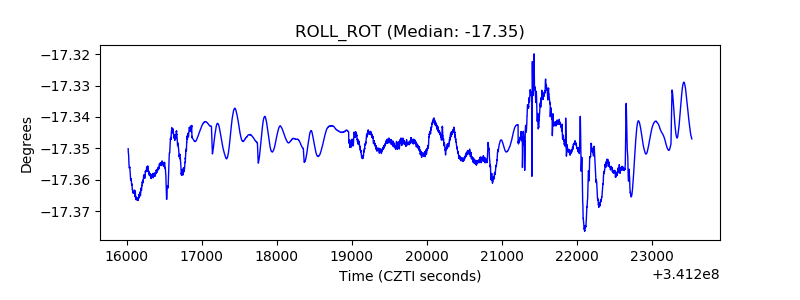 |
| _Roll_DEC | 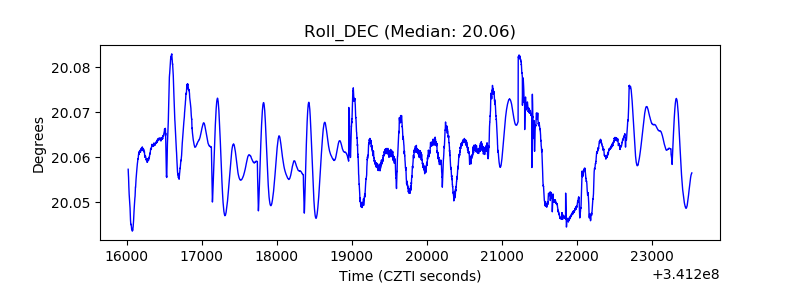 |
| _Roll_RA | 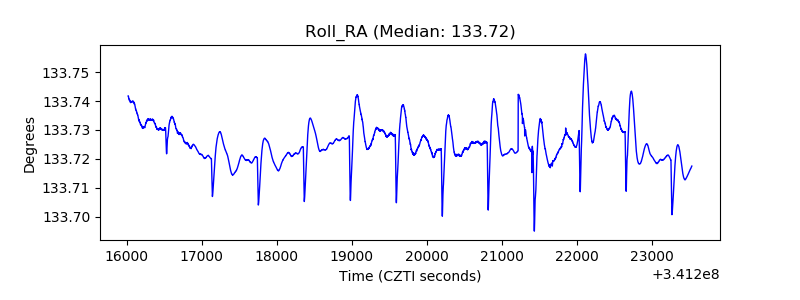 |
| Veto Counter | 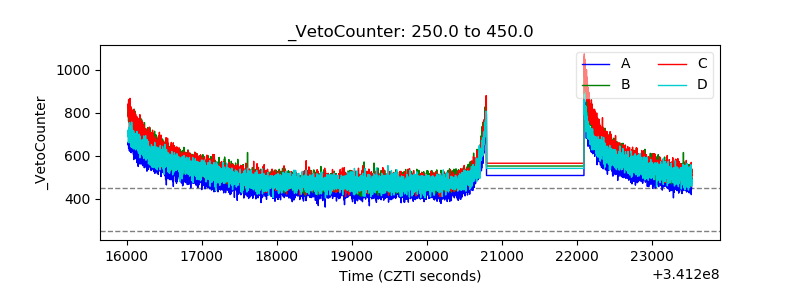 |