| Param | Original file | Final file |
|---|---|---|
| Filename | modeM0/AS1T03_249T01_9000003934_27431cztM0_level2.evt | modeM0/AS1T03_249T01_9000003934_27431cztM0_level2_quad_clean.evt |
| Size (bytes) | 563,555,520 | 94,501,440 |
| Size | 537.4 MB | 90.1 MB |
| Events in quadrant A | 3,250,735 | 626,053 |
| Events in quadrant B | 3,313,780 | 629,249 |
| Events in quadrant C | 3,273,795 | 598,866 |
| Events in quadrant D | 6,799,861 | 565,948 |
| Mode M0 | |||
|---|---|---|---|
| Quadrant | BADHDUFLAG | Total packets | Discarded packets |
| A | 0 | 13134 | 0 |
| B | 0 | 13339 | 0 |
| C | 0 | 13218 | 0 |
| D | 0 | 24383 | 0 |
| Mode M9 | |||
|---|---|---|---|
| Quadrant | BADHDUFLAG | Total packets | Discarded packets |
| A | 0 | 12 | 0 |
| B | 0 | 12 | 0 |
| C | 0 | 12 | 0 |
| D | 0 | 12 | 0 |
| Quadrant | Total seconds | Saturated seconds | Saturation percentage |
|---|---|---|---|
| A | 6329 | 77 | 1.216622% |
| B | 6330 | 73 | 1.153239% |
| C | 6330 | 74 | 1.169036% |
| D | 6330 | 1211 | 19.131122% |
Noise dominated data is calculated using 1-second bins in cleaned event files. If a bin has >2000 counts, and if more than 50% of those come from <1% of pixels, then it is considered to be noise-dominated and hence unusable.
| Quadrant | # 1 sec bins | Bins with >0 counts | Bins with >2000 counts | High rate bins dominated by noise | Noise dominated (total time) | Noise dominated (detector-on time) | Marked lightcurve |
|---|---|---|---|---|---|---|---|
| A | 7529 | 6329 | 0 | 0 | 0.00% | 0.00% | 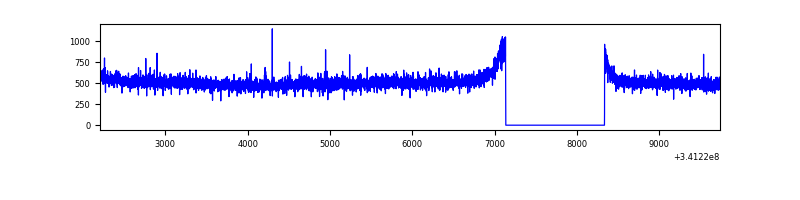 |
| B | 7530 | 6331 | 4 | 4 | 0.05% | 0.06% | 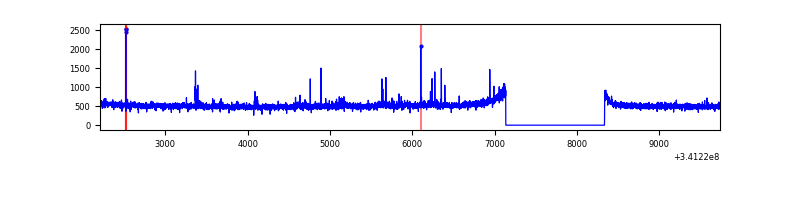 |
| C | 7530 | 6331 | 0 | 0 | 0.00% | 0.00% | 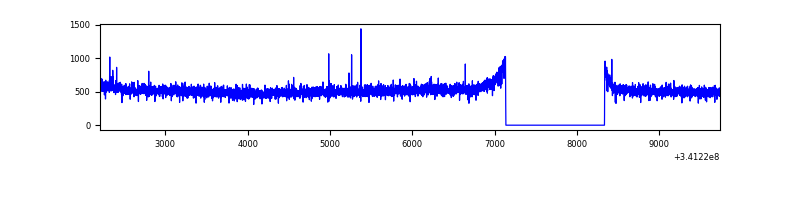 |
| D | 7530 | 6331 | 1131 | 1131 | 15.02% | 17.86% | 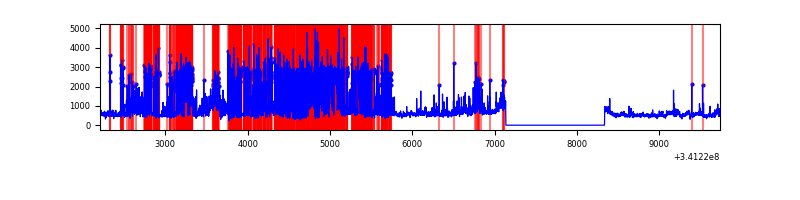 |
Top three noisy pixels from each quadrant. If the there are fewer than three noisy pixels in the level2.evt file, extra rows are filled as -1
| Pixel properties | Quadrant properties | ||||||
|---|---|---|---|---|---|---|---|
| Quadrant | DetID | PixID | Counts | Sigma | Mean | Median | Sigma |
| A | 13 | 254 | 9793 | 53.28 | 842 | 826 | 168.3 |
| A | 3 | 137 | 7503 | 39.67 | 842 | 826 | 168.3 |
| A | 0 | 226 | 7343 | 38.72 | 842 | 826 | 168.3 |
| B | 0 | 189 | 28587 | 178.13 | 824 | 805 | 156.0 |
| B | 0 | 190 | 20808 | 128.25 | 824 | 805 | 156.0 |
| B | 0 | 230 | 20041 | 123.34 | 824 | 805 | 156.0 |
| C | 14 | 238 | 129466 | 692.18 | 799 | 804 | 185.9 |
| C | 2 | 16 | 14676 | 74.63 | 799 | 804 | 185.9 |
| C | 7 | 221 | 10914 | 54.39 | 799 | 804 | 185.9 |
| D | 1 | 52 | 3886434 | 22126.69 | 742 | 723 | 175.6 |
| D | 2 | 250 | 78352 | 442.05 | 742 | 723 | 175.6 |
| D | 2 | 234 | 23486 | 129.62 | 742 | 723 | 175.6 |
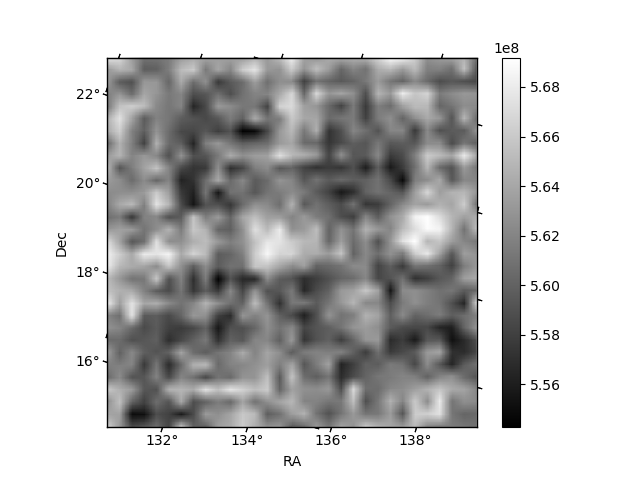
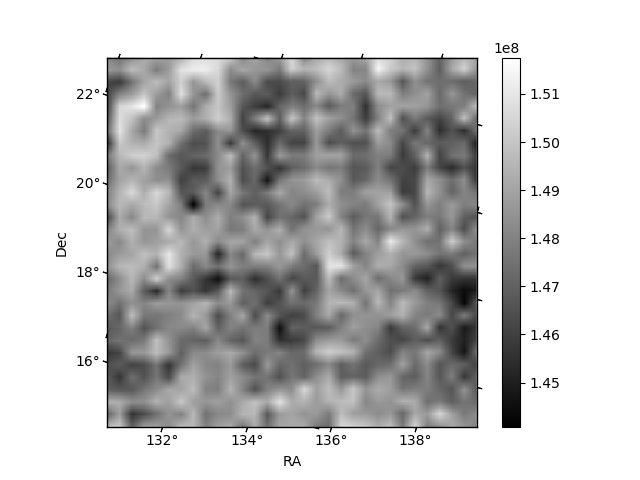
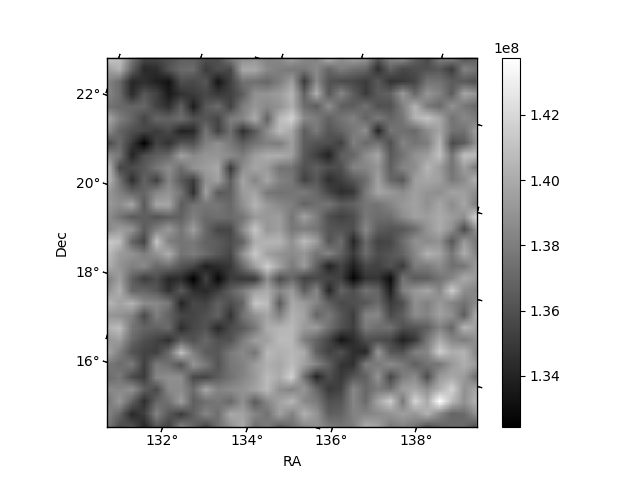
Histogram calculated using DETX and DETY for each event in the final _common_clean file
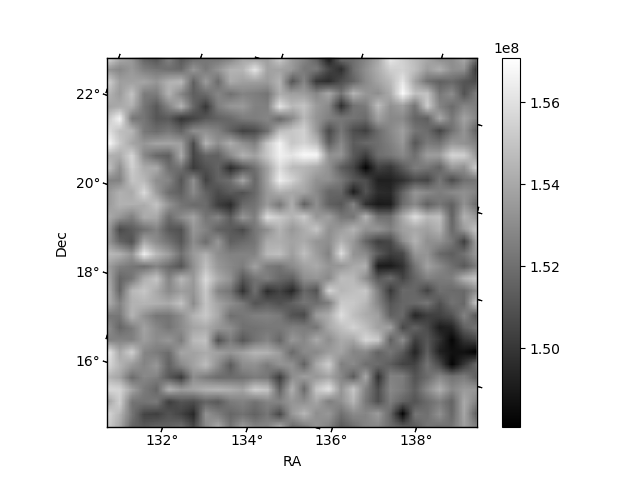
| Quadrant A | 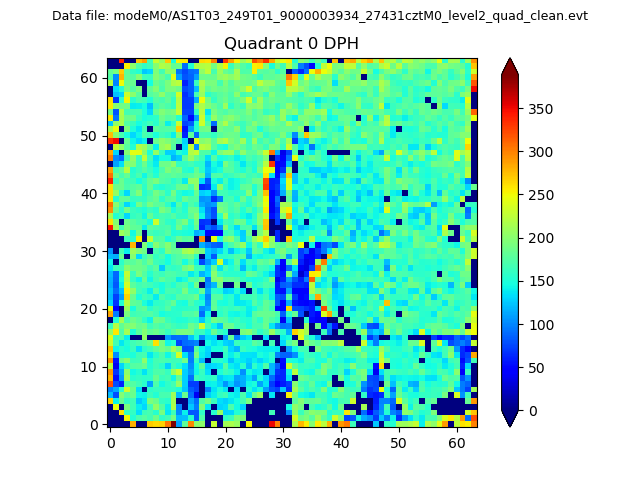 |
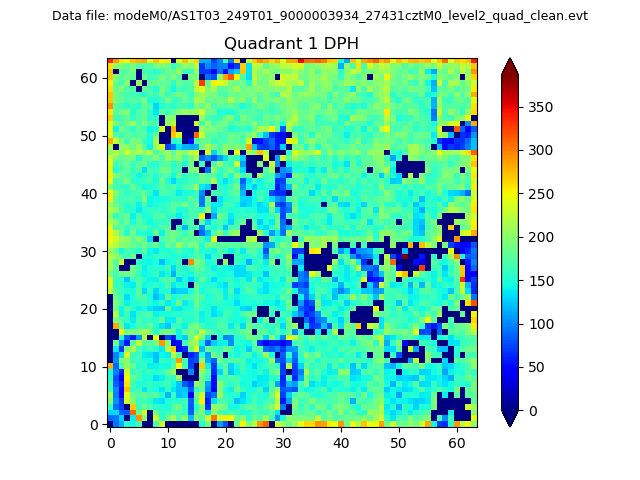 |
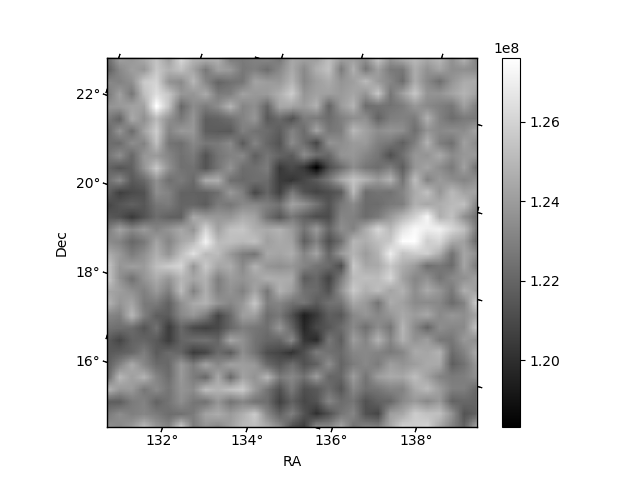
Quadrant B |
|---|---|---|---|
| Quadrant D | 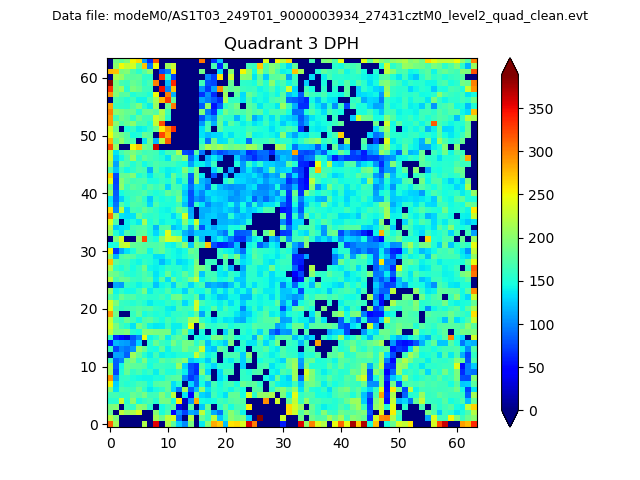 |
 |
Quadrant C |
| Plot type | Count rate plots | Images |
|---|---|---|
| Comparison with Poisson distribution Blue bars denote a histogram of data divided into 1 sec bins. Red curve is a Poisson curve with rate = median count rate of data. |
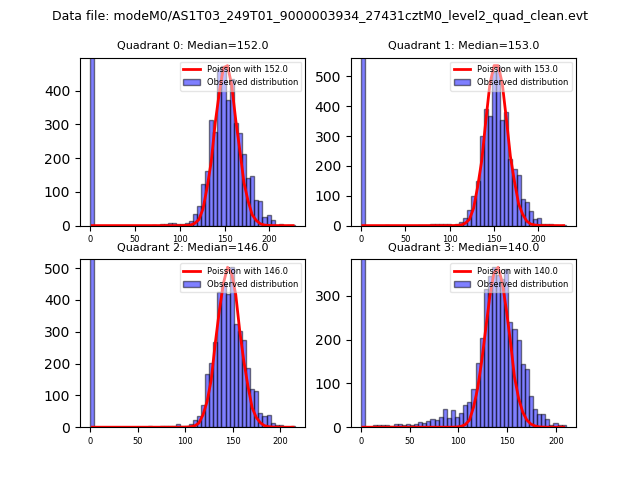 |
 |
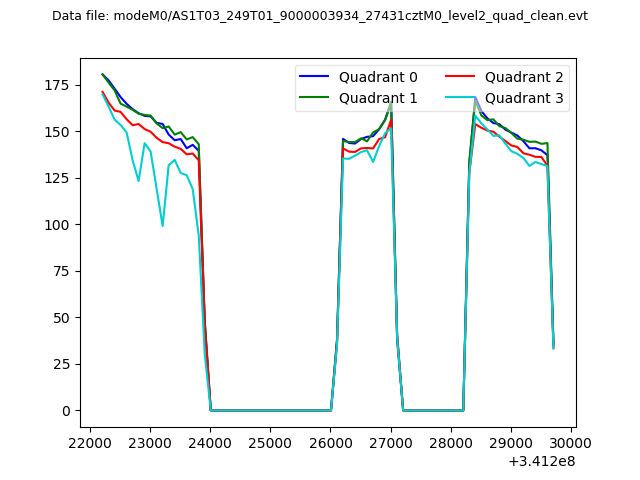
| Quadrant-wise count rates Data is divided into 100 sec bins |
 |
|
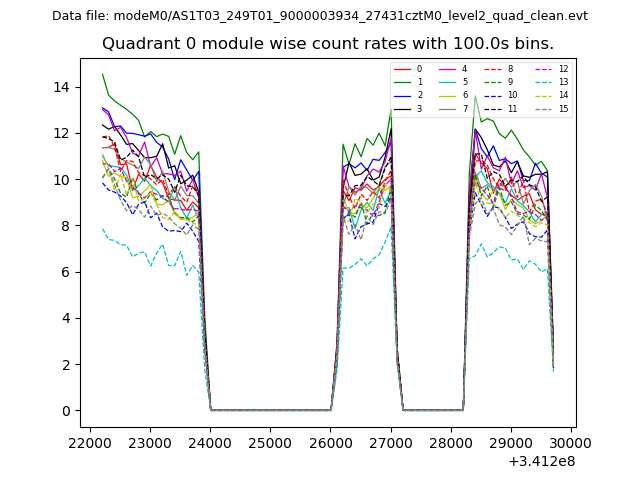
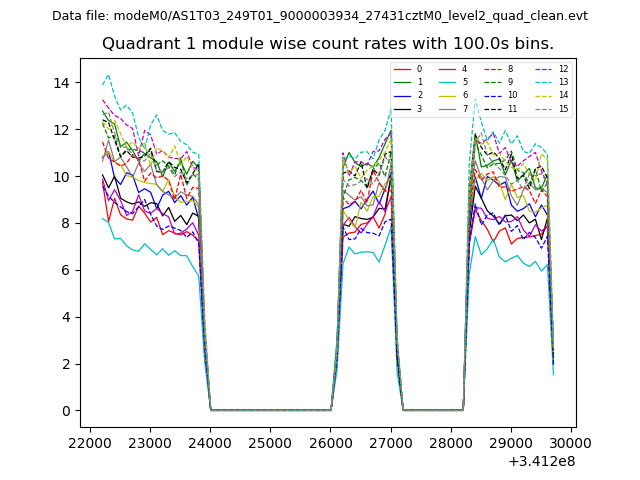
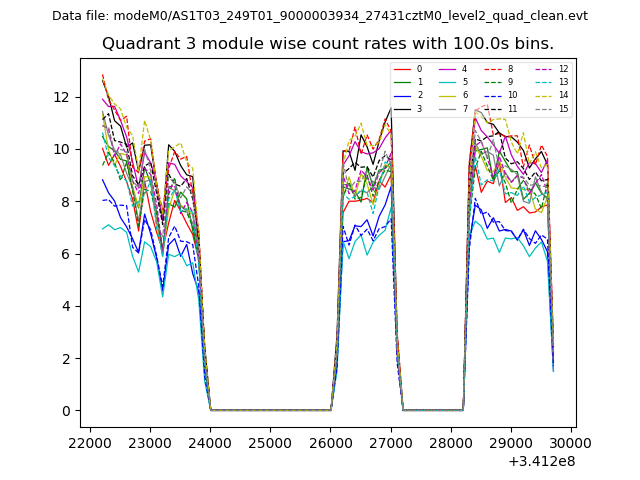
| Module-wise count rates for Quadrant A Data is divided into 100 sec bins |
 |
 |
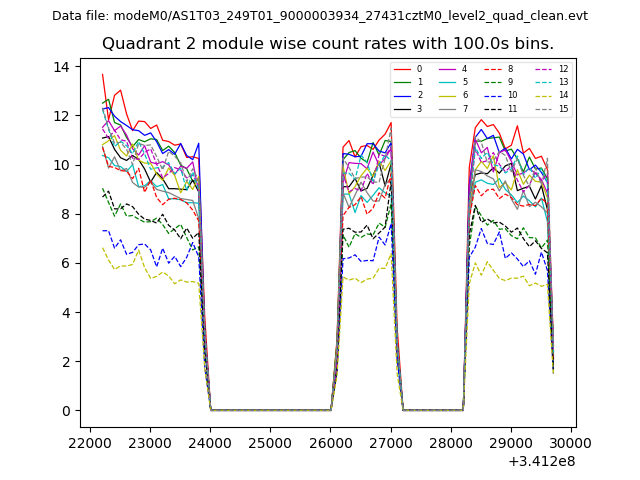
| Module-wise count rates for Quadrant B Data is divided into 100 sec bins |
 |
 |
| Module-wise count rates for Quadrant C Data is divided into 100 sec bins |
 |
 |
| Module-wise count rates for Quadrant D Data is divided into 100 sec bins |
 |
 |
| Parameter | Plot |
|---|---|
| CZT HV Monitor | 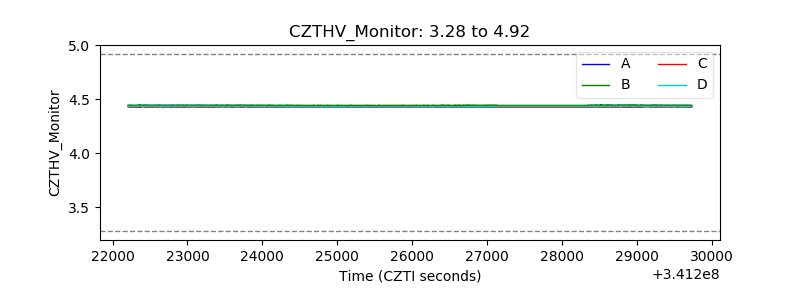 |
| D_VDD | 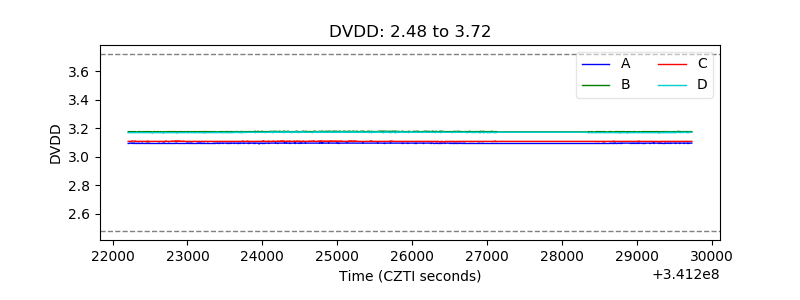 |
| Temperature 1 | 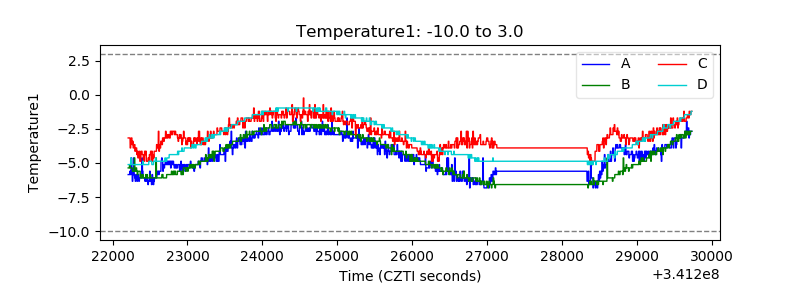 |
| Veto HV Monitor | 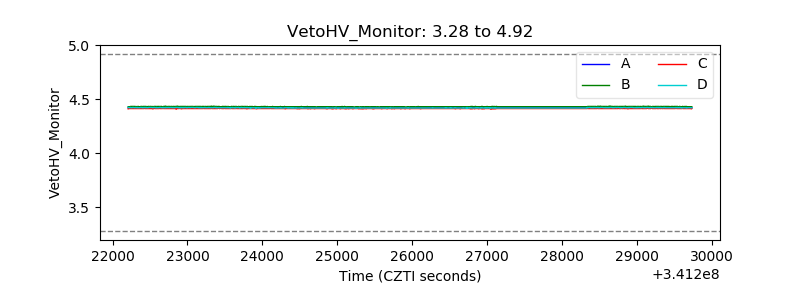 |
| Veto LLD |  |
| Alpha Counter | 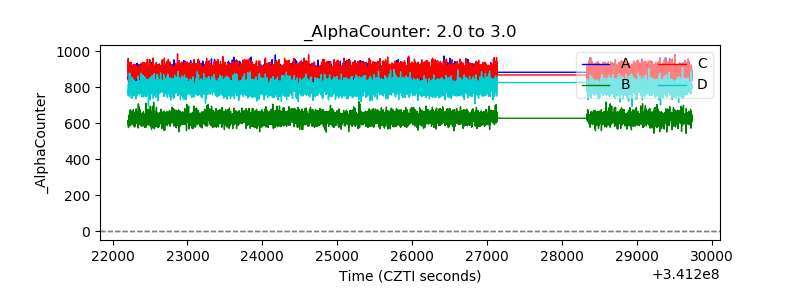 |
| _CPM_Rate | 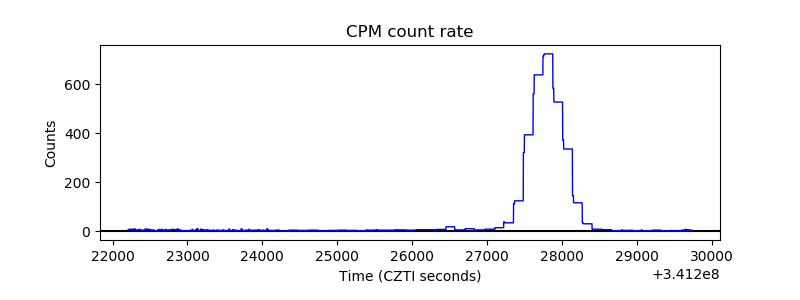 |
| CZT Counter |  |
| +2.5 Volts monitor | 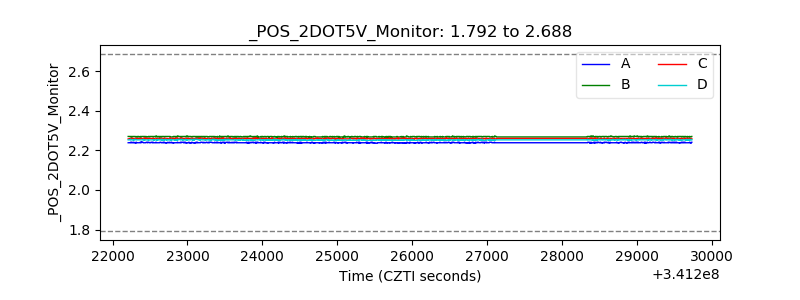 |
| +5 Volts monitor |  |
| _ROLL_ROT | 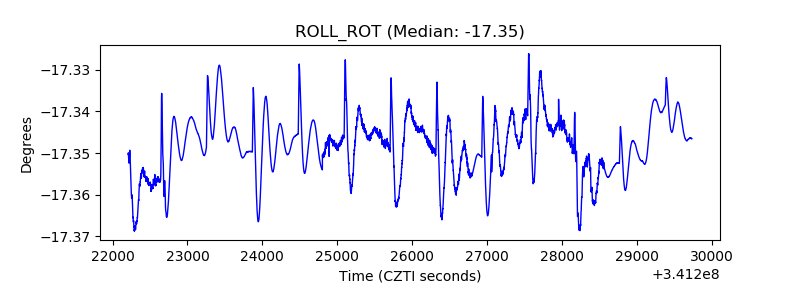 |
| _Roll_DEC | 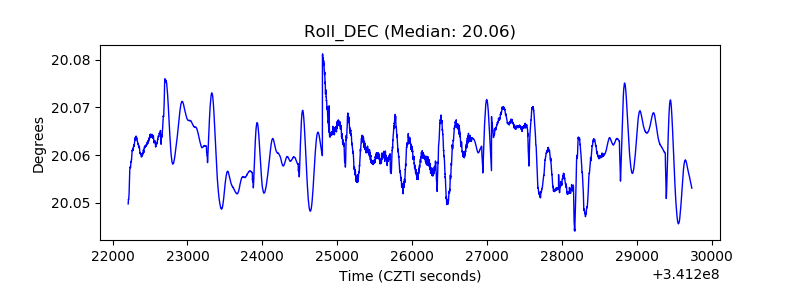 |
| _Roll_RA |  |
| Veto Counter | 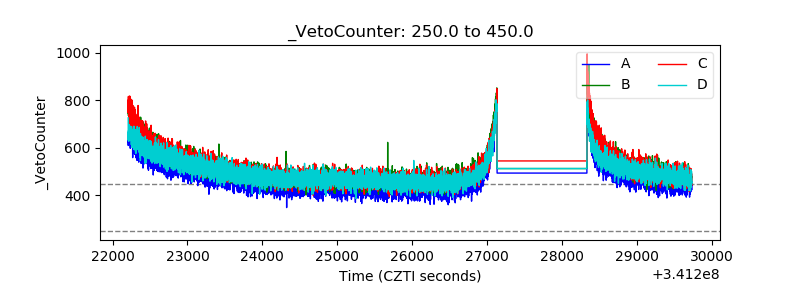 |