| Param | Original file | Final file |
|---|---|---|
| Filename | modeM0/AS1T03_249T01_9000003934_27432cztM0_level2.evt | modeM0/AS1T03_249T01_9000003934_27432cztM0_level2_quad_clean.evt |
| Size (bytes) | 432,365,760 | 74,496,960 |
| Size | 412.3 MB | 71.0 MB |
| Events in quadrant A | 2,965,035 | 469,671 |
| Events in quadrant B | 3,020,648 | 473,284 |
| Events in quadrant C | 2,978,948 | 452,514 |
| Events in quadrant D | 3,725,126 | 444,520 |
| Mode M0 | |||
|---|---|---|---|
| Quadrant | BADHDUFLAG | Total packets | Discarded packets |
| A | 0 | 12254 | 0 |
| B | 0 | 12414 | 0 |
| C | 0 | 12294 | 0 |
| D | 0 | 14824 | 0 |
| Mode M9 | |||
|---|---|---|---|
| Quadrant | BADHDUFLAG | Total packets | Discarded packets |
| A | 0 | 9 | 0 |
| B | 0 | 9 | 0 |
| C | 0 | 9 | 0 |
| D | 0 | 9 | 0 |
| Quadrant | Total seconds | Saturated seconds | Saturation percentage |
|---|---|---|---|
| A | 5947 | 111 | 1.866487% |
| B | 5948 | 115 | 1.933423% |
| C | 5948 | 125 | 2.101547% |
| D | 5948 | 138 | 2.320108% |
Noise dominated data is calculated using 1-second bins in cleaned event files. If a bin has >2000 counts, and if more than 50% of those come from <1% of pixels, then it is considered to be noise-dominated and hence unusable.
| Quadrant | # 1 sec bins | Bins with >0 counts | Bins with >2000 counts | High rate bins dominated by noise | Noise dominated (total time) | Noise dominated (detector-on time) | Marked lightcurve |
|---|---|---|---|---|---|---|---|
| A | 6882 | 5947 | 0 | 0 | 0.00% | 0.00% | 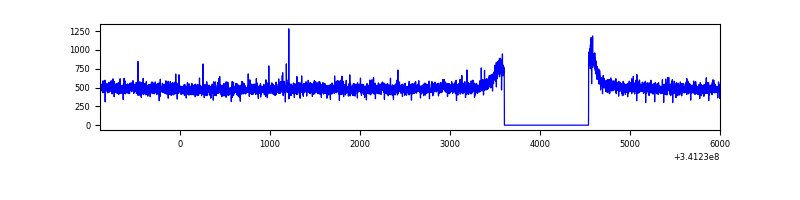 |
| B | 6883 | 5948 | 5 | 5 | 0.07% | 0.08% | 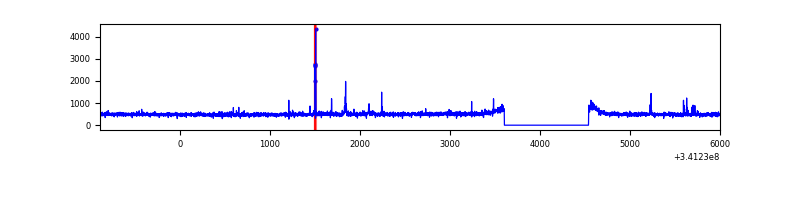 |
| C | 6883 | 5949 | 1 | 1 | 0.01% | 0.02% | 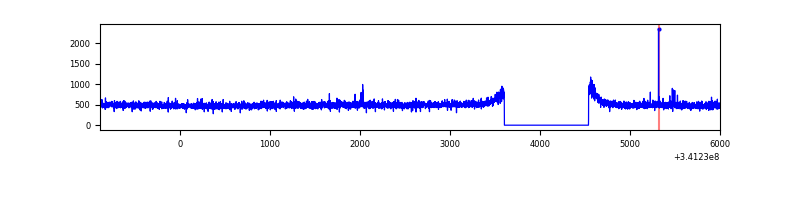 |
| D | 6883 | 5948 | 65 | 65 | 0.94% | 1.09% | 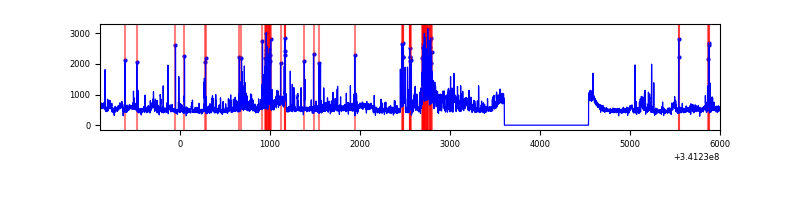 |
Top three noisy pixels from each quadrant. If the there are fewer than three noisy pixels in the level2.evt file, extra rows are filled as -1
| Pixel properties | Quadrant properties | ||||||
|---|---|---|---|---|---|---|---|
| Quadrant | DetID | PixID | Counts | Sigma | Mean | Median | Sigma |
| A | 13 | 254 | 9571 | 57.45 | 767 | 753 | 153.5 |
| A | 3 | 137 | 7190 | 41.94 | 767 | 753 | 153.5 |
| A | 0 | 226 | 6715 | 38.85 | 767 | 753 | 153.5 |
| B | 0 | 244 | 23121 | 154.03 | 751 | 733 | 145.3 |
| B | 12 | 111 | 17580 | 115.91 | 751 | 733 | 145.3 |
| B | 11 | 111 | 15760 | 103.39 | 751 | 733 | 145.3 |
| C | 14 | 238 | 115447 | 675.39 | 727 | 732 | 169.8 |
| C | 10 | 22 | 14132 | 78.89 | 727 | 732 | 169.8 |
| C | 2 | 16 | 8834 | 47.7 | 727 | 732 | 169.8 |
| D | 1 | 52 | 628638 | 3556.11 | 741 | 722 | 176.6 |
| D | 2 | 250 | 259671 | 1466.52 | 741 | 722 | 176.6 |
| D | 2 | 234 | 25115 | 138.15 | 741 | 722 | 176.6 |
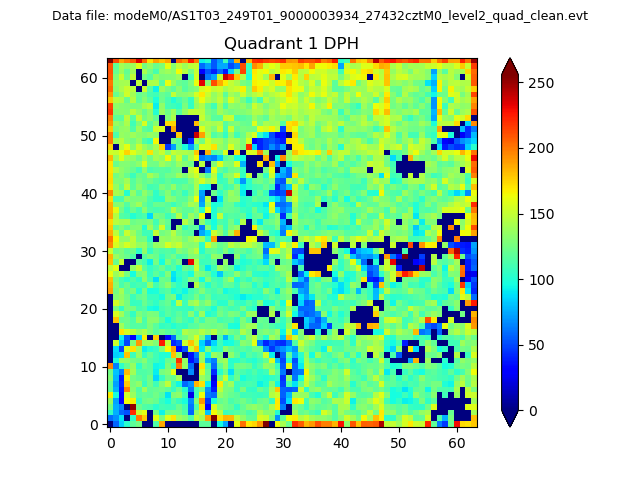
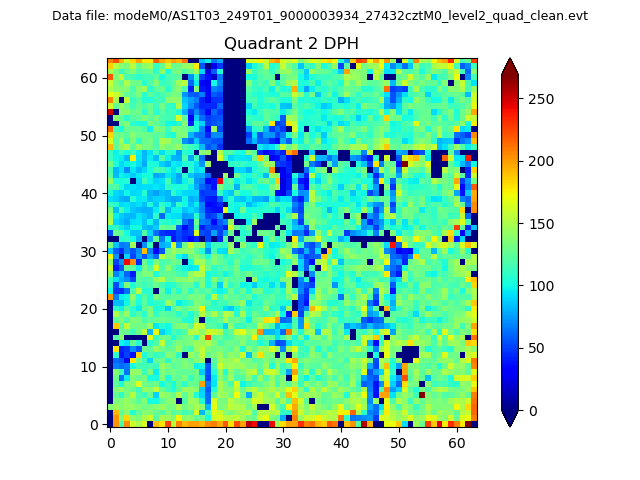
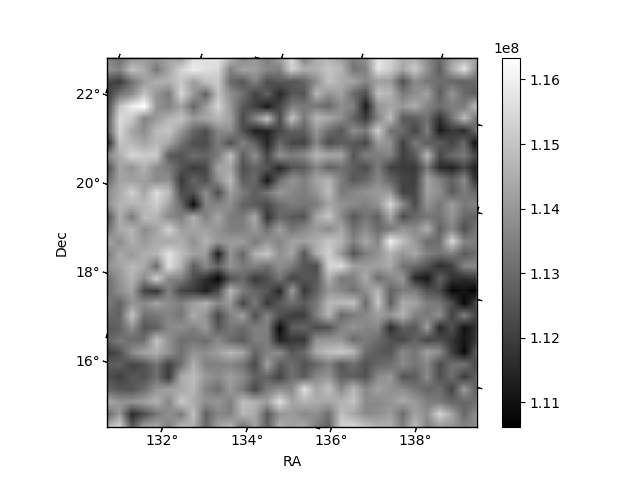
Histogram calculated using DETX and DETY for each event in the final _common_clean file
| Quadrant A |  |
 |
Quadrant B |
|---|---|---|---|
| Quadrant D | 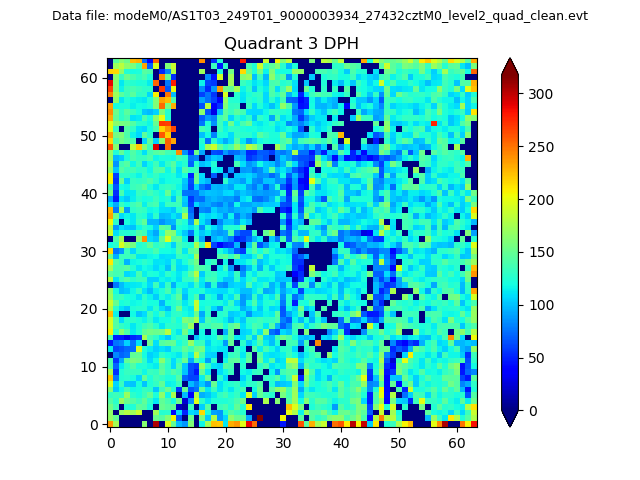 |
 |
Quadrant C |
| Plot type | Count rate plots | Images |
|---|---|---|
| Comparison with Poisson distribution Blue bars denote a histogram of data divided into 1 sec bins. Red curve is a Poisson curve with rate = median count rate of data. |
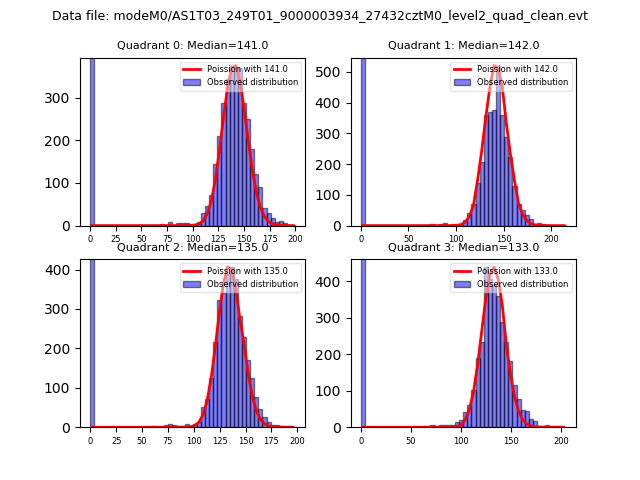 |
 |
| Quadrant-wise count rates Data is divided into 100 sec bins |
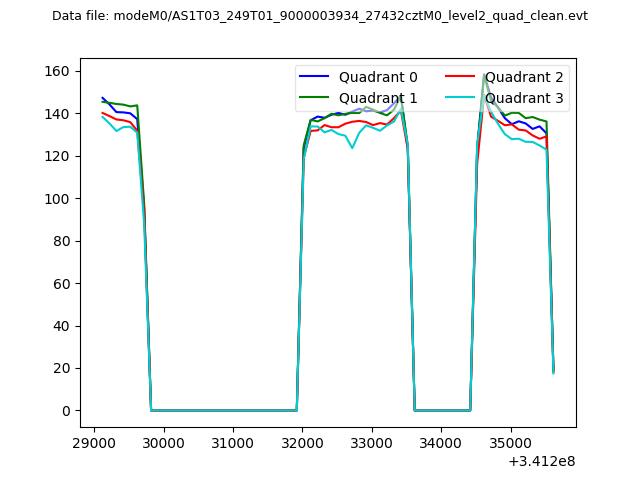 |
|
| Module-wise count rates for Quadrant A Data is divided into 100 sec bins |
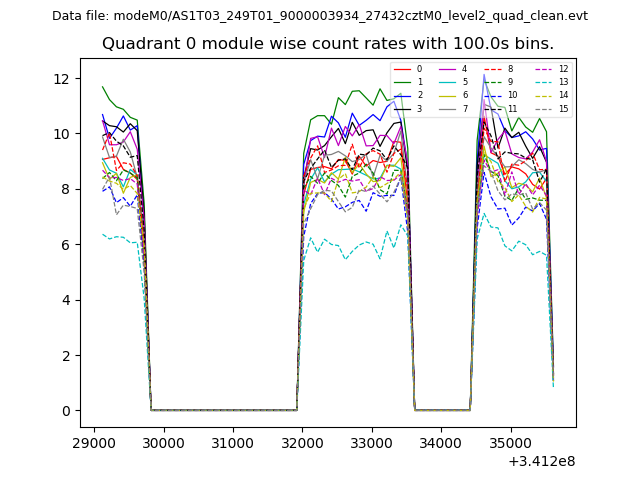 |
 |
| Module-wise count rates for Quadrant B Data is divided into 100 sec bins |
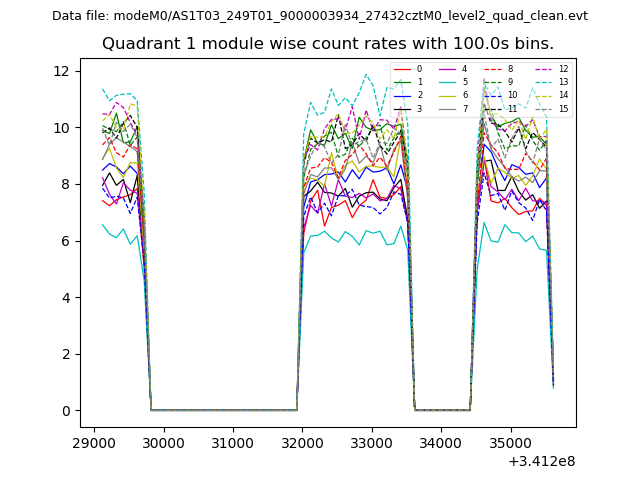 |
 |
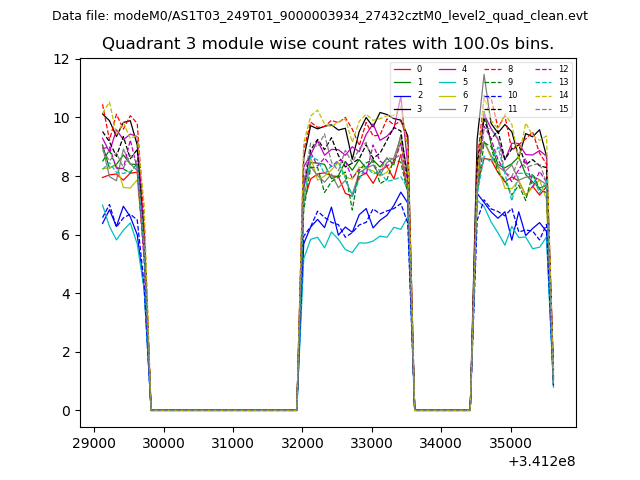
| Module-wise count rates for Quadrant C Data is divided into 100 sec bins |
 |
 |
| Module-wise count rates for Quadrant D Data is divided into 100 sec bins |
 |
 |
| Parameter | Plot |
|---|---|
| CZT HV Monitor | 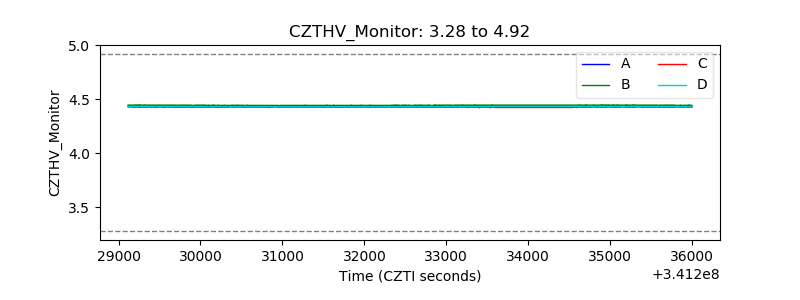 |
| D_VDD | 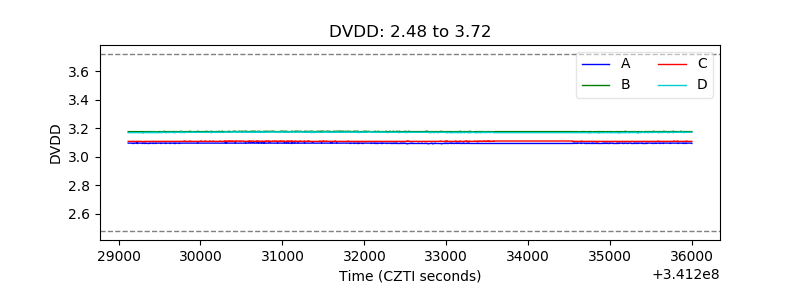 |
| Temperature 1 | 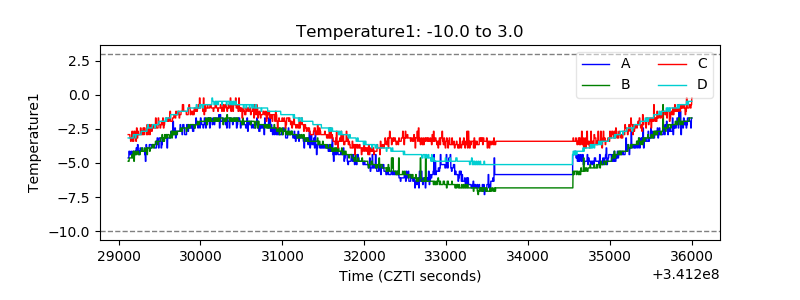 |
| Veto HV Monitor |  |
| Veto LLD | 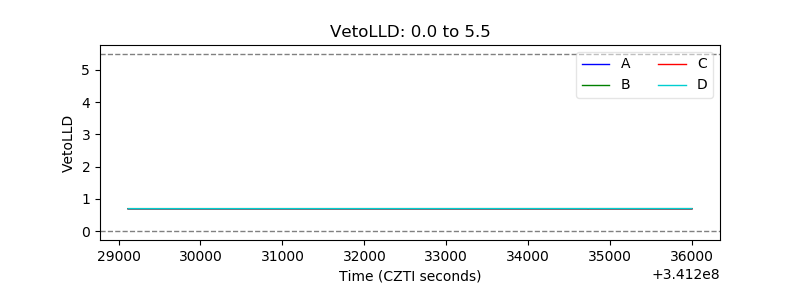 |
| Alpha Counter | 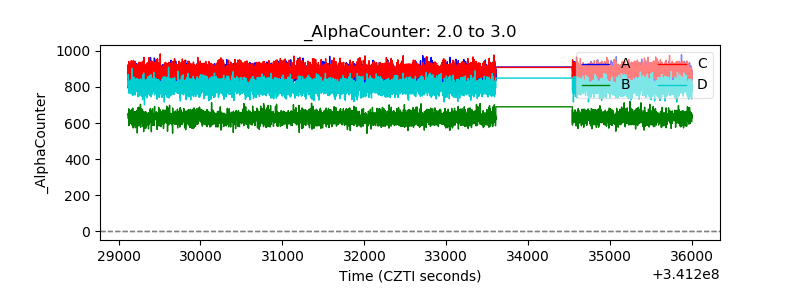 |
| _CPM_Rate | 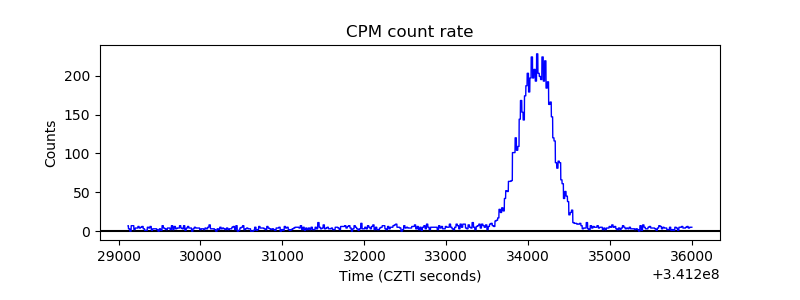 |
| CZT Counter | 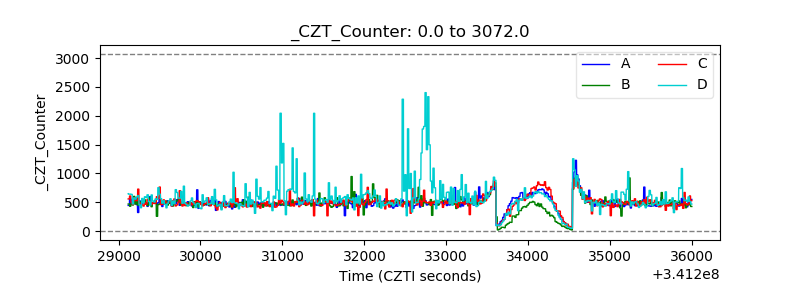 |
| +2.5 Volts monitor | 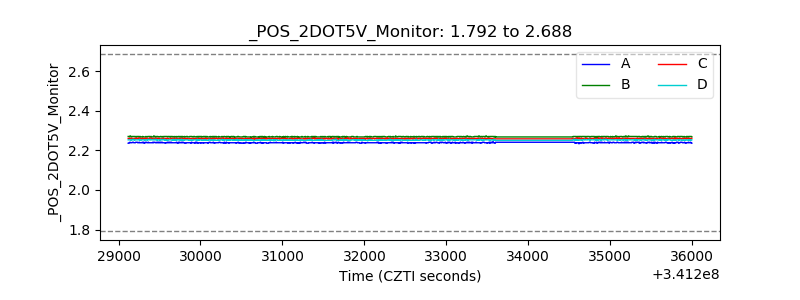 |
| +5 Volts monitor |  |
| _ROLL_ROT | 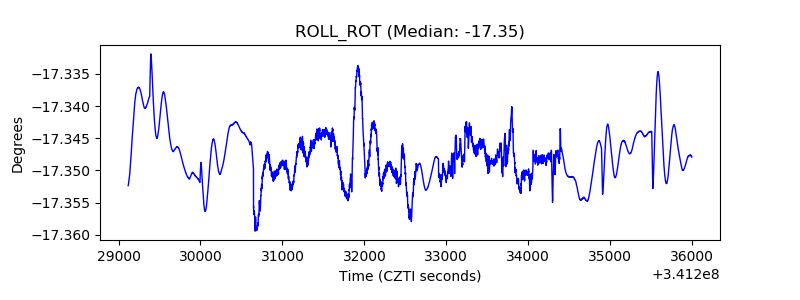 |
| _Roll_DEC | 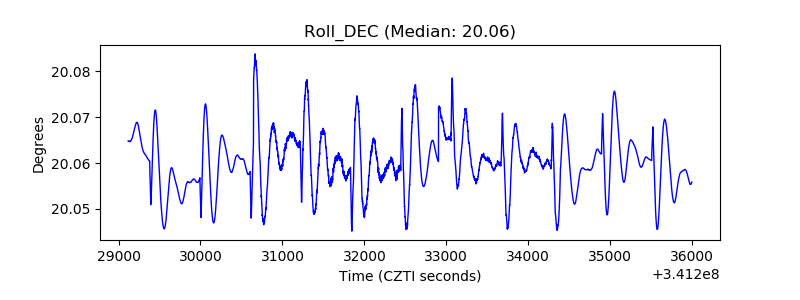 |
| _Roll_RA |  |
| Veto Counter | 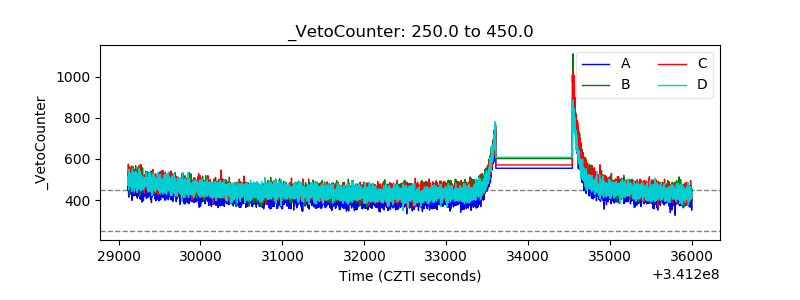 |