| Param | Original file | Final file |
|---|---|---|
| Filename | modeM0/AS1T03_249T01_9000003934_27433cztM0_level2.evt | modeM0/AS1T03_249T01_9000003934_27433cztM0_level2_quad_clean.evt |
| Size (bytes) | 504,843,840 | 84,026,880 |
| Size | 481.5 MB | 80.1 MB |
| Events in quadrant A | 3,355,271 | 529,462 |
| Events in quadrant B | 3,434,401 | 529,152 |
| Events in quadrant C | 3,421,302 | 506,039 |
| Events in quadrant D | 4,607,728 | 496,711 |
| Mode M0 | |||
|---|---|---|---|
| Quadrant | BADHDUFLAG | Total packets | Discarded packets |
| A | 0 | 14142 | 0 |
| B | 0 | 14320 | 0 |
| C | 0 | 14335 | 0 |
| D | 0 | 18178 | 0 |
| Mode M9 | |||
|---|---|---|---|
| Quadrant | BADHDUFLAG | Total packets | Discarded packets |
| A | 0 | 6 | 0 |
| B | 0 | 6 | 0 |
| C | 0 | 6 | 0 |
| D | 0 | 6 | 0 |
| Quadrant | Total seconds | Saturated seconds | Saturation percentage |
|---|---|---|---|
| A | 6929 | 60 | 0.865926% |
| B | 6930 | 73 | 1.053391% |
| C | 6930 | 101 | 1.457431% |
| D | 6930 | 140 | 2.020202% |
Noise dominated data is calculated using 1-second bins in cleaned event files. If a bin has >2000 counts, and if more than 50% of those come from <1% of pixels, then it is considered to be noise-dominated and hence unusable.
| Quadrant | # 1 sec bins | Bins with >0 counts | Bins with >2000 counts | High rate bins dominated by noise | Noise dominated (total time) | Noise dominated (detector-on time) | Marked lightcurve |
|---|---|---|---|---|---|---|---|
| A | 7569 | 6929 | 0 | 0 | 0.00% | 0.00% |  |
| B | 7570 | 6930 | 2 | 2 | 0.03% | 0.03% |  |
| C | 7570 | 6931 | 5 | 5 | 0.07% | 0.07% |  |
| D | 7570 | 6931 | 93 | 93 | 1.23% | 1.34% |  |
Top three noisy pixels from each quadrant. If the there are fewer than three noisy pixels in the level2.evt file, extra rows are filled as -1
| Pixel properties | Quadrant properties | ||||||
|---|---|---|---|---|---|---|---|
| Quadrant | DetID | PixID | Counts | Sigma | Mean | Median | Sigma |
| A | 13 | 254 | 11172 | 58.77 | 869 | 851 | 175.6 |
| A | 3 | 137 | 8274 | 42.27 | 869 | 851 | 175.6 |
| A | 0 | 226 | 7439 | 37.51 | 869 | 851 | 175.6 |
| B | 0 | 190 | 24504 | 144.89 | 853 | 830 | 163.4 |
| B | 12 | 111 | 20178 | 118.41 | 853 | 830 | 163.4 |
| B | 0 | 189 | 19118 | 111.92 | 853 | 830 | 163.4 |
| C | 14 | 238 | 133213 | 683.55 | 824 | 829 | 193.7 |
| C | 10 | 22 | 65525 | 334.05 | 824 | 829 | 193.7 |
| C | 2 | 16 | 5770 | 25.51 | 824 | 829 | 193.7 |
| D | 1 | 52 | 1083488 | 5462.79 | 833 | 811 | 198.2 |
| D | 2 | 250 | 215821 | 1084.86 | 833 | 811 | 198.2 |
| D | 10 | 50 | 129594 | 649.79 | 833 | 811 | 198.2 |
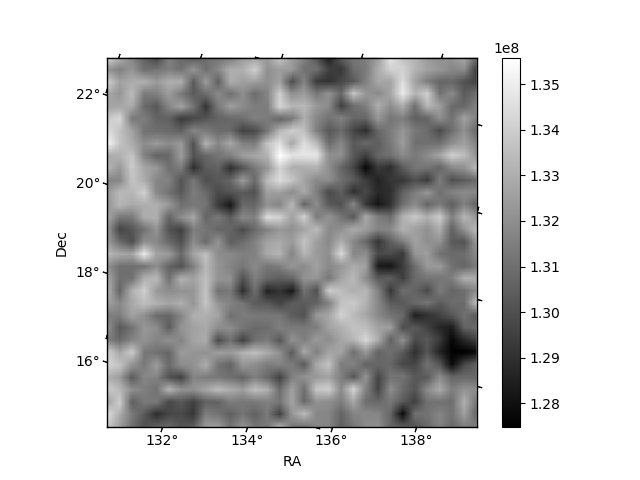
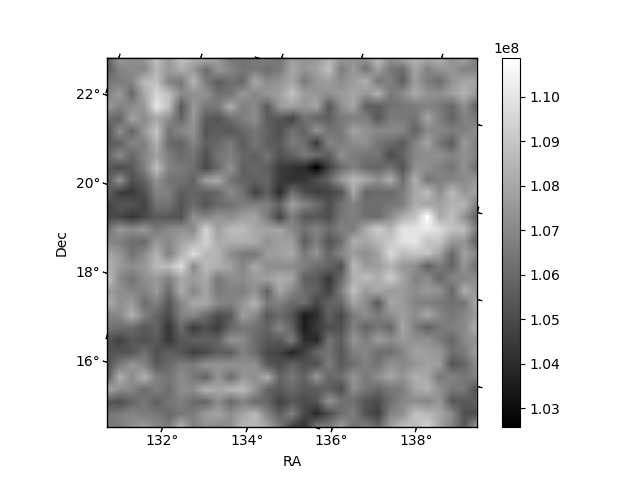
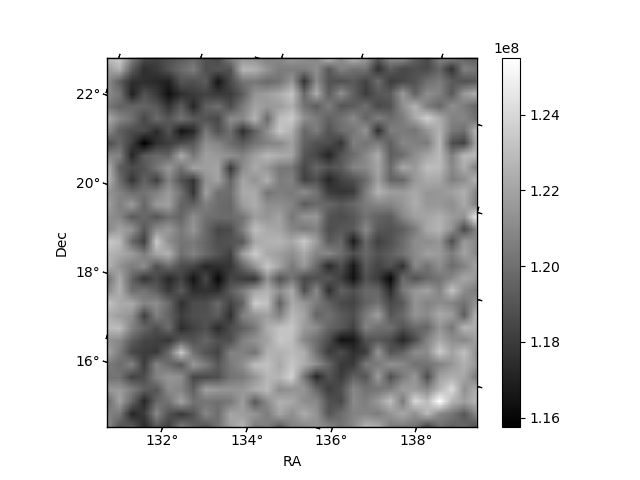
Histogram calculated using DETX and DETY for each event in the final _common_clean file
| Quadrant A | 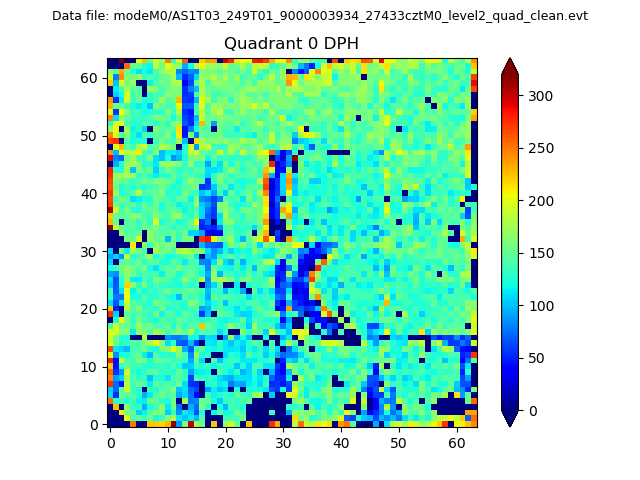 |
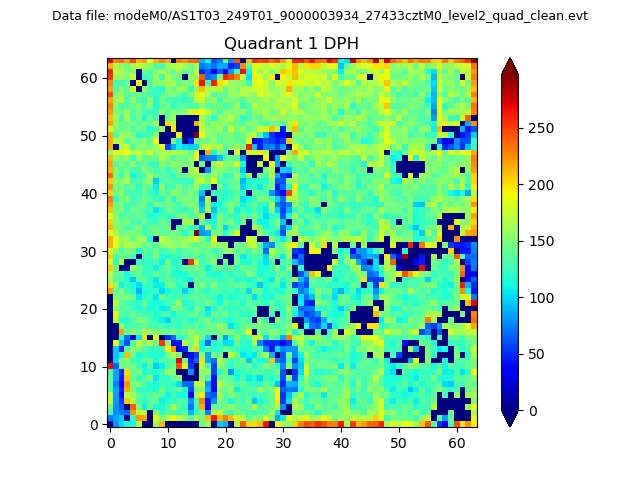 |
Quadrant B |
|---|---|---|---|
| Quadrant D | 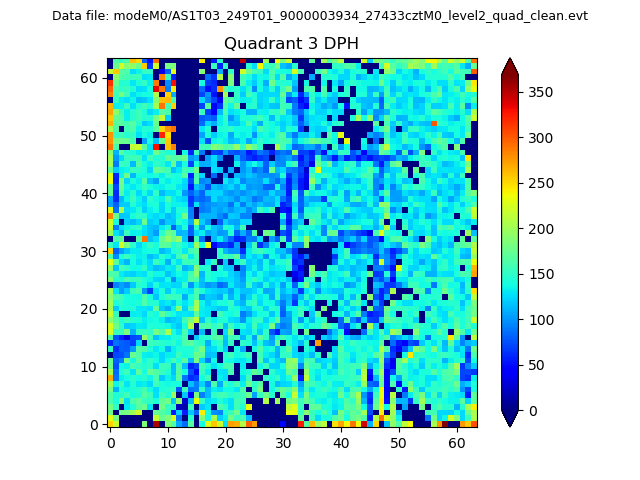 |
 |
Quadrant C |
| Plot type | Count rate plots | Images |
|---|---|---|
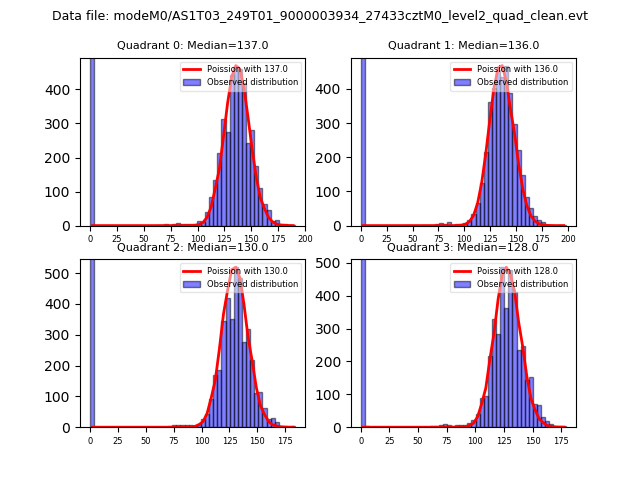
| Comparison with Poisson distribution Blue bars denote a histogram of data divided into 1 sec bins. Red curve is a Poisson curve with rate = median count rate of data. |
 |
 |
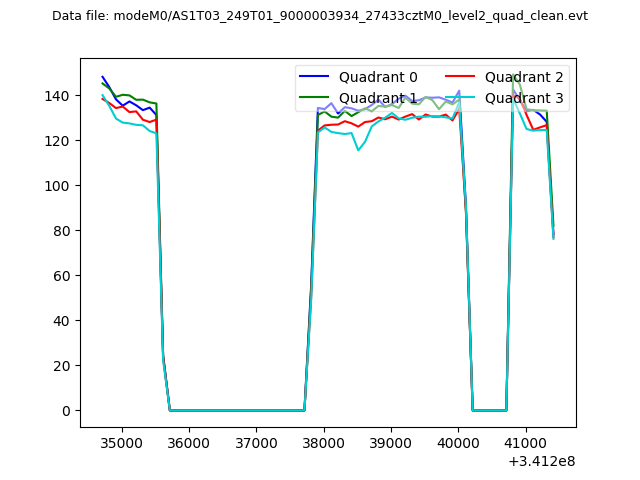
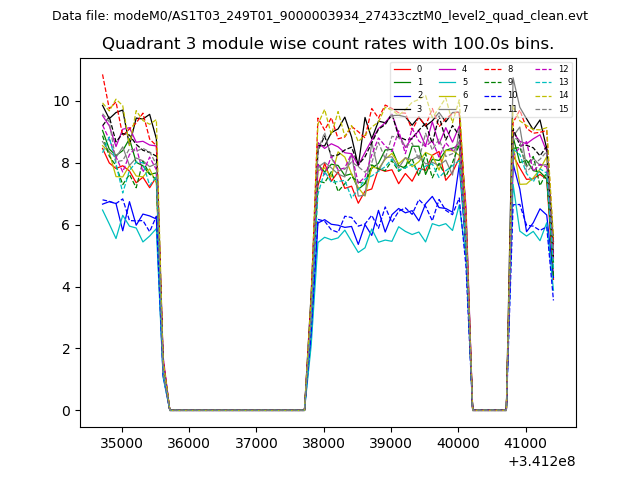
| Quadrant-wise count rates Data is divided into 100 sec bins |
 |
|
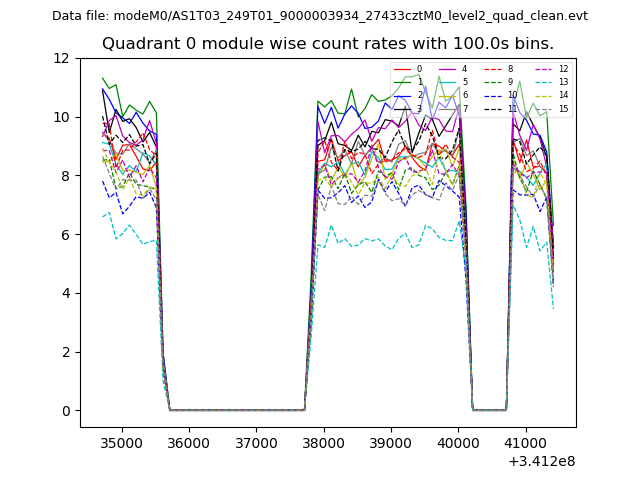
| Module-wise count rates for Quadrant A Data is divided into 100 sec bins |
 |
 |
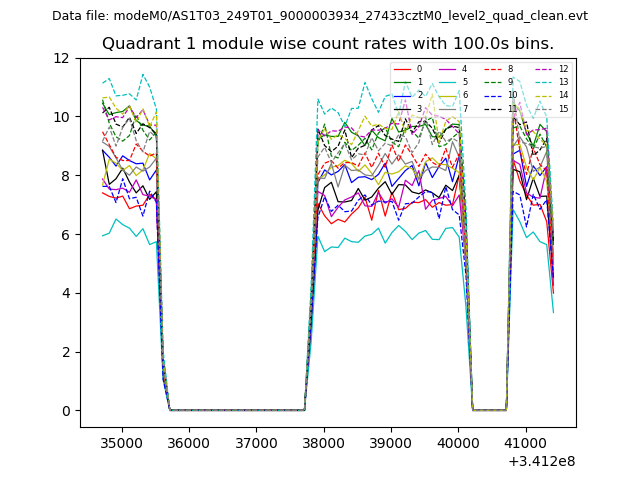
| Module-wise count rates for Quadrant B Data is divided into 100 sec bins |
 |
 |
| Module-wise count rates for Quadrant C Data is divided into 100 sec bins |
 |
 |
| Module-wise count rates for Quadrant D Data is divided into 100 sec bins |
 |
 |
| Parameter | Plot |
|---|---|
| CZT HV Monitor | 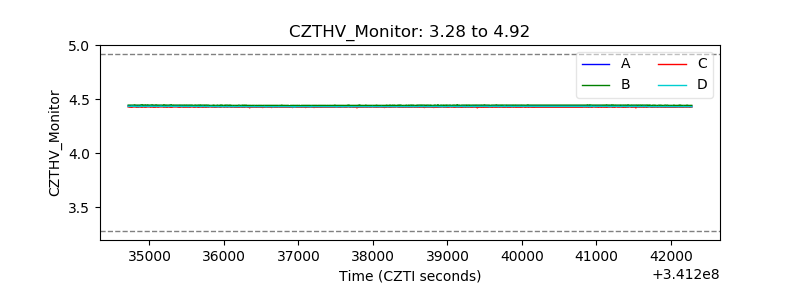 |
| D_VDD | 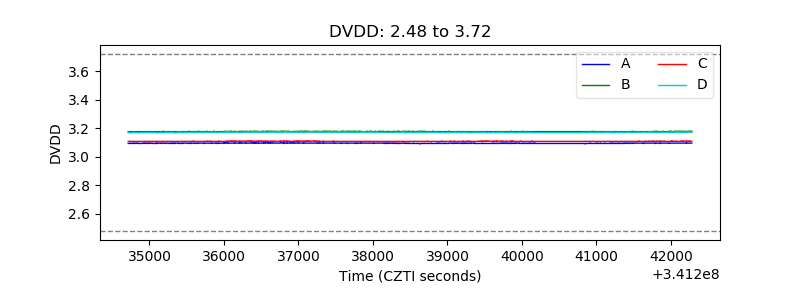 |
| Temperature 1 | 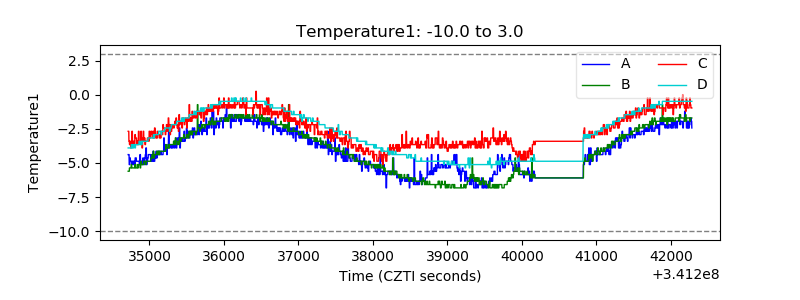 |
| Veto HV Monitor | 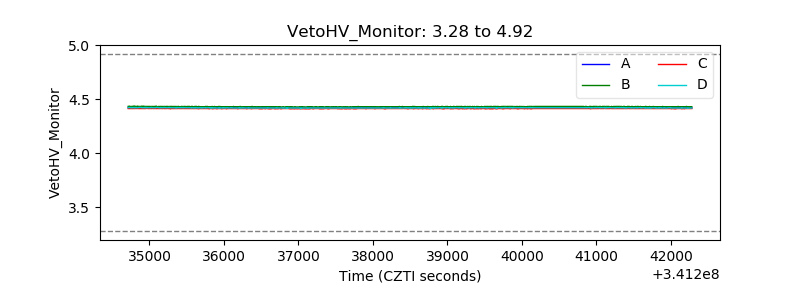 |
| Veto LLD | 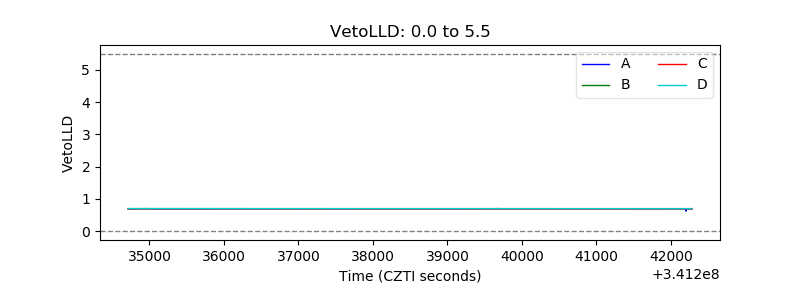 |
| Alpha Counter |  |
| _CPM_Rate | 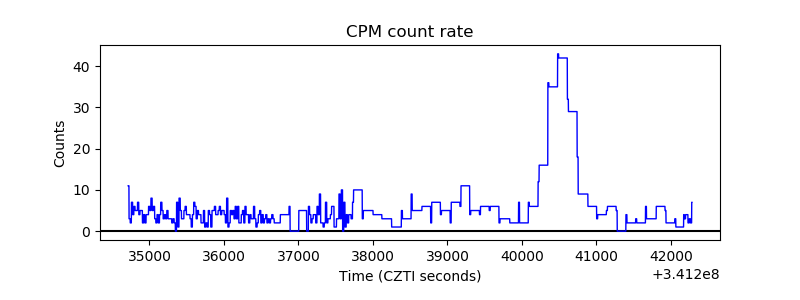 |
| CZT Counter |  |
| +2.5 Volts monitor |  |
| +5 Volts monitor |  |
| _ROLL_ROT | 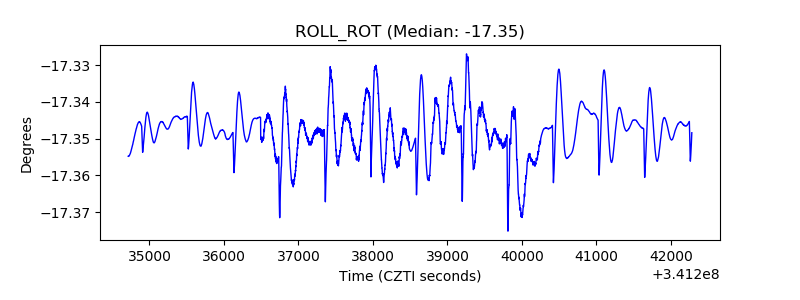 |
| _Roll_DEC | 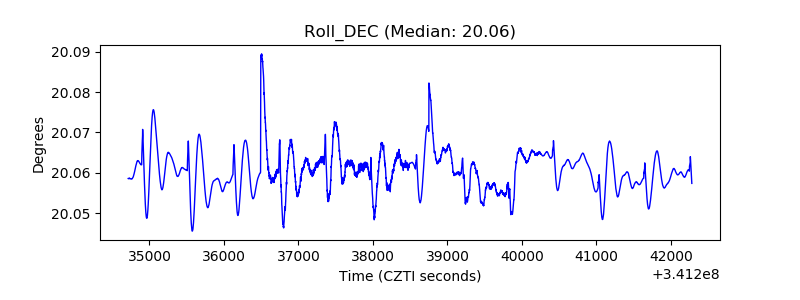 |
| _Roll_RA |  |
| Veto Counter | 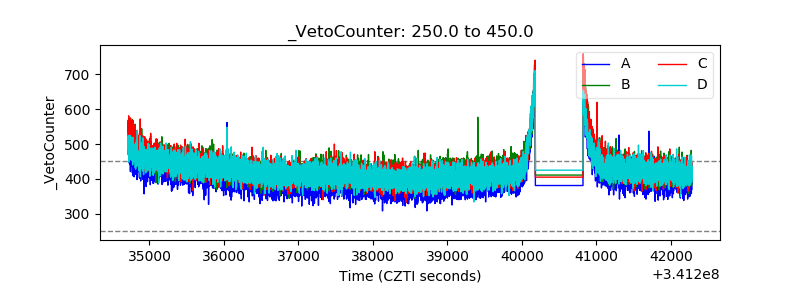 |