| Param | Original file | Final file |
|---|---|---|
| Filename | modeM0/AS1T03_249T01_9000003934_27435cztM0_level2.evt | modeM0/AS1T03_249T01_9000003934_27435cztM0_level2_quad_clean.evt |
| Size (bytes) | 592,657,920 | 84,072,960 |
| Size | 565.2 MB | 80.2 MB |
| Events in quadrant A | 3,871,953 | 513,093 |
| Events in quadrant B | 4,185,308 | 511,220 |
| Events in quadrant C | 3,912,373 | 489,391 |
| Events in quadrant D | 5,447,226 | 486,878 |
| Mode M0 | |||
|---|---|---|---|
| Quadrant | BADHDUFLAG | Total packets | Discarded packets |
| A | 0 | 16444 | 0 |
| B | 0 | 17260 | 0 |
| C | 0 | 16533 | 0 |
| D | 0 | 21623 | 0 |
| Mode M9 | |||
|---|---|---|---|
| Quadrant | BADHDUFLAG | Total packets | Discarded packets |
| A | 0 | 7 | 0 |
| B | 0 | 7 | 0 |
| C | 0 | 7 | 0 |
| D | 0 | 7 | 0 |
| Quadrant | Total seconds | Saturated seconds | Saturation percentage |
|---|---|---|---|
| A | 7846 | 229 | 2.918685% |
| B | 7846 | 305 | 3.887331% |
| C | 7846 | 303 | 3.861840% |
| D | 7846 | 478 | 6.092276% |
Noise dominated data is calculated using 1-second bins in cleaned event files. If a bin has >2000 counts, and if more than 50% of those come from <1% of pixels, then it is considered to be noise-dominated and hence unusable.
| Quadrant | # 1 sec bins | Bins with >0 counts | Bins with >2000 counts | High rate bins dominated by noise | Noise dominated (total time) | Noise dominated (detector-on time) | Marked lightcurve |
|---|---|---|---|---|---|---|---|
| A | 8401 | 7848 | 0 | 0 | 0.00% | 0.00% |  |
| B | 8401 | 7847 | 17 | 17 | 0.20% | 0.22% |  |
| C | 8401 | 7847 | 1 | 1 | 0.01% | 0.01% |  |
| D | 8401 | 7848 | 195 | 195 | 2.32% | 2.48% |  |
Top three noisy pixels from each quadrant. If the there are fewer than three noisy pixels in the level2.evt file, extra rows are filled as -1
| Pixel properties | Quadrant properties | ||||||
|---|---|---|---|---|---|---|---|
| Quadrant | DetID | PixID | Counts | Sigma | Mean | Median | Sigma |
| A | 13 | 254 | 12807 | 57.89 | 1003 | 978 | 204.3 |
| A | 3 | 137 | 9906 | 43.69 | 1003 | 978 | 204.3 |
| A | 0 | 226 | 8375 | 36.2 | 1003 | 978 | 204.3 |
| B | 0 | 189 | 167913 | 871.32 | 985 | 959 | 191.6 |
| B | 0 | 190 | 36440 | 185.17 | 985 | 959 | 191.6 |
| B | 15 | 32 | 30747 | 155.46 | 985 | 959 | 191.6 |
| C | 14 | 238 | 150164 | 655.28 | 954 | 958 | 227.7 |
| C | 10 | 22 | 20260 | 84.77 | 954 | 958 | 227.7 |
| C | 7 | 221 | 14625 | 60.02 | 954 | 958 | 227.7 |
| D | 1 | 52 | 1480729 | 6374.79 | 964 | 938 | 232.1 |
| D | 2 | 250 | 196843 | 843.94 | 964 | 938 | 232.1 |
| D | 12 | 227 | 79609 | 338.91 | 964 | 938 | 232.1 |
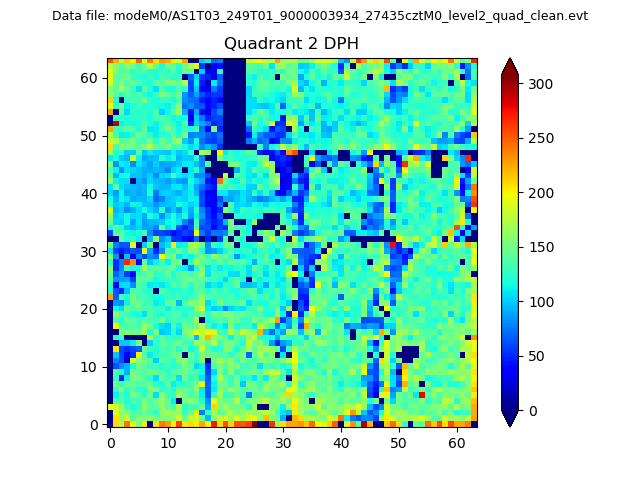
Histogram calculated using DETX and DETY for each event in the final _common_clean file
| Quadrant A | 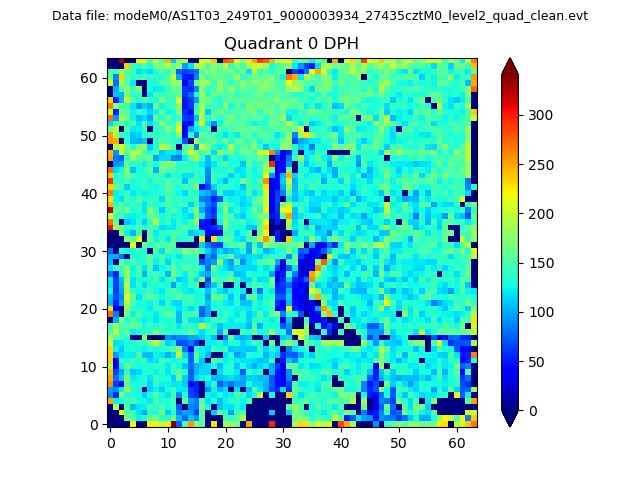 |
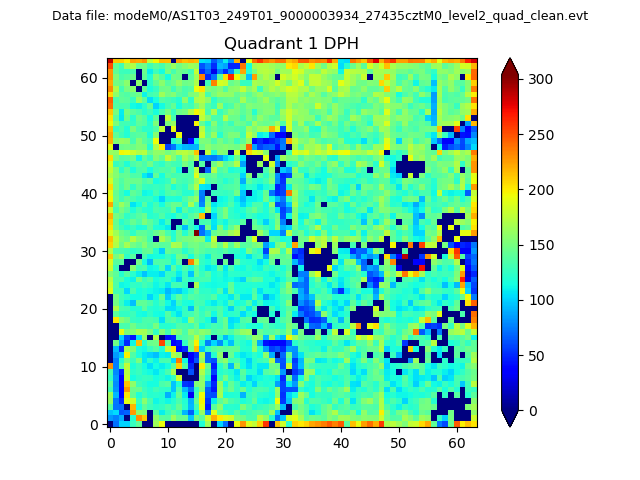 |
Quadrant B |
|---|---|---|---|
| Quadrant D | 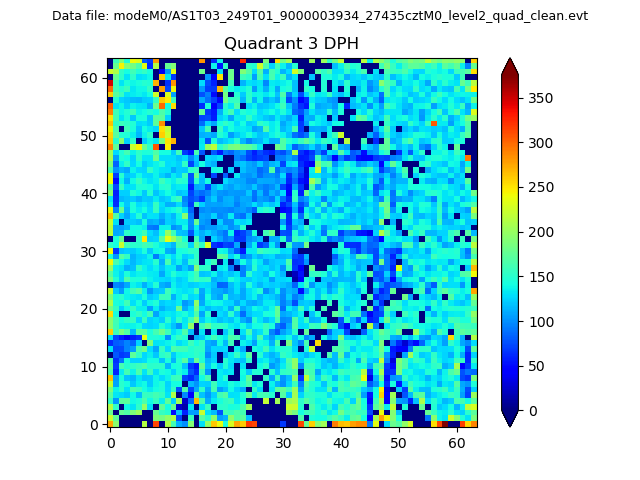 |
 |
Quadrant C |
| Plot type | Count rate plots | Images |
|---|---|---|
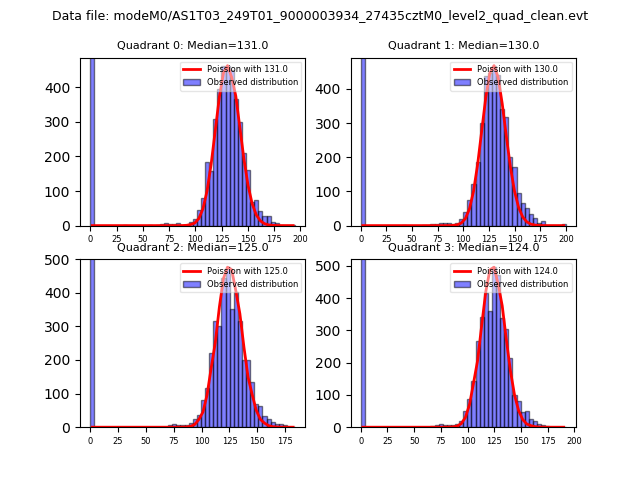
| Comparison with Poisson distribution Blue bars denote a histogram of data divided into 1 sec bins. Red curve is a Poisson curve with rate = median count rate of data. |
 |
 |
| Quadrant-wise count rates Data is divided into 100 sec bins |
 |
|
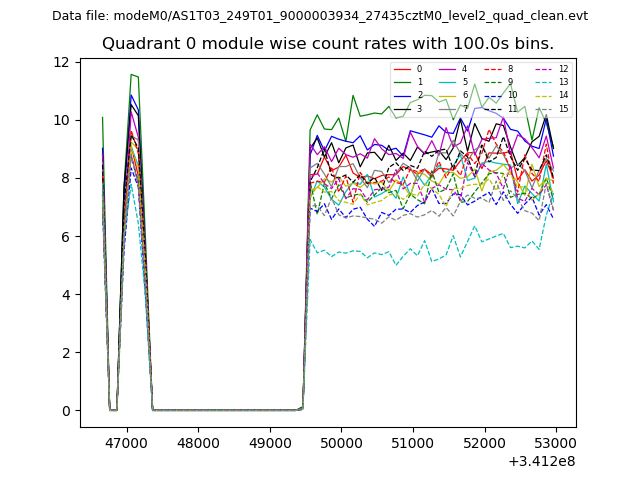
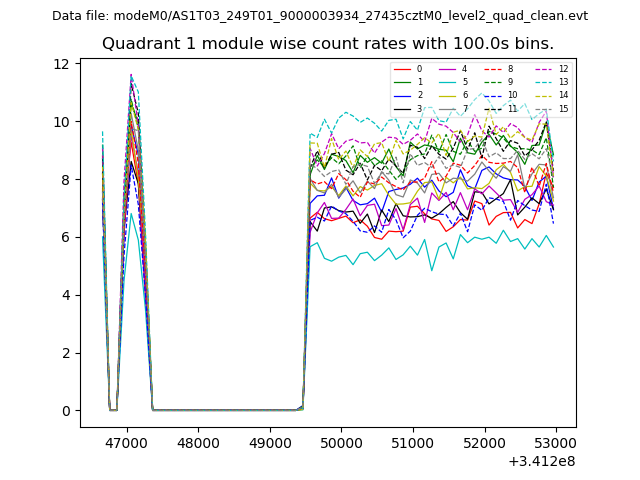
| Module-wise count rates for Quadrant A Data is divided into 100 sec bins |
 |
 |
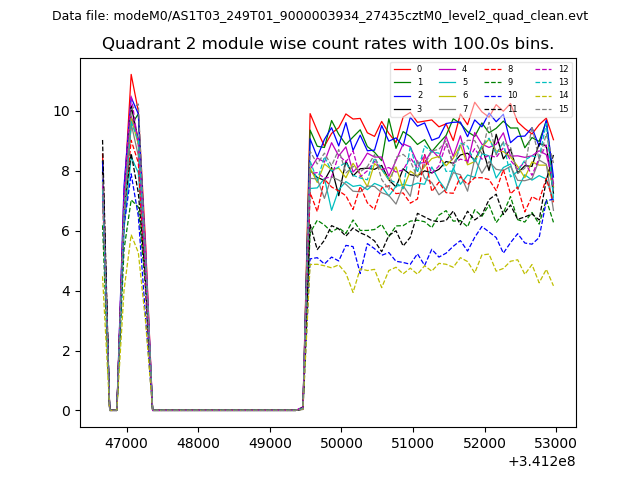
| Module-wise count rates for Quadrant B Data is divided into 100 sec bins |
 |
 |
| Module-wise count rates for Quadrant C Data is divided into 100 sec bins |
 |
 |
| Module-wise count rates for Quadrant D Data is divided into 100 sec bins |
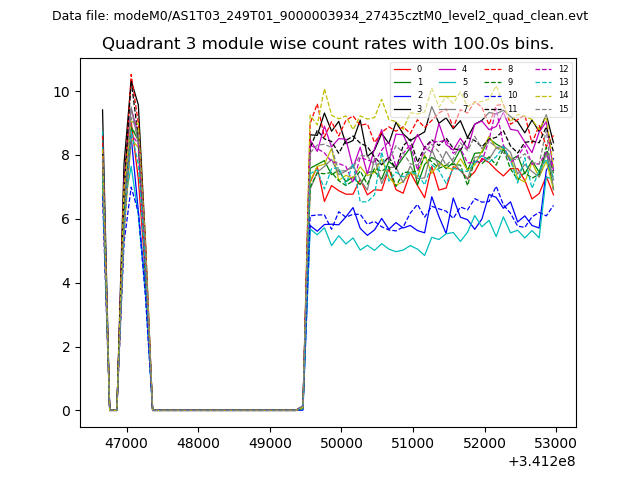 |
 |
| Parameter | Plot |
|---|---|
| CZT HV Monitor | 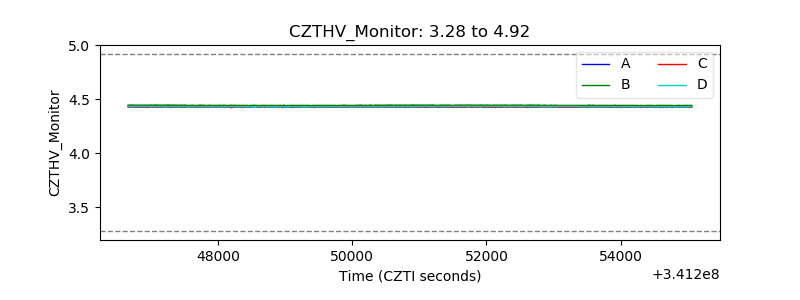 |
| D_VDD | 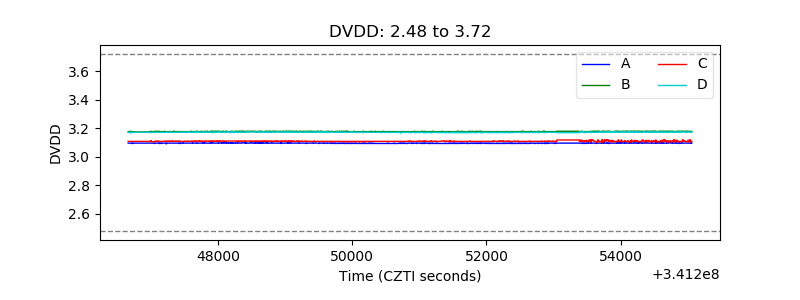 |
| Temperature 1 | 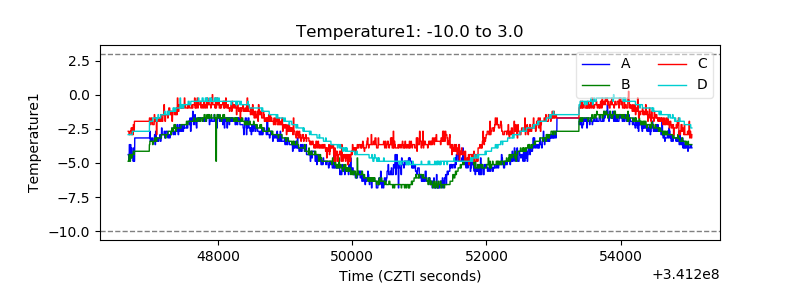 |
| Veto HV Monitor | 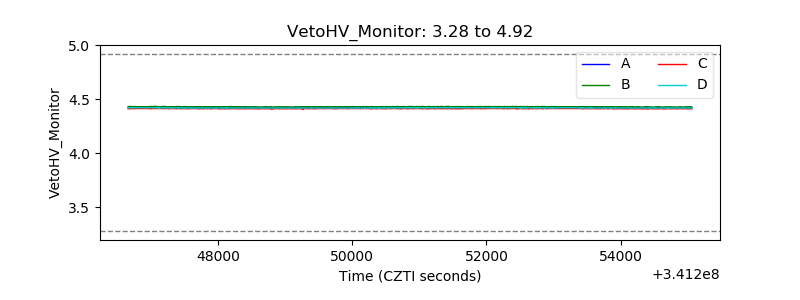 |
| Veto LLD |  |
| Alpha Counter | 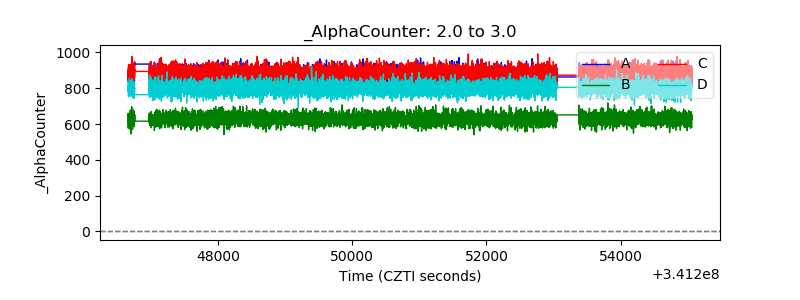 |
| _CPM_Rate | 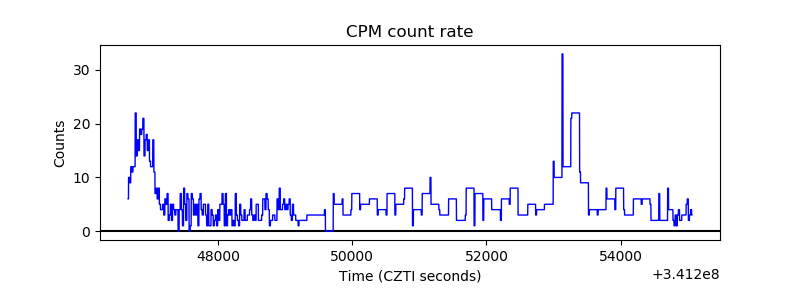 |
| CZT Counter | 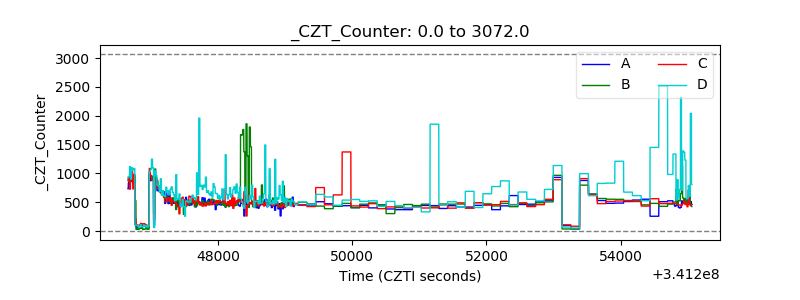 |
| +2.5 Volts monitor | 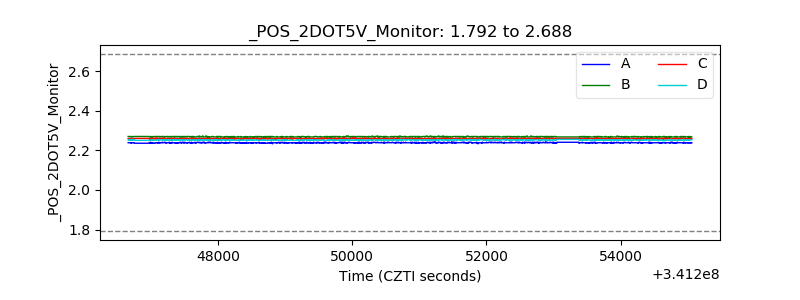 |
| +5 Volts monitor |  |
| _ROLL_ROT | 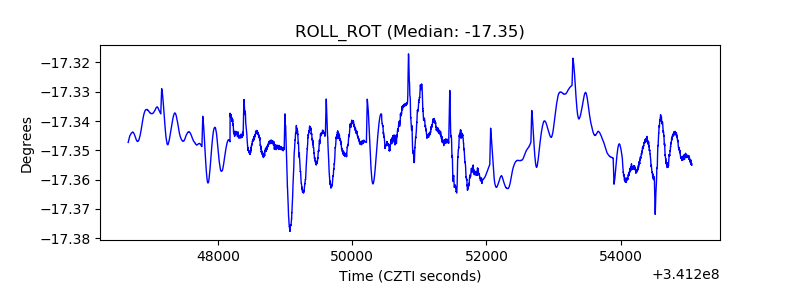 |
| _Roll_DEC | 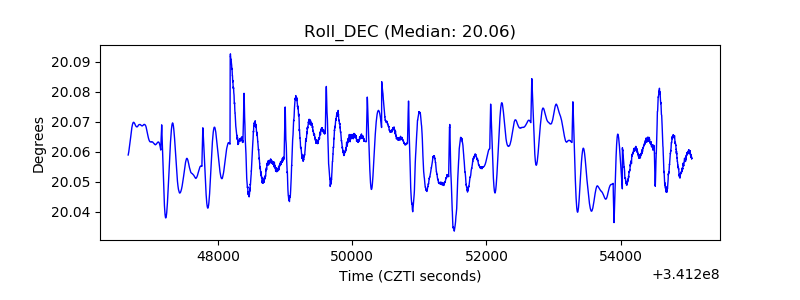 |
| _Roll_RA | 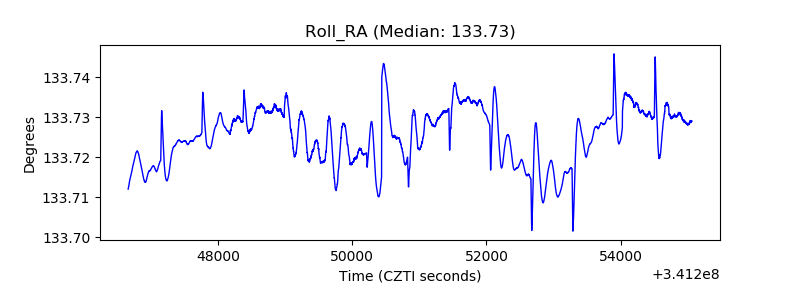 |
| Veto Counter | 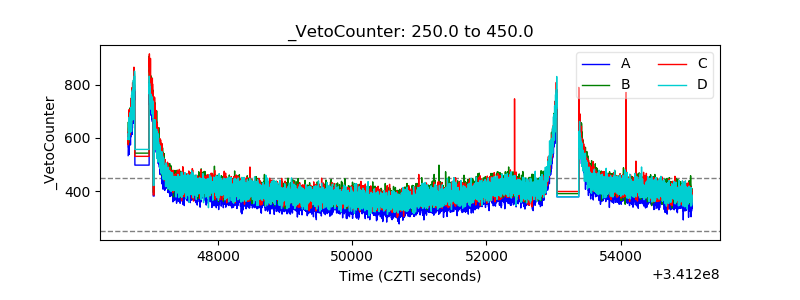 |