| Param | Original file | Final file |
|---|---|---|
| Filename | modeM0/AS1T03_249T01_9000003934_27438cztM0_level2.evt | modeM0/AS1T03_249T01_9000003934_27438cztM0_level2_quad_clean.evt |
| Size (bytes) | 257,656,320 | 23,135,040 |
| Size | 245.7 MB | 22.1 MB |
| Events in quadrant A | 1,493,376 | 125,303 |
| Events in quadrant B | 1,557,435 | 123,812 |
| Events in quadrant C | 1,506,654 | 119,077 |
| Events in quadrant D | 3,038,711 | 116,171 |
| Mode M0 | |||
|---|---|---|---|
| Quadrant | BADHDUFLAG | Total packets | Discarded packets |
| A | 0 | 6329 | 0 |
| B | 0 | 6473 | 0 |
| C | 0 | 6335 | 0 |
| D | 0 | 11188 | 0 |
| Mode M9 | |||
|---|---|---|---|
| Quadrant | BADHDUFLAG | Total packets | Discarded packets |
| A | 0 | 4 | 0 |
| B | 0 | 4 | 0 |
| C | 0 | 4 | 0 |
| D | 0 | 4 | 0 |
| Quadrant | Total seconds | Saturated seconds | Saturation percentage |
|---|---|---|---|
| A | 3025 | 62 | 2.049587% |
| B | 3025 | 84 | 2.776860% |
| C | 3026 | 105 | 3.469927% |
| D | 3026 | 377 | 12.458691% |
Noise dominated data is calculated using 1-second bins in cleaned event files. If a bin has >2000 counts, and if more than 50% of those come from <1% of pixels, then it is considered to be noise-dominated and hence unusable.
| Quadrant | # 1 sec bins | Bins with >0 counts | Bins with >2000 counts | High rate bins dominated by noise | Noise dominated (total time) | Noise dominated (detector-on time) | Marked lightcurve |
|---|---|---|---|---|---|---|---|
| A | 3350 | 3025 | 0 | 0 | 0.00% | 0.00% | 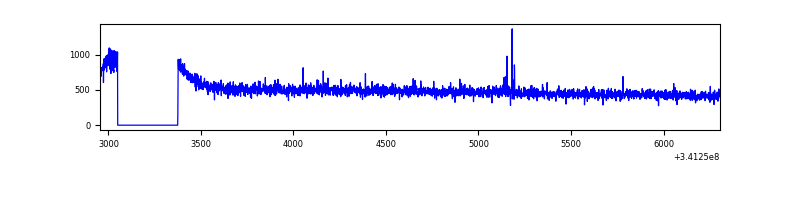 |
| B | 3350 | 3025 | 0 | 0 | 0.00% | 0.00% | 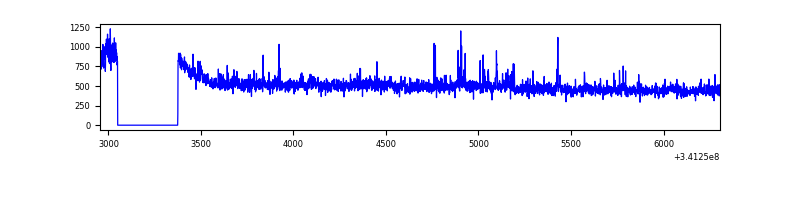 |
| C | 3351 | 3026 | 0 | 0 | 0.00% | 0.00% | 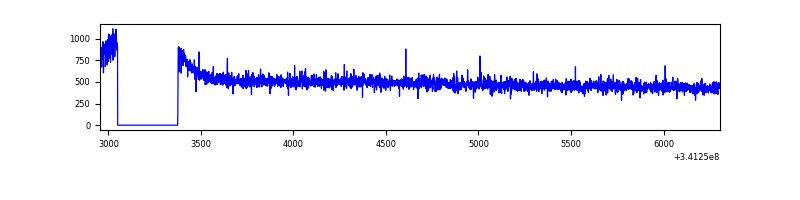 |
| D | 3351 | 3026 | 233 | 233 | 6.95% | 7.70% | 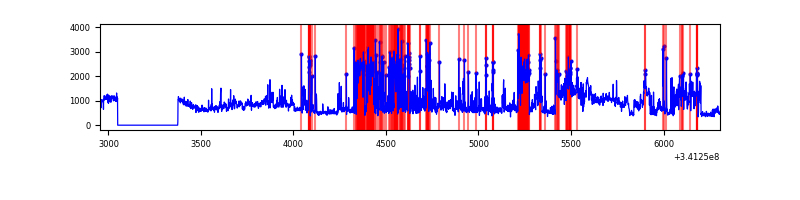 |
Top three noisy pixels from each quadrant. If the there are fewer than three noisy pixels in the level2.evt file, extra rows are filled as -1
| Pixel properties | Quadrant properties | ||||||
|---|---|---|---|---|---|---|---|
| Quadrant | DetID | PixID | Counts | Sigma | Mean | Median | Sigma |
| A | 13 | 254 | 5358 | 62.52 | 385 | 375 | 79.7 |
| A | 13 | 248 | 5157 | 60.0 | 385 | 375 | 79.7 |
| A | 3 | 137 | 3864 | 43.77 | 385 | 375 | 79.7 |
| B | 0 | 230 | 16195 | 210.48 | 380 | 371 | 75.2 |
| B | 15 | 32 | 12152 | 156.7 | 380 | 371 | 75.2 |
| B | 0 | 190 | 11504 | 148.08 | 380 | 371 | 75.2 |
| C | 14 | 238 | 58199 | 650.68 | 368 | 369 | 88.9 |
| C | 8 | 128 | 5118 | 53.43 | 368 | 369 | 88.9 |
| C | 7 | 221 | 3786 | 38.45 | 368 | 369 | 88.9 |
| D | 1 | 52 | 1455995 | 16413.69 | 361 | 351 | 88.7 |
| D | 12 | 227 | 117017 | 1315.51 | 361 | 351 | 88.7 |
| D | 2 | 250 | 87782 | 985.86 | 361 | 351 | 88.7 |
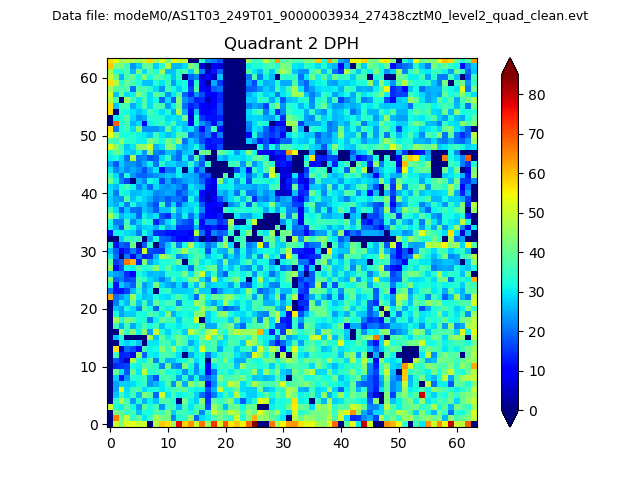
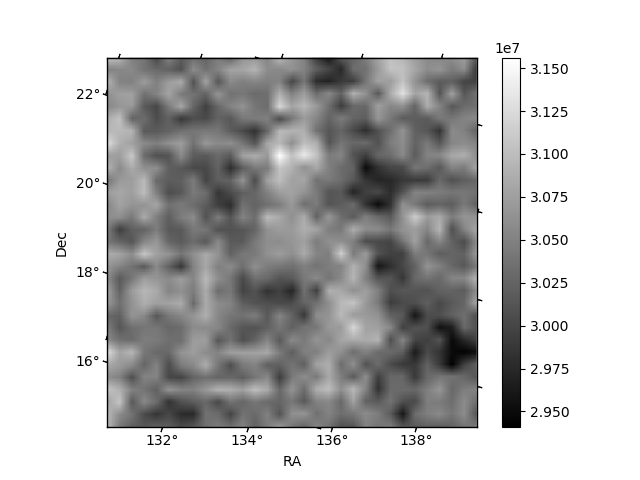
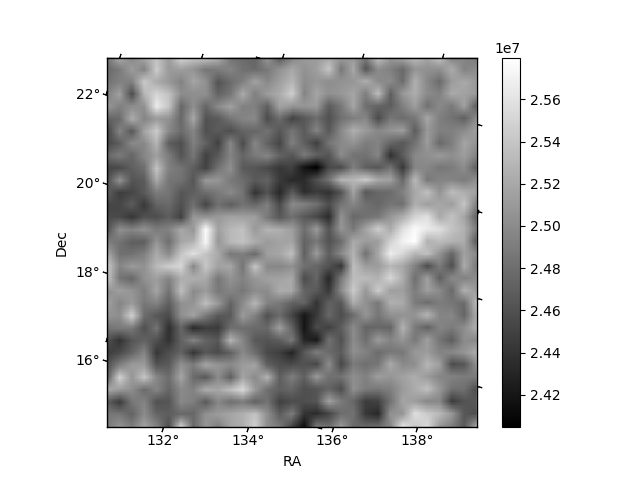
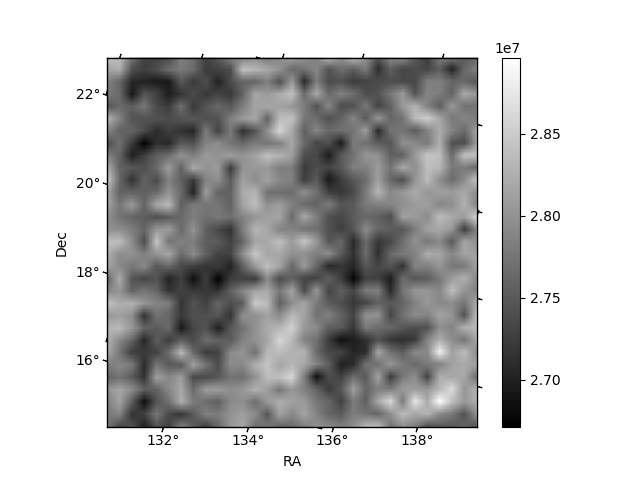
Histogram calculated using DETX and DETY for each event in the final _common_clean file
| Quadrant A | 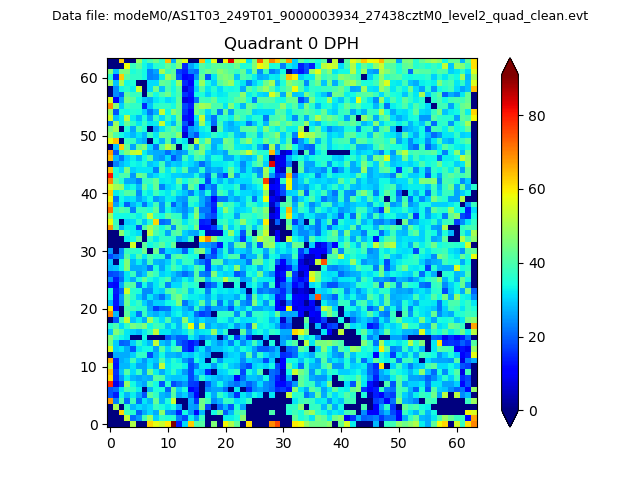 |
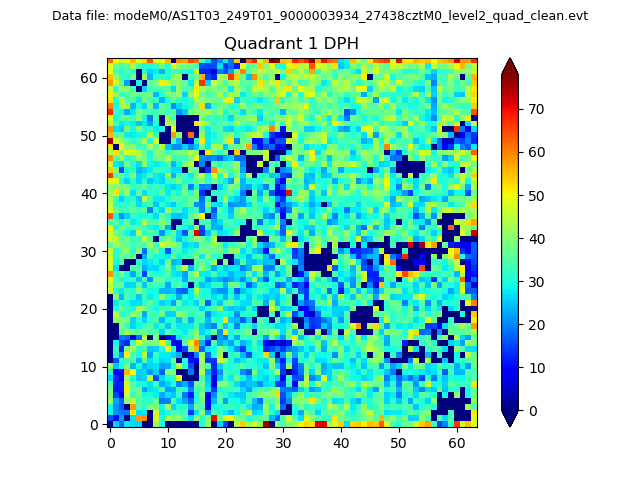 |
Quadrant B |
|---|---|---|---|
| Quadrant D | 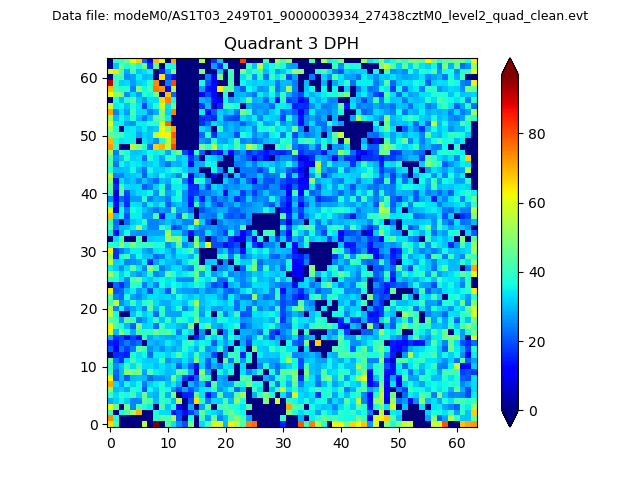 |
 |
Quadrant C |
| Plot type | Count rate plots | Images |
|---|---|---|
| Comparison with Poisson distribution Blue bars denote a histogram of data divided into 1 sec bins. Red curve is a Poisson curve with rate = median count rate of data. |
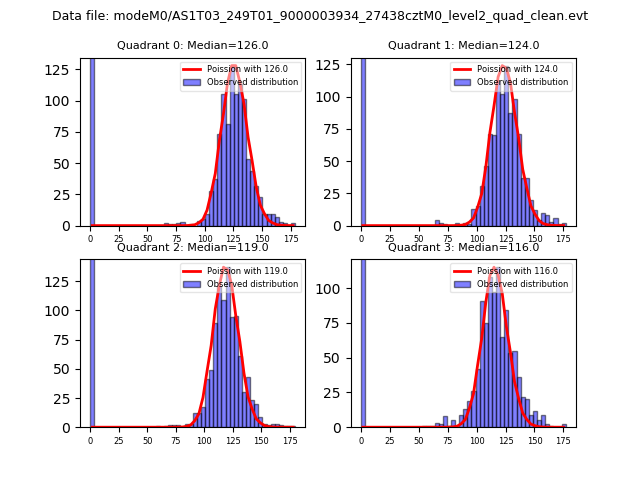 |
 |
| Quadrant-wise count rates Data is divided into 100 sec bins |
 |
|
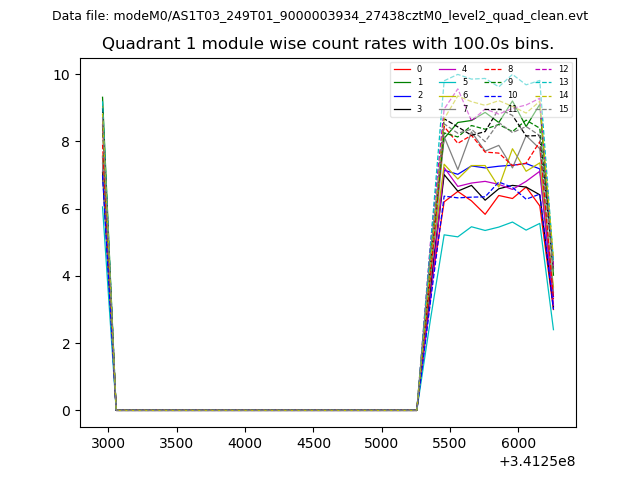
| Module-wise count rates for Quadrant A Data is divided into 100 sec bins |
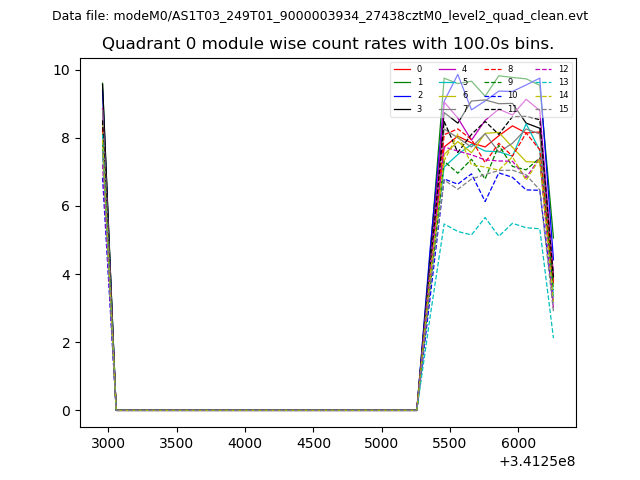 |
 |
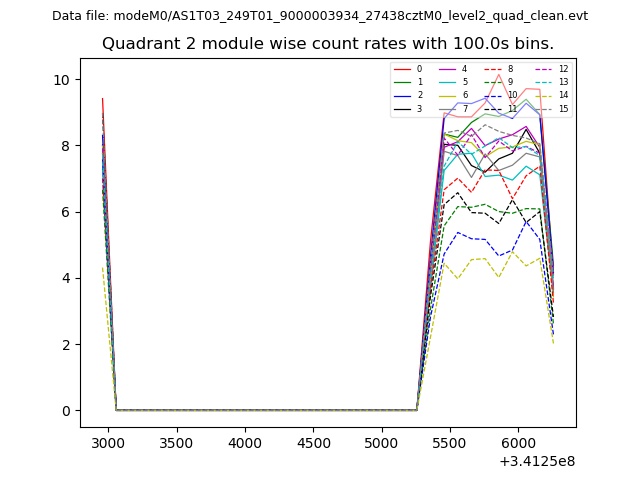
| Module-wise count rates for Quadrant B Data is divided into 100 sec bins |
 |
 |
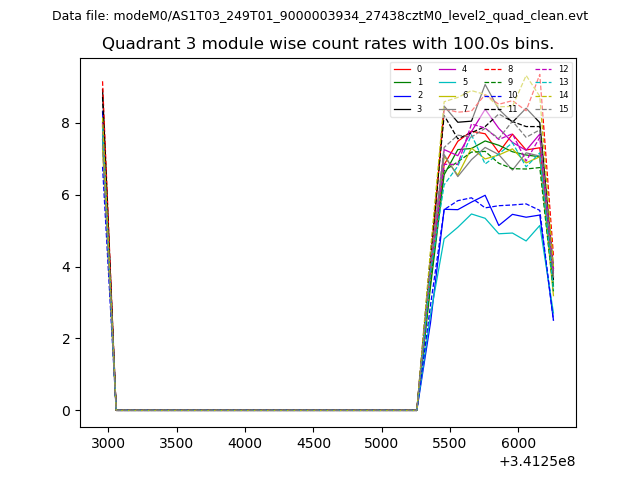
| Module-wise count rates for Quadrant C Data is divided into 100 sec bins |
 |
 |
| Module-wise count rates for Quadrant D Data is divided into 100 sec bins |
 |
 |
| Parameter | Plot |
|---|---|
| CZT HV Monitor | 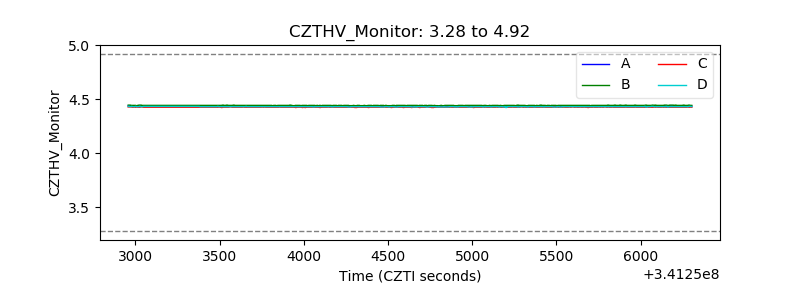 |
| D_VDD | 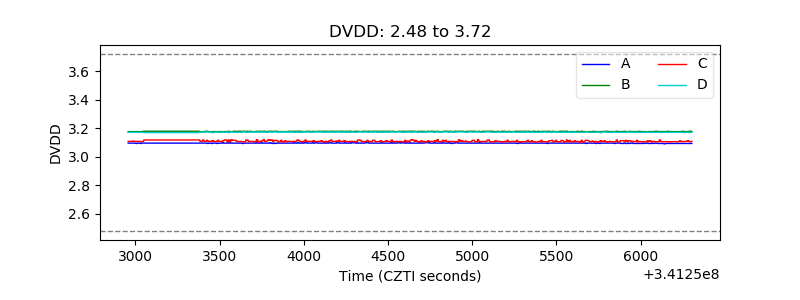 |
| Temperature 1 | 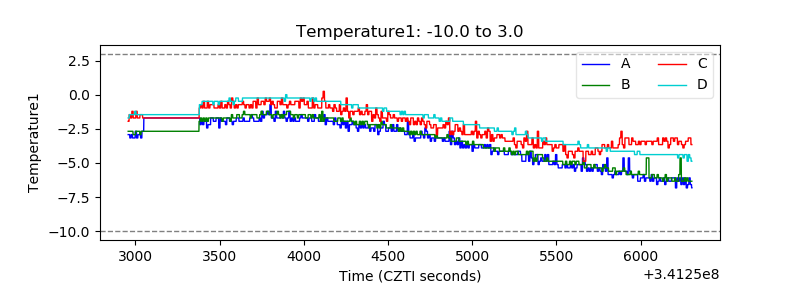 |
| Veto HV Monitor | 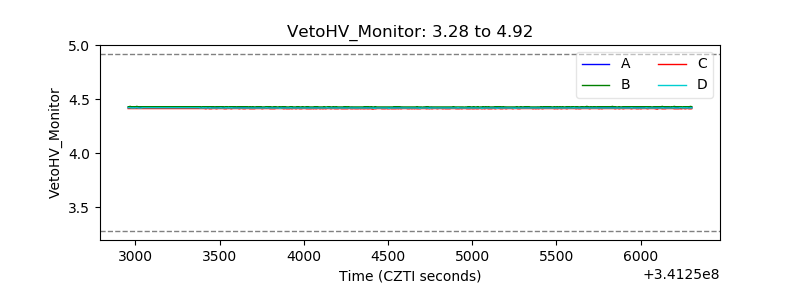 |
| Veto LLD | 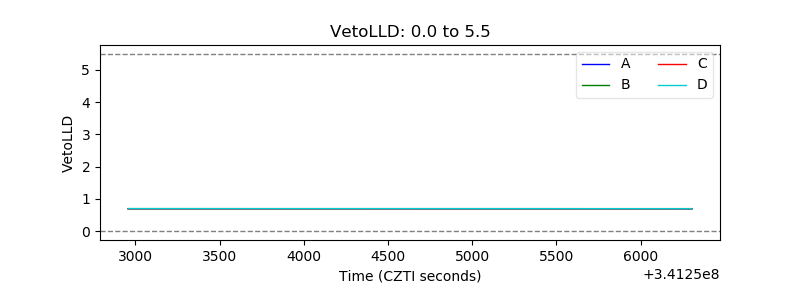 |
| Alpha Counter | 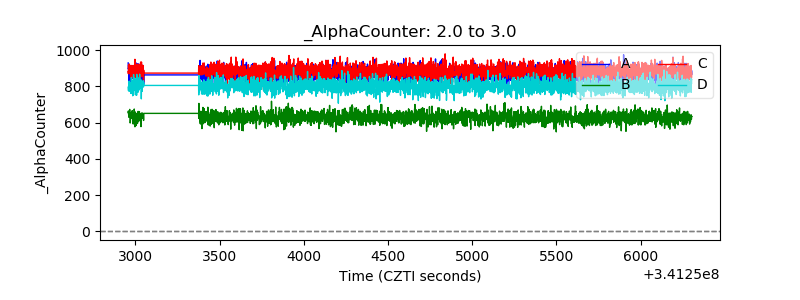 |
| _CPM_Rate | 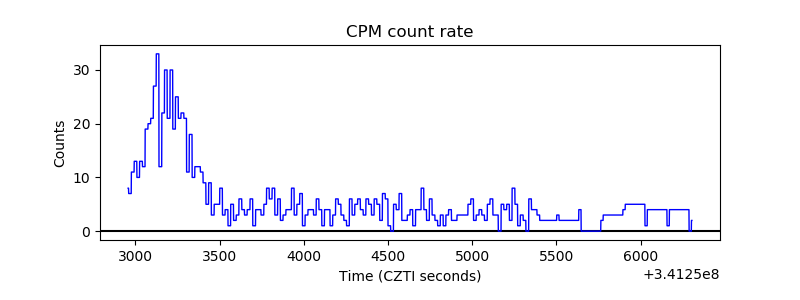 |
| CZT Counter |  |
| +2.5 Volts monitor |  |
| +5 Volts monitor | 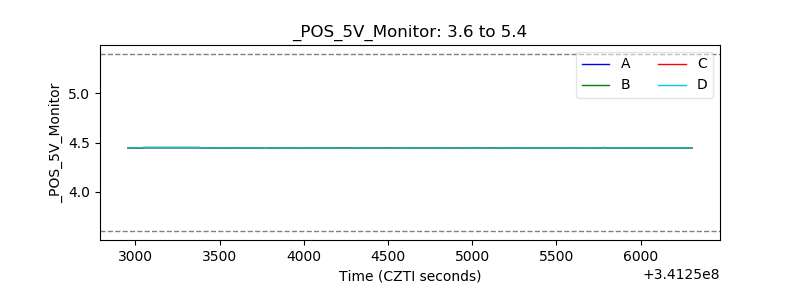 |
| _ROLL_ROT | 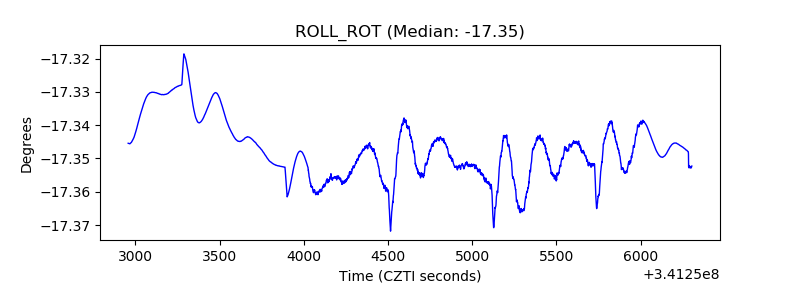 |
| _Roll_DEC | 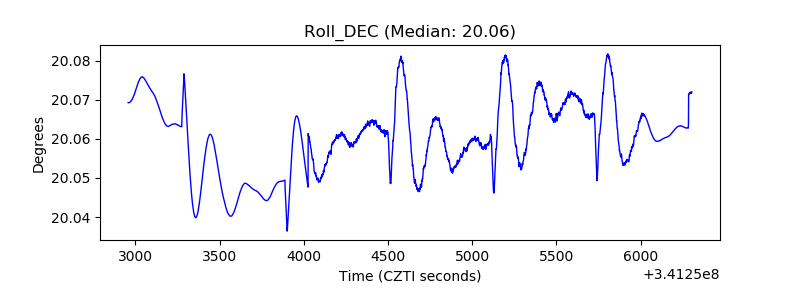 |
| _Roll_RA | 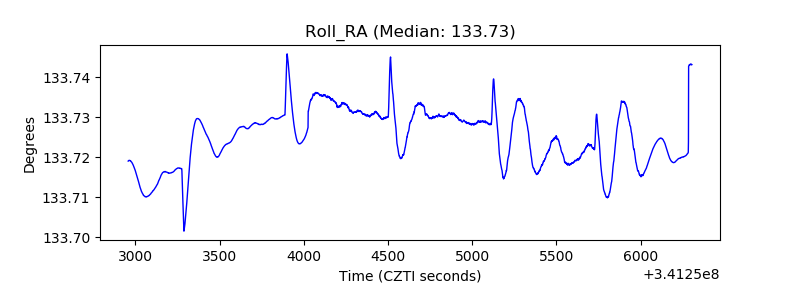 |
| Veto Counter | 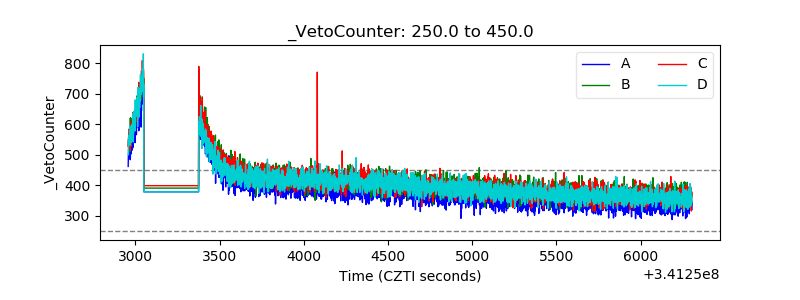 |