| Param | Original file | Final file |
|---|---|---|
| Filename | modeM0/AS1T03_249T01_9000003934_27441cztM0_level2.evt | modeM0/AS1T03_249T01_9000003934_27441cztM0_level2_quad_clean.evt |
| Size (bytes) | 1,627,531,200 | 336,070,080 |
| Size | 1.5 GB | 320.5 MB |
| Events in quadrant A | 10,913,362 | 2,200,279 |
| Events in quadrant B | 11,188,253 | 2,191,851 |
| Events in quadrant C | 11,104,626 | 2,097,753 |
| Events in quadrant D | 14,496,060 | 2,072,717 |
| Mode M0 | |||
|---|---|---|---|
| Quadrant | BADHDUFLAG | Total packets | Discarded packets |
| A | 0 | 48061 | 0 |
| B | 0 | 48801 | 0 |
| C | 0 | 48510 | 0 |
| D | 0 | 59549 | 0 |
| Mode M9 | |||
|---|---|---|---|
| Quadrant | BADHDUFLAG | Total packets | Discarded packets |
| A | 0 | 29 | 0 |
| B | 0 | 29 | 0 |
| C | 0 | 29 | 0 |
| D | 0 | 29 | 0 |
| Quadrant | Total seconds | Saturated seconds | Saturation percentage |
|---|---|---|---|
| A | 23498 | 121 | 0.514937% |
| B | 23499 | 159 | 0.676625% |
| C | 23499 | 295 | 1.255373% |
| D | 23499 | 605 | 2.574578% |
Noise dominated data is calculated using 1-second bins in cleaned event files. If a bin has >2000 counts, and if more than 50% of those come from <1% of pixels, then it is considered to be noise-dominated and hence unusable.
| Quadrant | # 1 sec bins | Bins with >0 counts | Bins with >2000 counts | High rate bins dominated by noise | Noise dominated (total time) | Noise dominated (detector-on time) | Marked lightcurve |
|---|---|---|---|---|---|---|---|
| A | 26328 | 23501 | 2 | 2 | 0.01% | 0.01% | 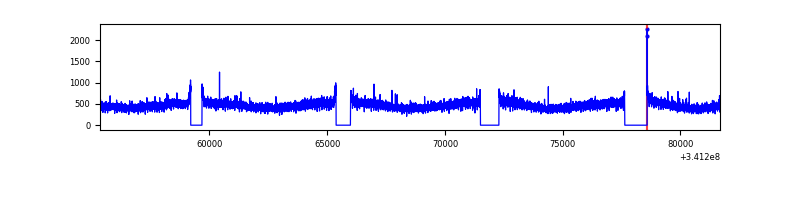 |
| B | 26329 | 23502 | 0 | 0 | 0.00% | 0.00% | 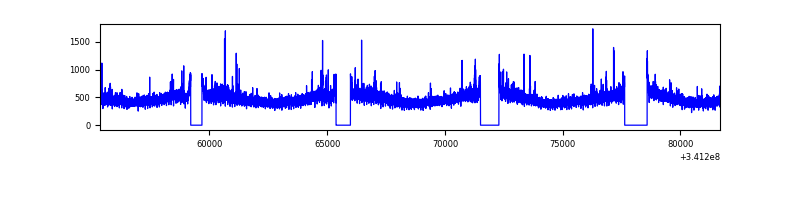 |
| C | 26329 | 23501 | 13 | 13 | 0.05% | 0.06% | 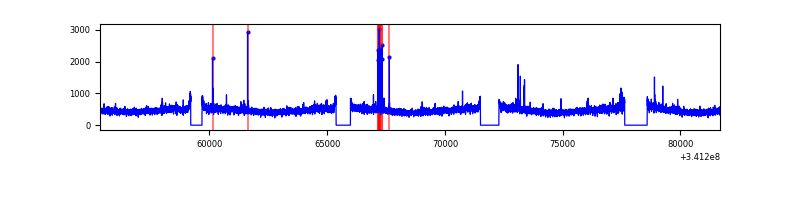 |
| D | 26329 | 23503 | 432 | 432 | 1.64% | 1.84% | 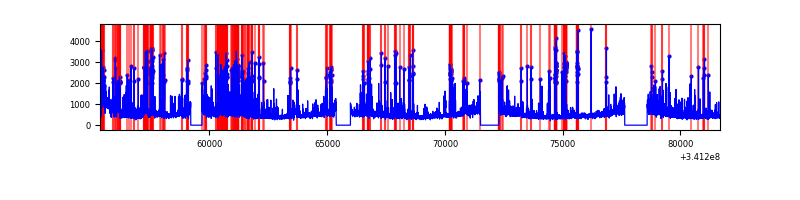 |
Top three noisy pixels from each quadrant. If the there are fewer than three noisy pixels in the level2.evt file, extra rows are filled as -1
| Pixel properties | Quadrant properties | ||||||
|---|---|---|---|---|---|---|---|
| Quadrant | DetID | PixID | Counts | Sigma | Mean | Median | Sigma |
| A | 13 | 254 | 39338 | 64.82 | 2825 | 2765 | 564.2 |
| A | 3 | 137 | 27283 | 43.45 | 2825 | 2765 | 564.2 |
| A | 0 | 226 | 23848 | 37.37 | 2825 | 2765 | 564.2 |
| B | 0 | 190 | 69945 | 126.48 | 2796 | 2720 | 531.5 |
| B | 12 | 111 | 66888 | 120.73 | 2796 | 2720 | 531.5 |
| B | 11 | 111 | 60234 | 108.21 | 2796 | 2720 | 531.5 |
| C | 14 | 238 | 432168 | 680.65 | 2696 | 2715 | 630.9 |
| C | 10 | 22 | 108576 | 167.78 | 2696 | 2715 | 630.9 |
| C | 2 | 16 | 30466 | 43.98 | 2696 | 2715 | 630.9 |
| D | 1 | 52 | 3406582 | 5327.68 | 2705 | 2637 | 638.9 |
| D | 2 | 250 | 506704 | 788.94 | 2705 | 2637 | 638.9 |
| D | 12 | 227 | 302916 | 469.98 | 2705 | 2637 | 638.9 |
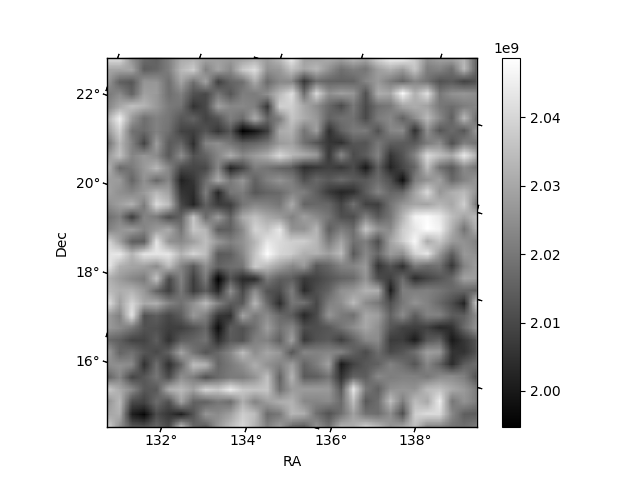
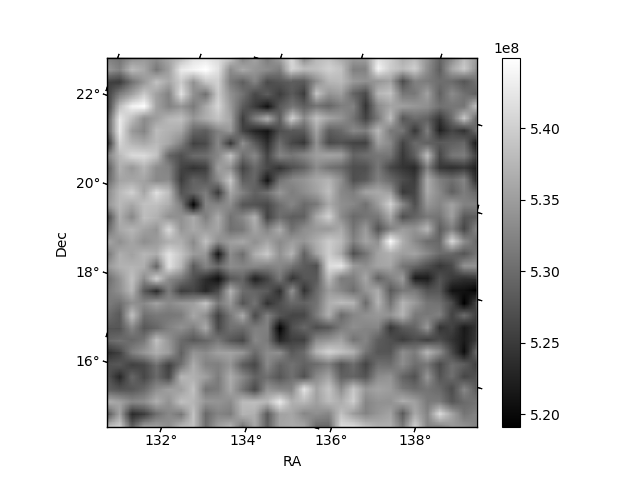
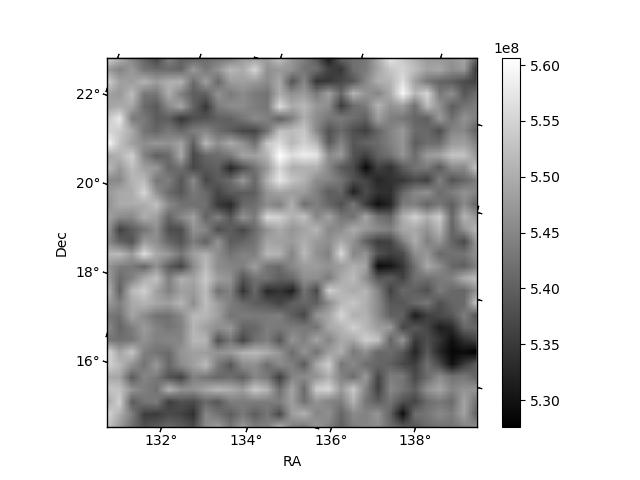
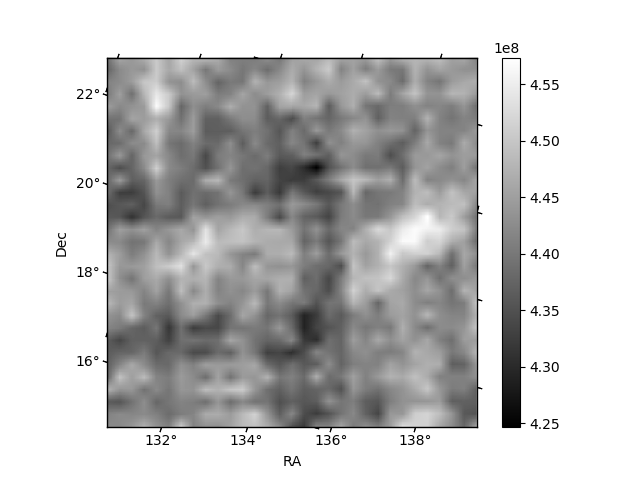
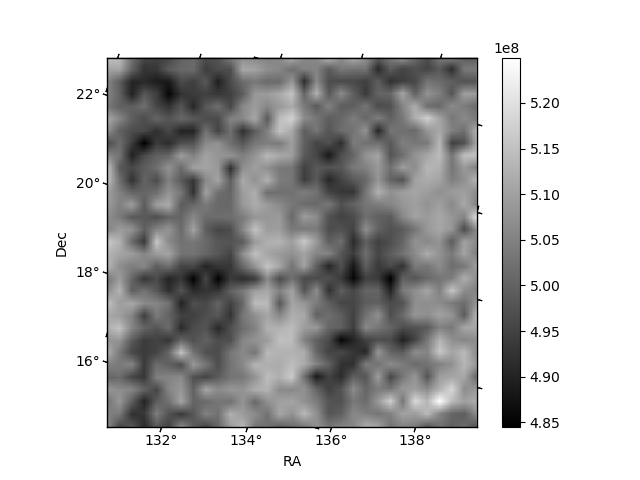
Histogram calculated using DETX and DETY for each event in the final _common_clean file
| Quadrant A | 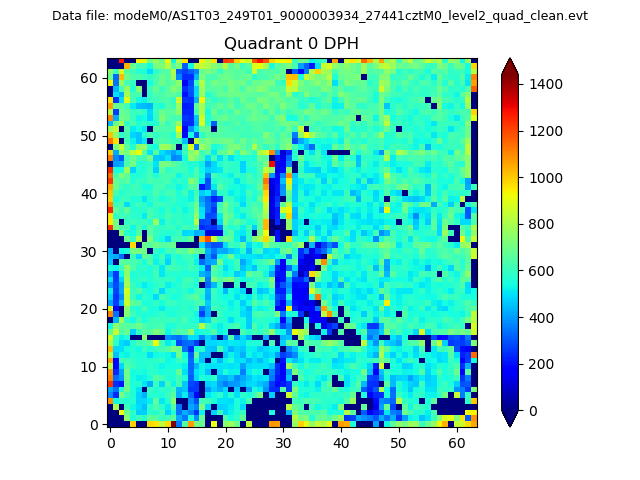 |
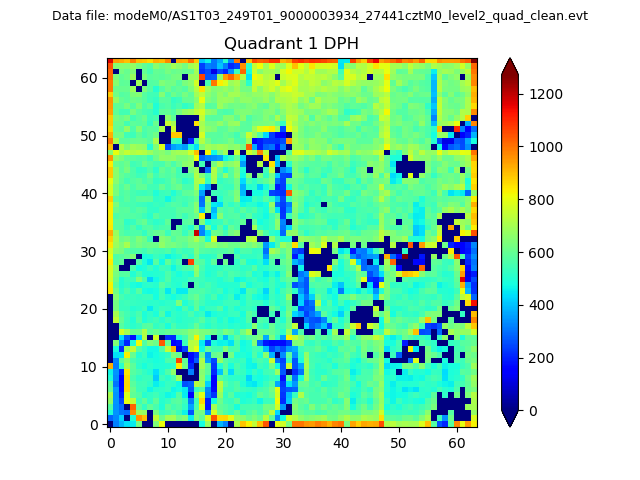 |
Quadrant B |
|---|---|---|---|
| Quadrant D | 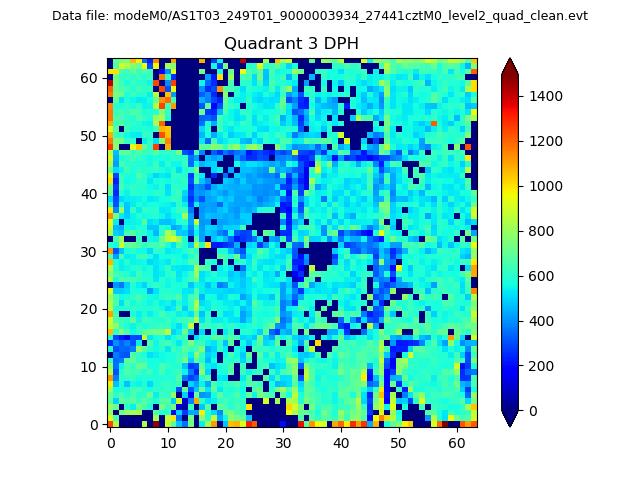 |
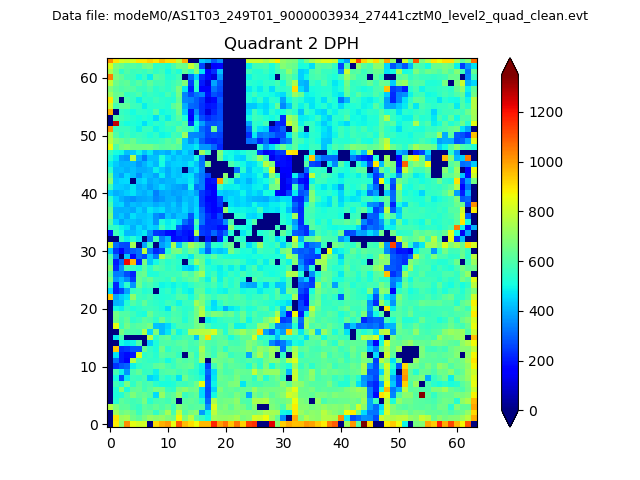 |
Quadrant C |
| Plot type | Count rate plots | Images |
|---|---|---|
| Comparison with Poisson distribution Blue bars denote a histogram of data divided into 1 sec bins. Red curve is a Poisson curve with rate = median count rate of data. |
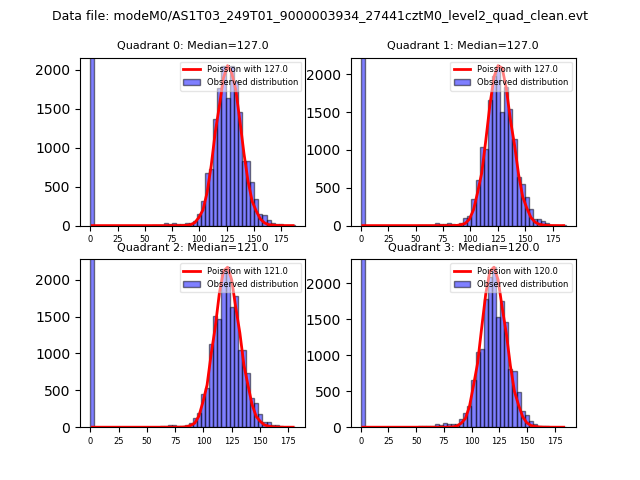 |
 |
| Quadrant-wise count rates Data is divided into 100 sec bins |
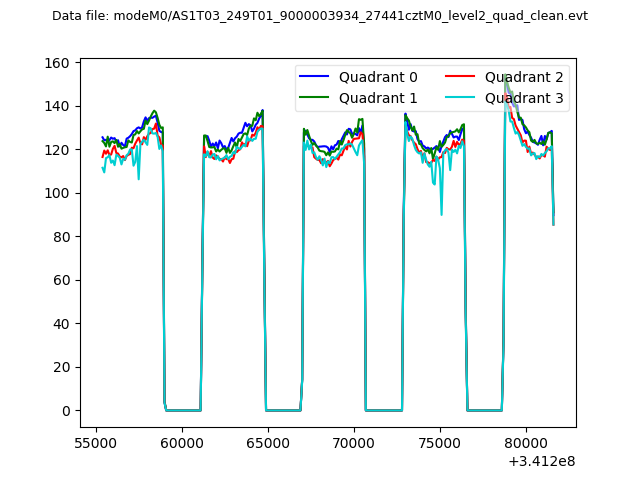 |
|
| Module-wise count rates for Quadrant A Data is divided into 100 sec bins |
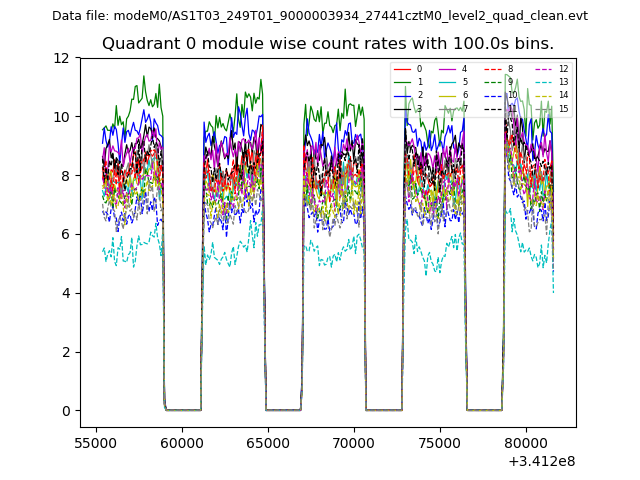 |
 |
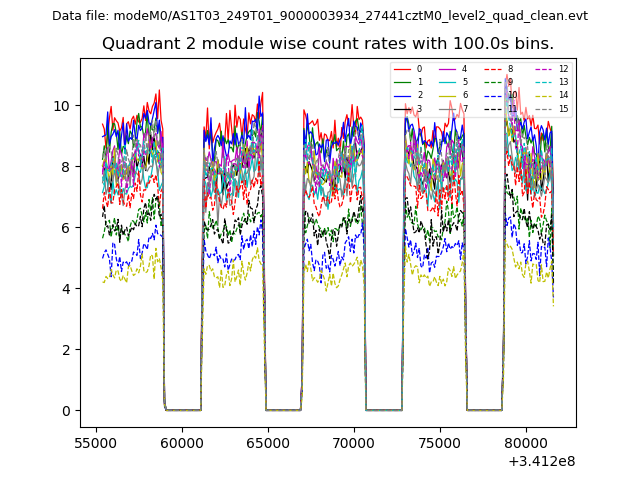
| Module-wise count rates for Quadrant B Data is divided into 100 sec bins |
 |
 |
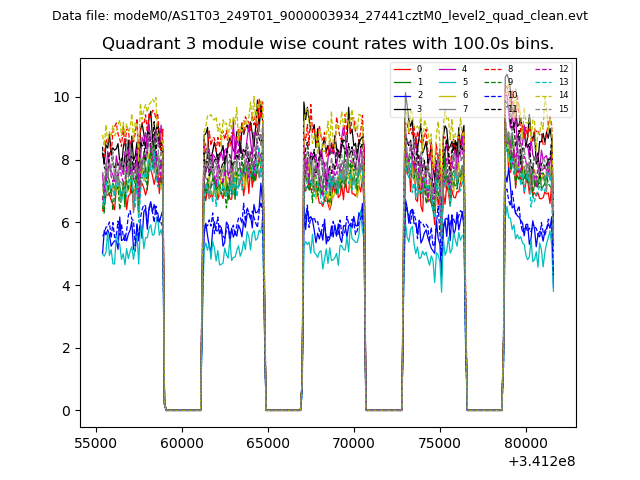
| Module-wise count rates for Quadrant C Data is divided into 100 sec bins |
 |
 |
| Module-wise count rates for Quadrant D Data is divided into 100 sec bins |
 |
 |
| Parameter | Plot |
|---|---|
| CZT HV Monitor | 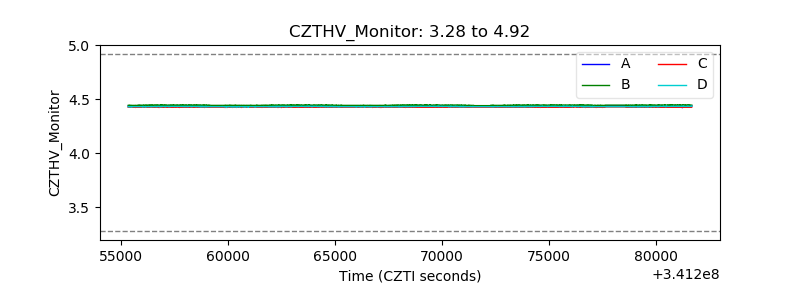 |
| D_VDD | 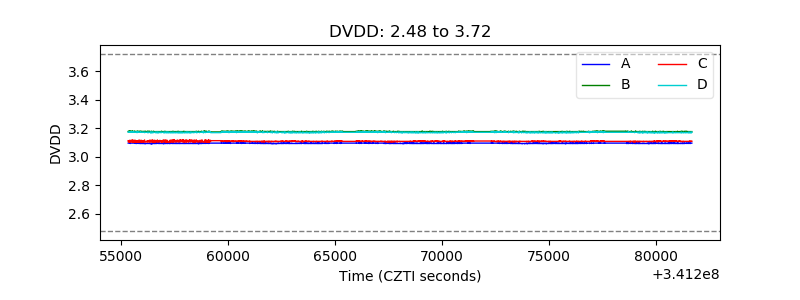 |
| Temperature 1 | 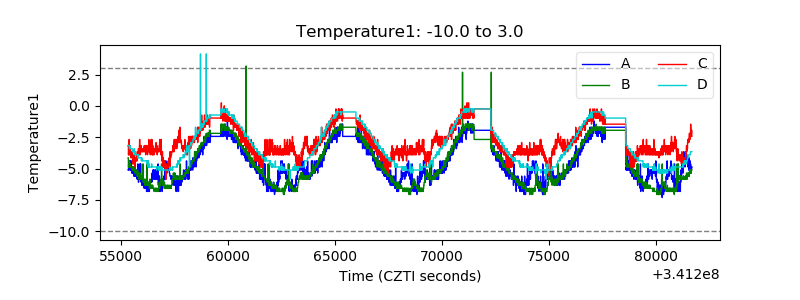 |
| Veto HV Monitor | 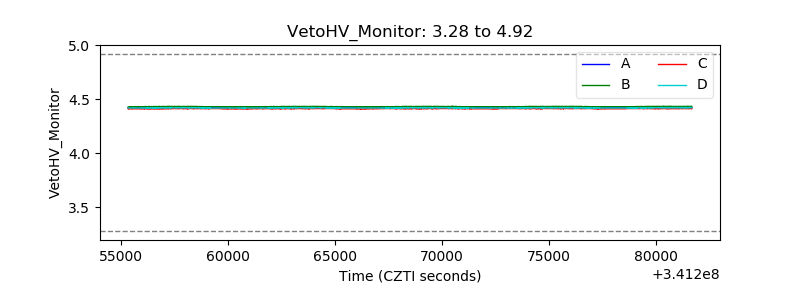 |
| Veto LLD | 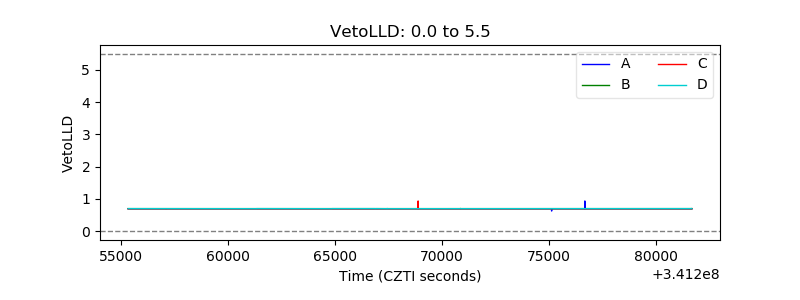 |
| Alpha Counter | 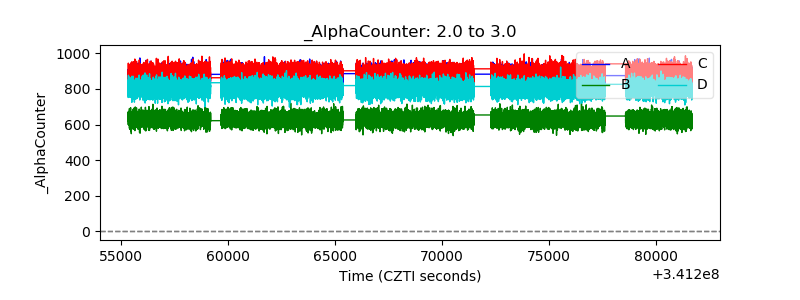 |
| _CPM_Rate | 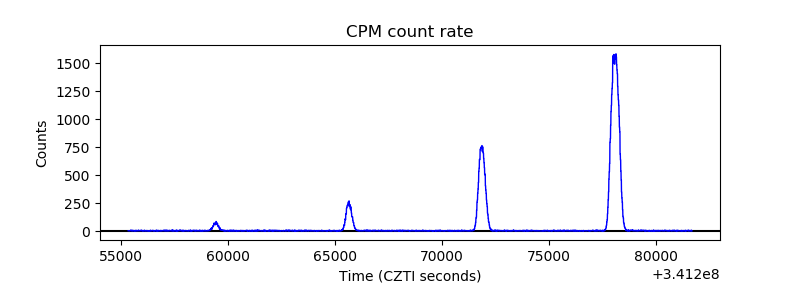 |
| CZT Counter | 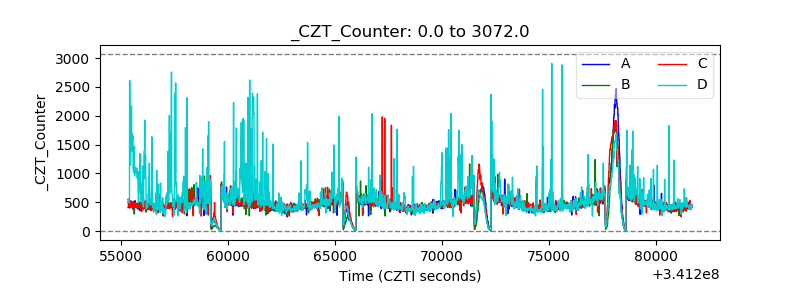 |
| +2.5 Volts monitor |  |
| +5 Volts monitor |  |
| _ROLL_ROT | 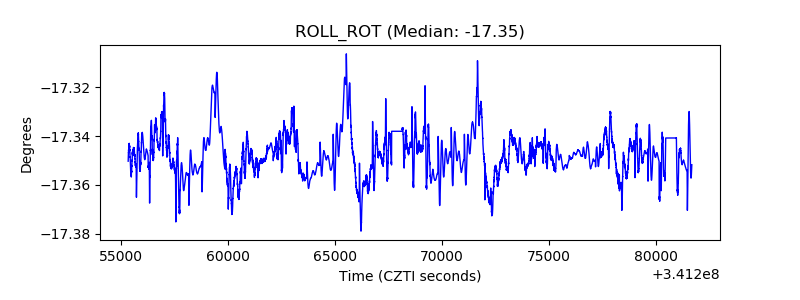 |
| _Roll_DEC | 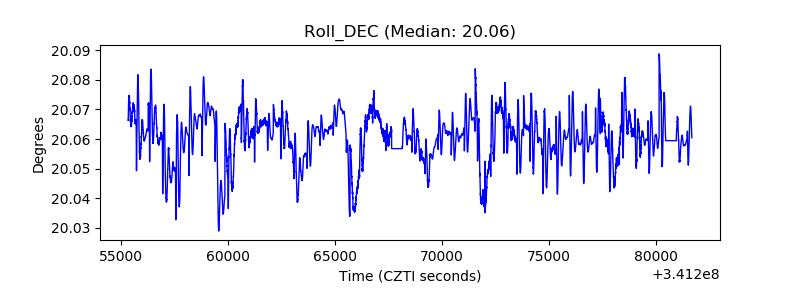 |
| _Roll_RA | 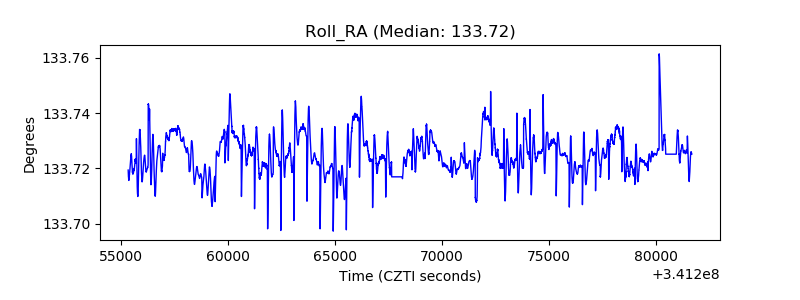 |
| Veto Counter |  |