| Param | Original file | Final file |
|---|---|---|
| Filename | modeM0/AS1T03_249T01_9000003934_27442cztM0_level2.evt | modeM0/AS1T03_249T01_9000003934_27442cztM0_level2_quad_clean.evt |
| Size (bytes) | 630,691,200 | 130,008,960 |
| Size | 601.5 MB | 124.0 MB |
| Events in quadrant A | 4,398,882 | 848,430 |
| Events in quadrant B | 4,494,520 | 865,015 |
| Events in quadrant C | 4,422,165 | 811,709 |
| Events in quadrant D | 5,179,051 | 792,138 |
| Mode M0 | |||
|---|---|---|---|
| Quadrant | BADHDUFLAG | Total packets | Discarded packets |
| A | 0 | 18599 | 0 |
| B | 0 | 18939 | 0 |
| C | 0 | 18722 | 0 |
| D | 0 | 21383 | 0 |
| Mode M9 | |||
|---|---|---|---|
| Quadrant | BADHDUFLAG | Total packets | Discarded packets |
| A | 0 | 24 | 0 |
| B | 0 | 24 | 0 |
| C | 0 | 24 | 0 |
| D | 0 | 24 | 0 |
| Quadrant | Total seconds | Saturated seconds | Saturation percentage |
|---|---|---|---|
| A | 8949 | 21 | 0.234663% |
| B | 8949 | 42 | 0.469326% |
| C | 8949 | 89 | 0.994525% |
| D | 8949 | 262 | 2.927701% |
Noise dominated data is calculated using 1-second bins in cleaned event files. If a bin has >2000 counts, and if more than 50% of those come from <1% of pixels, then it is considered to be noise-dominated and hence unusable.
| Quadrant | # 1 sec bins | Bins with >0 counts | Bins with >2000 counts | High rate bins dominated by noise | Noise dominated (total time) | Noise dominated (detector-on time) | Marked lightcurve |
|---|---|---|---|---|---|---|---|
| A | 11249 | 8951 | 0 | 0 | 0.00% | 0.00% | 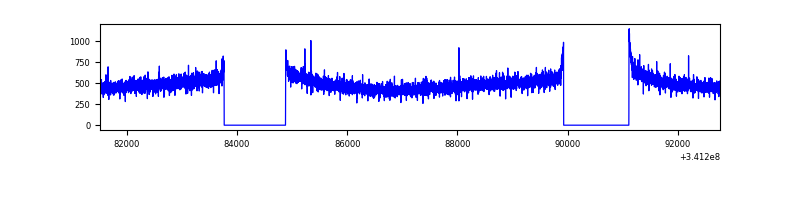 |
| B | 11249 | 8951 | 1 | 1 | 0.01% | 0.01% | 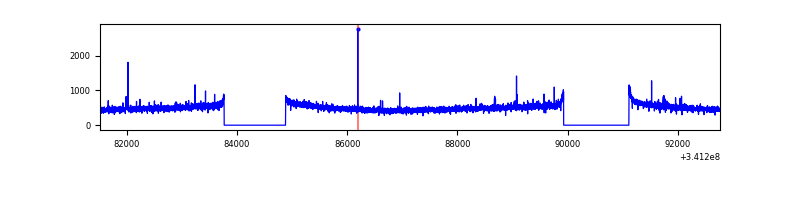 |
| C | 11249 | 8951 | 0 | 0 | 0.00% | 0.00% | 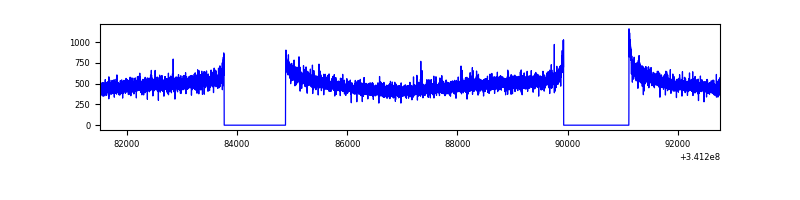 |
| D | 11249 | 8951 | 214 | 214 | 1.90% | 2.39% | 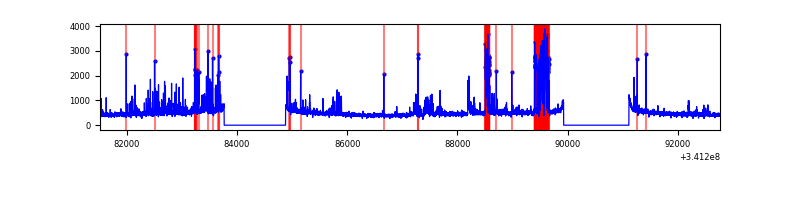 |
Top three noisy pixels from each quadrant. If the there are fewer than three noisy pixels in the level2.evt file, extra rows are filled as -1
| Pixel properties | Quadrant properties | ||||||
|---|---|---|---|---|---|---|---|
| Quadrant | DetID | PixID | Counts | Sigma | Mean | Median | Sigma |
| A | 13 | 254 | 15078 | 61.64 | 1140 | 1120 | 226.4 |
| A | 3 | 137 | 10358 | 40.8 | 1140 | 1120 | 226.4 |
| A | 0 | 226 | 9854 | 38.57 | 1140 | 1120 | 226.4 |
| B | 12 | 111 | 26315 | 118.15 | 1135 | 1112 | 213.3 |
| B | 11 | 111 | 23414 | 104.55 | 1135 | 1112 | 213.3 |
| B | 14 | 111 | 21760 | 96.8 | 1135 | 1112 | 213.3 |
| C | 14 | 238 | 175936 | 686.7 | 1088 | 1095 | 254.6 |
| C | 13 | 61 | 7672 | 25.83 | 1088 | 1095 | 254.6 |
| C | 10 | 22 | 5010 | 15.38 | 1088 | 1095 | 254.6 |
| D | 1 | 52 | 978875 | 3880.6 | 1080 | 1051 | 252.0 |
| D | 2 | 250 | 64747 | 252.78 | 1080 | 1051 | 252.0 |
| D | 12 | 227 | 39476 | 152.49 | 1080 | 1051 | 252.0 |
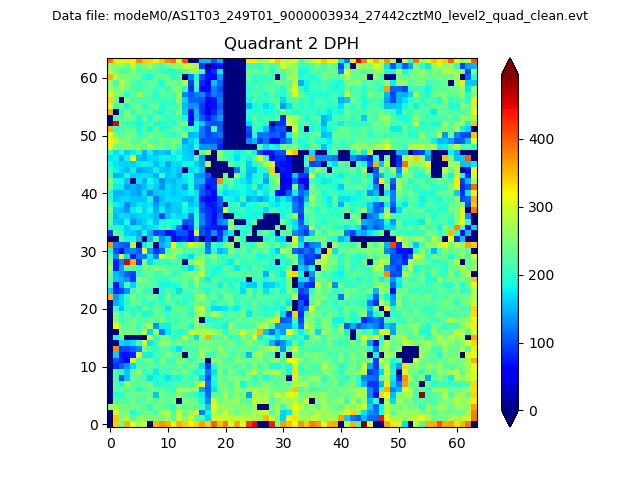
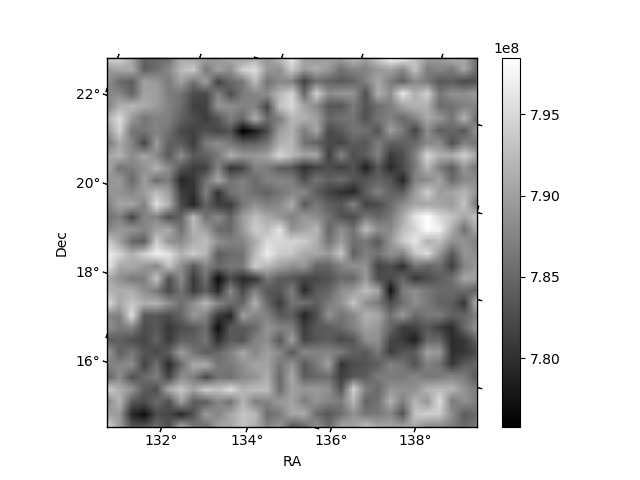
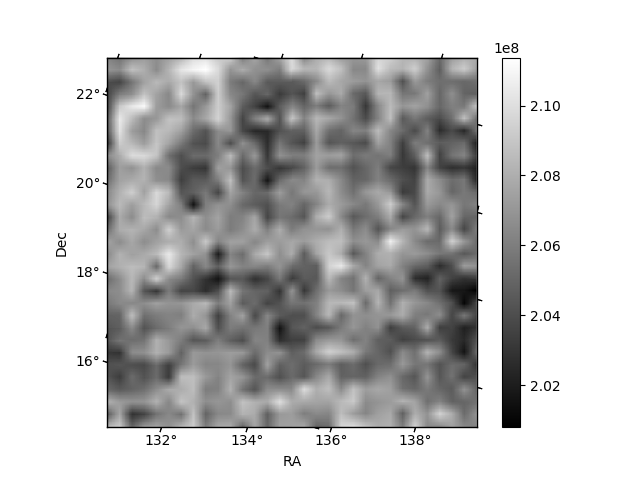
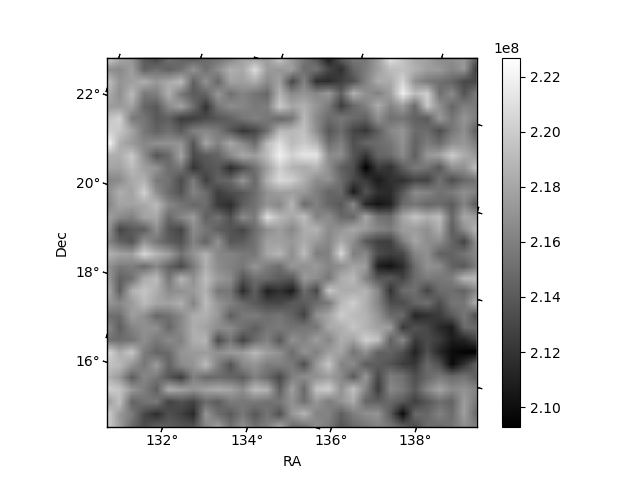
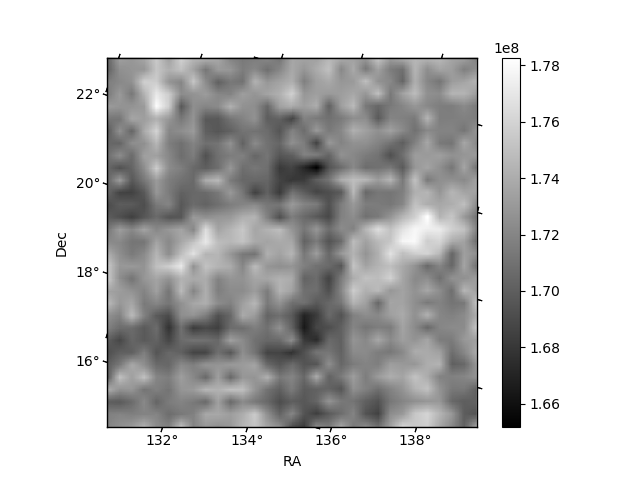
Histogram calculated using DETX and DETY for each event in the final _common_clean file
| Quadrant A | 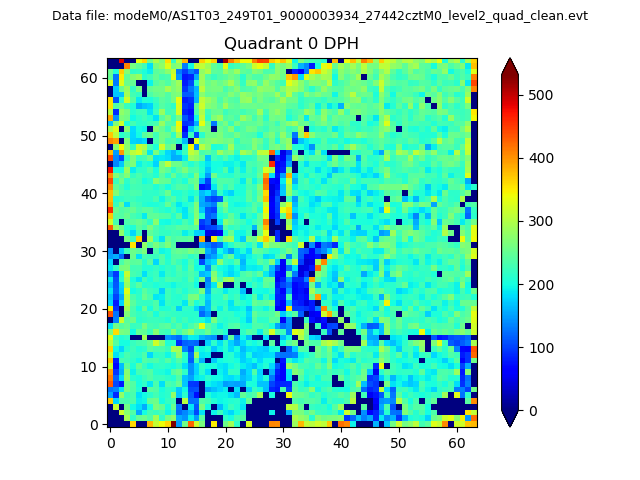 |
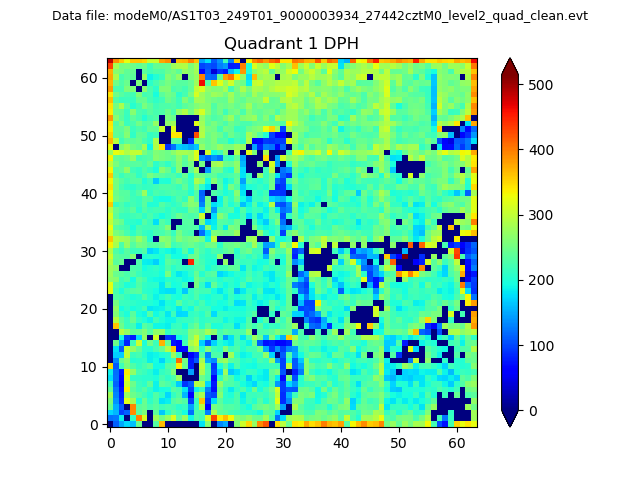 |
Quadrant B |
|---|---|---|---|
| Quadrant D | 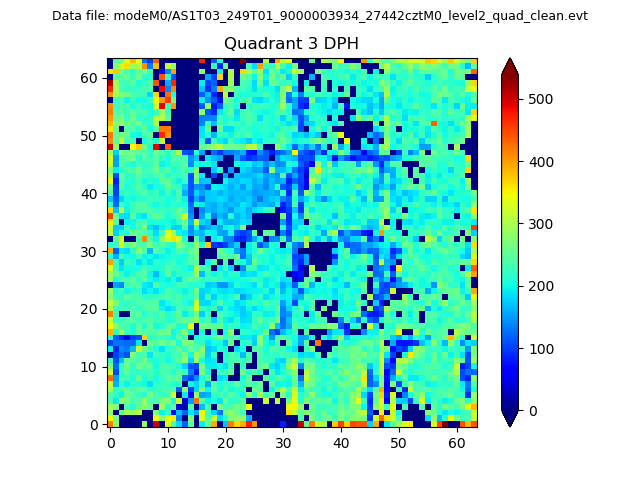 |
 |
Quadrant C |
| Plot type | Count rate plots | Images |
|---|---|---|
| Comparison with Poisson distribution Blue bars denote a histogram of data divided into 1 sec bins. Red curve is a Poisson curve with rate = median count rate of data. |
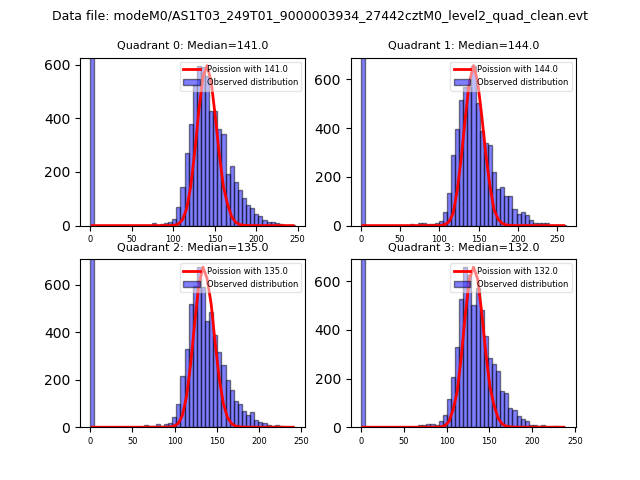 |
 |
| Quadrant-wise count rates Data is divided into 100 sec bins |
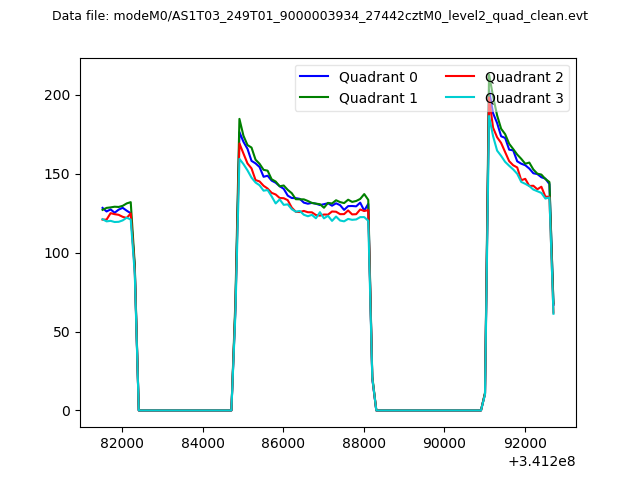 |
|
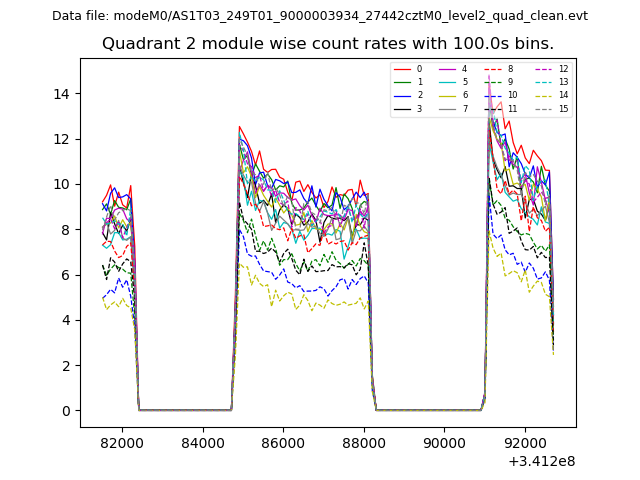
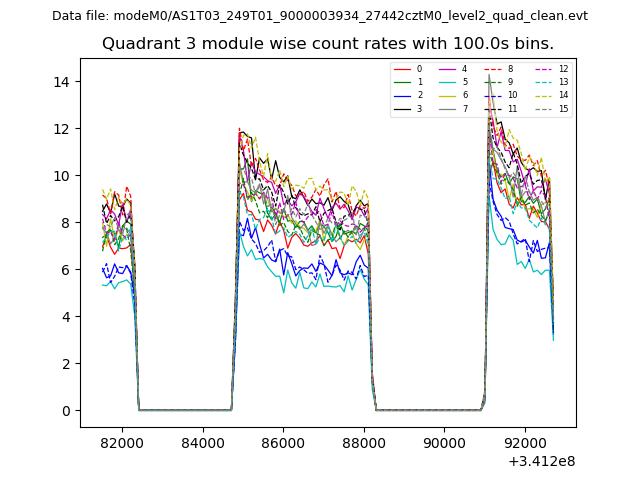
| Module-wise count rates for Quadrant A Data is divided into 100 sec bins |
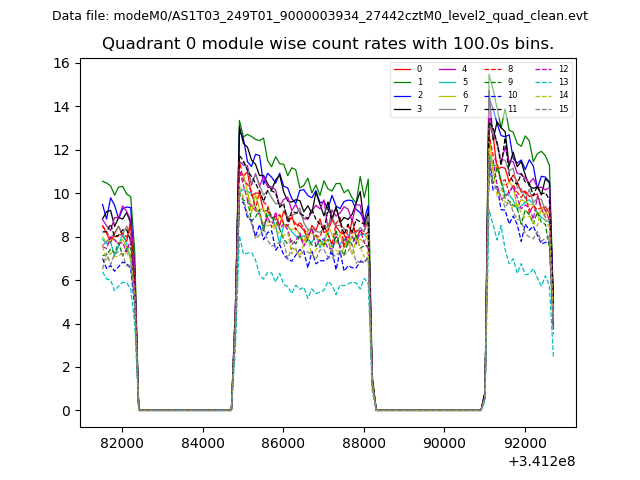 |
 |
| Module-wise count rates for Quadrant B Data is divided into 100 sec bins |
 |
 |
| Module-wise count rates for Quadrant C Data is divided into 100 sec bins |
 |
 |
| Module-wise count rates for Quadrant D Data is divided into 100 sec bins |
 |
 |
| Parameter | Plot |
|---|---|
| CZT HV Monitor | 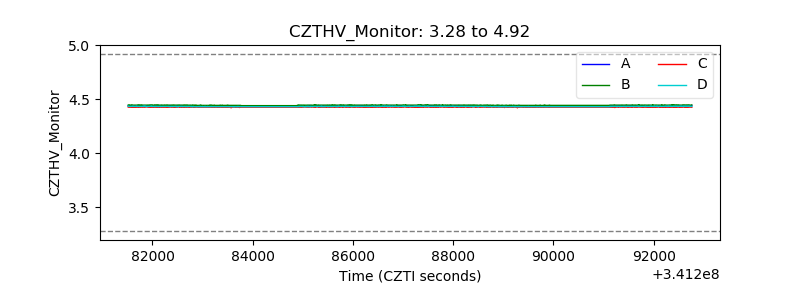 |
| D_VDD | 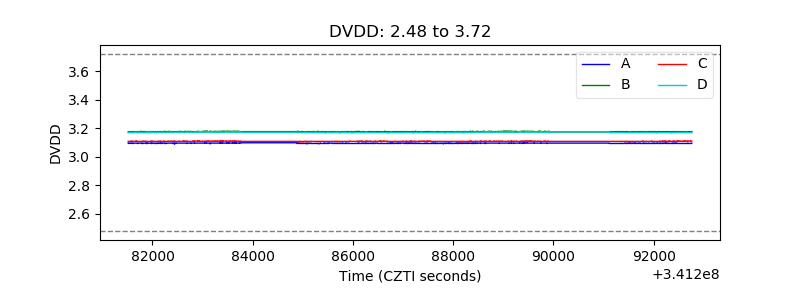 |
| Temperature 1 | 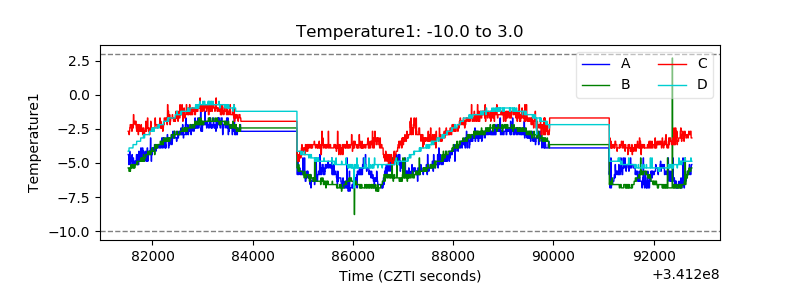 |
| Veto HV Monitor |  |
| Veto LLD | 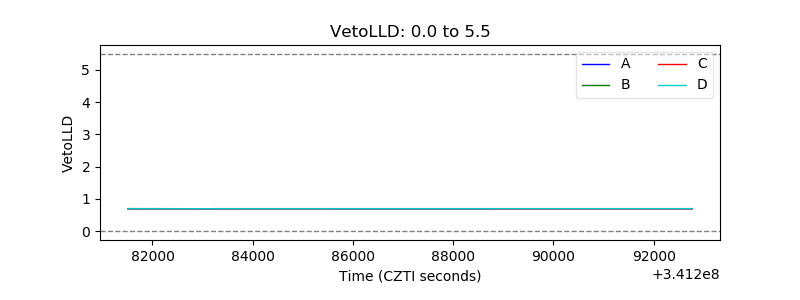 |
| Alpha Counter | 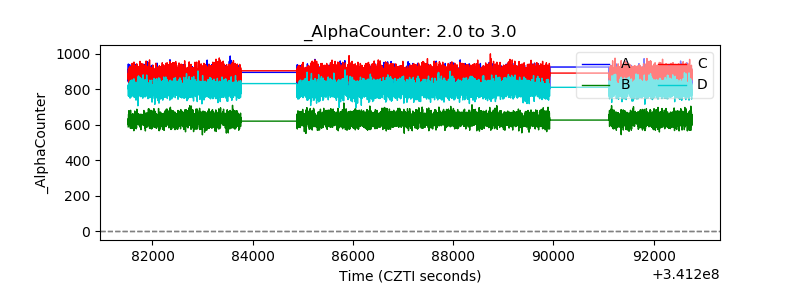 |
| _CPM_Rate | 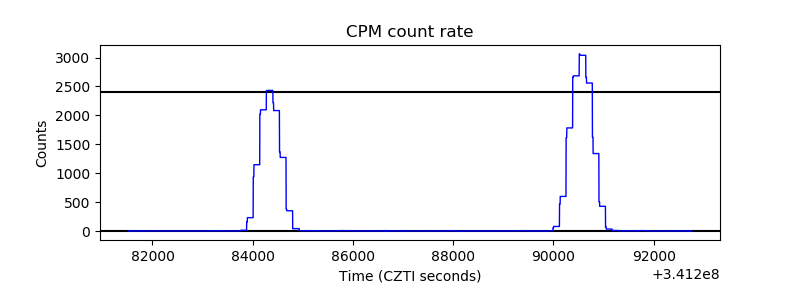 |
| CZT Counter | 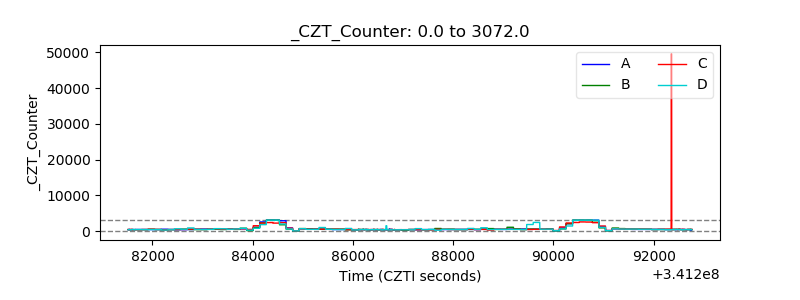 |
| +2.5 Volts monitor |  |
| +5 Volts monitor |  |
| _ROLL_ROT | 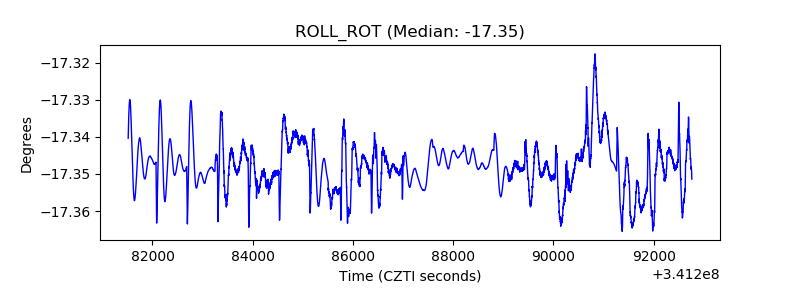 |
| _Roll_DEC | 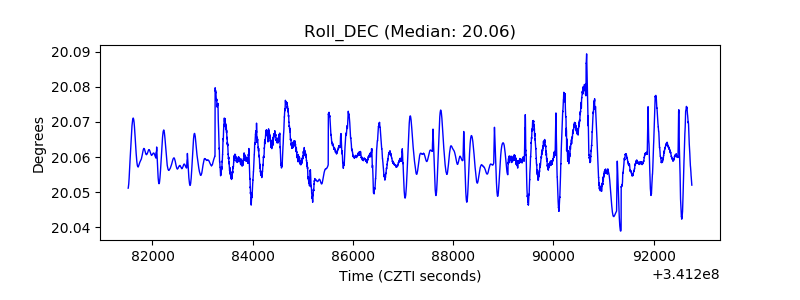 |
| _Roll_RA | 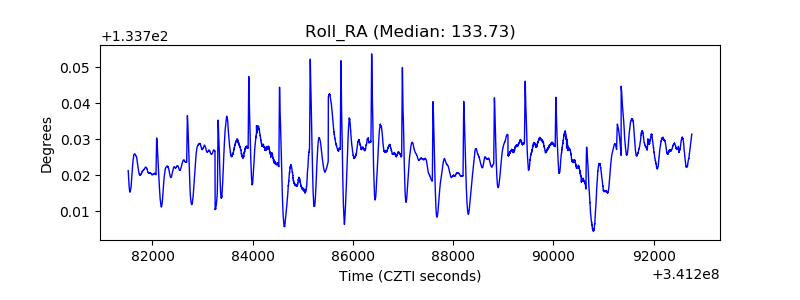 |
| Veto Counter | 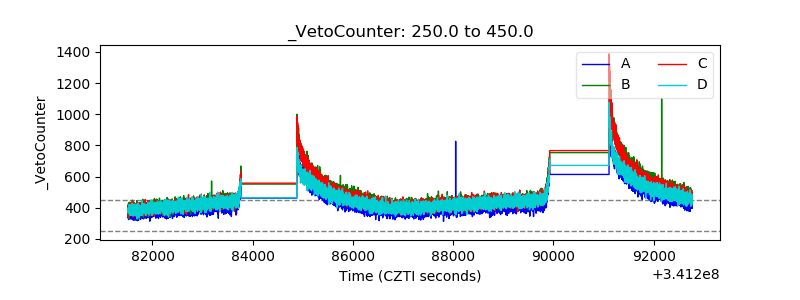 |