| Param | Original file | Final file |
|---|---|---|
| Filename | modeM0/AS1T03_249T01_9000003934_27444cztM0_level2.evt | modeM0/AS1T03_249T01_9000003934_27444cztM0_level2_quad_clean.evt |
| Size (bytes) | 441,861,120 | 97,787,520 |
| Size | 421.4 MB | 93.3 MB |
| Events in quadrant A | 3,241,722 | 644,518 |
| Events in quadrant B | 3,281,679 | 656,627 |
| Events in quadrant C | 3,285,780 | 617,750 |
| Events in quadrant D | 3,145,451 | 603,913 |
| Mode M0 | |||
|---|---|---|---|
| Quadrant | BADHDUFLAG | Total packets | Discarded packets |
| A | 0 | 13161 | 0 |
| B | 0 | 13282 | 0 |
| C | 0 | 13341 | 0 |
| D | 0 | 13211 | 0 |
| Mode M9 | |||
|---|---|---|---|
| Quadrant | BADHDUFLAG | Total packets | Discarded packets |
| A | 0 | 13 | 0 |
| B | 0 | 13 | 0 |
| C | 0 | 13 | 0 |
| D | 0 | 13 | 0 |
| Quadrant | Total seconds | Saturated seconds | Saturation percentage |
|---|---|---|---|
| A | 6284 | 22 | 0.350095% |
| B | 6285 | 50 | 0.795545% |
| C | 6285 | 76 | 1.209228% |
| D | 6285 | 25 | 0.397772% |
Noise dominated data is calculated using 1-second bins in cleaned event files. If a bin has >2000 counts, and if more than 50% of those come from <1% of pixels, then it is considered to be noise-dominated and hence unusable.
| Quadrant | # 1 sec bins | Bins with >0 counts | Bins with >2000 counts | High rate bins dominated by noise | Noise dominated (total time) | Noise dominated (detector-on time) | Marked lightcurve |
|---|---|---|---|---|---|---|---|
| A | 7594 | 6285 | 0 | 0 | 0.00% | 0.00% | 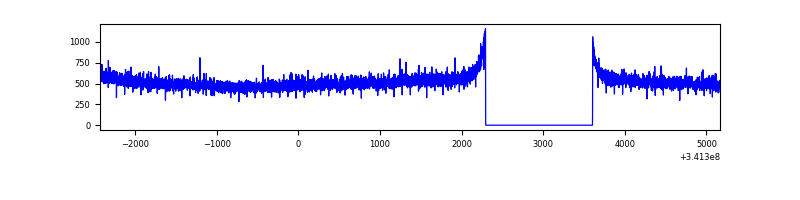 |
| B | 7595 | 6286 | 0 | 0 | 0.00% | 0.00% | 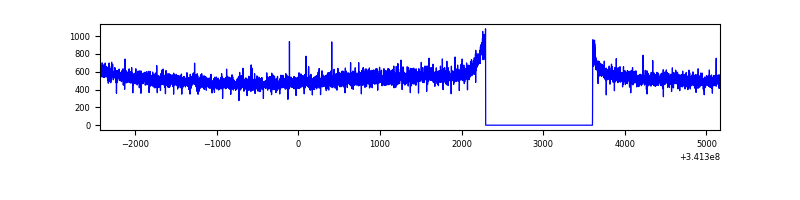 |
| C | 7595 | 6286 | 3 | 3 | 0.04% | 0.05% | 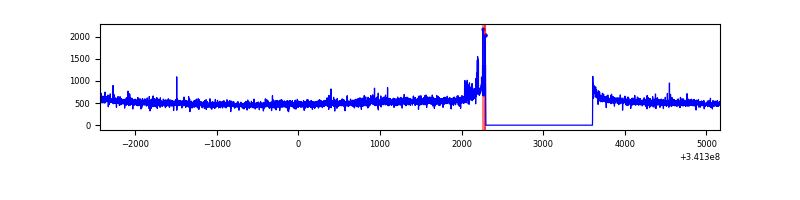 |
| D | 7595 | 6286 | 14 | 14 | 0.18% | 0.22% | 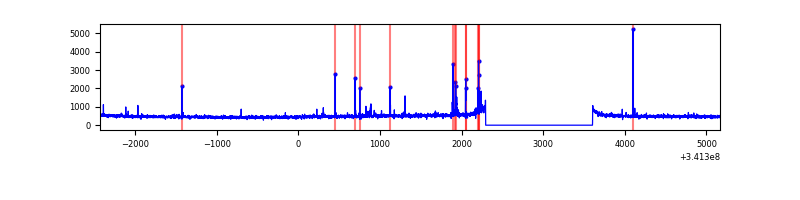 |
Top three noisy pixels from each quadrant. If the there are fewer than three noisy pixels in the level2.evt file, extra rows are filled as -1
| Pixel properties | Quadrant properties | ||||||
|---|---|---|---|---|---|---|---|
| Quadrant | DetID | PixID | Counts | Sigma | Mean | Median | Sigma |
| A | 13 | 254 | 10321 | 57.1 | 841 | 827 | 166.3 |
| A | 0 | 226 | 7366 | 39.33 | 841 | 827 | 166.3 |
| A | 3 | 137 | 7288 | 38.86 | 841 | 827 | 166.3 |
| B | 0 | 189 | 22145 | 136.78 | 831 | 813 | 156.0 |
| B | 12 | 111 | 18542 | 113.68 | 831 | 813 | 156.0 |
| B | 11 | 111 | 16414 | 100.03 | 831 | 813 | 156.0 |
| C | 14 | 238 | 130520 | 693.36 | 800 | 808 | 187.1 |
| C | 10 | 22 | 34986 | 182.69 | 800 | 808 | 187.1 |
| C | 13 | 61 | 5516 | 25.17 | 800 | 808 | 187.1 |
| D | 2 | 250 | 65803 | 342.22 | 804 | 784 | 190.0 |
| D | 2 | 234 | 21553 | 109.32 | 804 | 784 | 190.0 |
| D | 1 | 52 | 14643 | 72.95 | 804 | 784 | 190.0 |
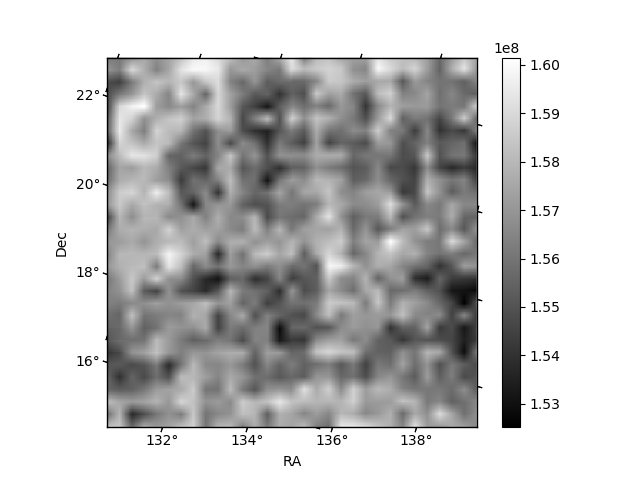
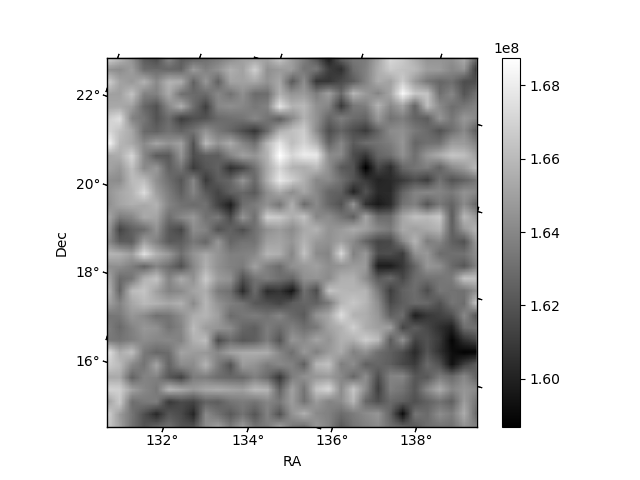
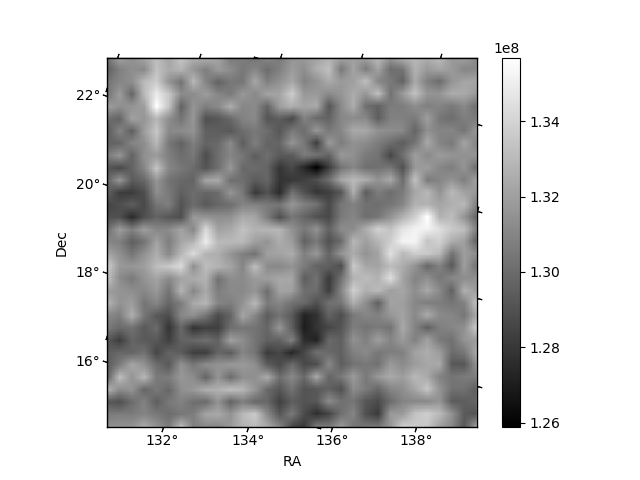
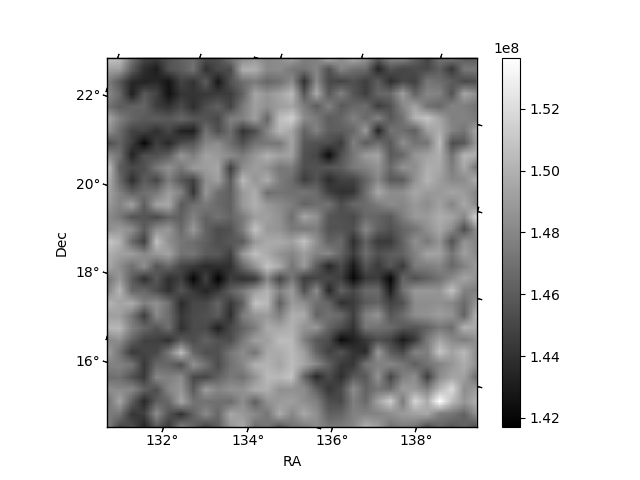
Histogram calculated using DETX and DETY for each event in the final _common_clean file
| Quadrant A | 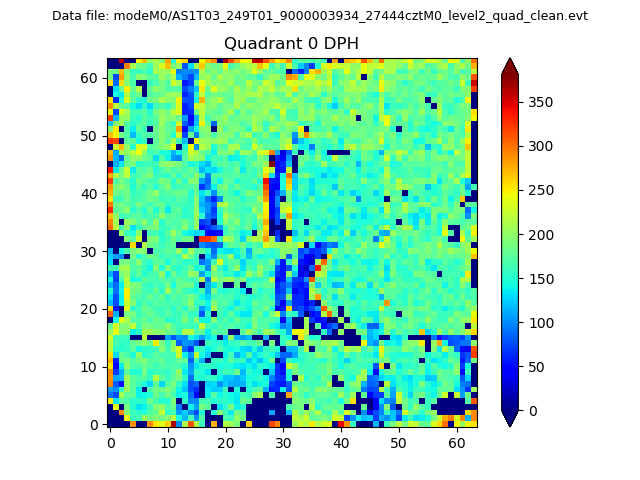 |
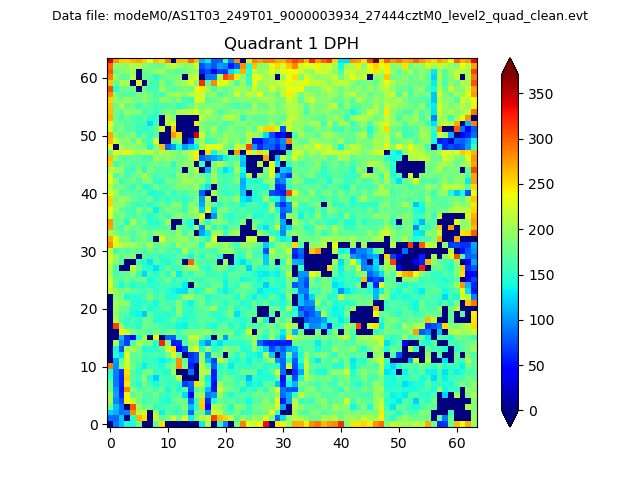 |
Quadrant B |
|---|---|---|---|
| Quadrant D | 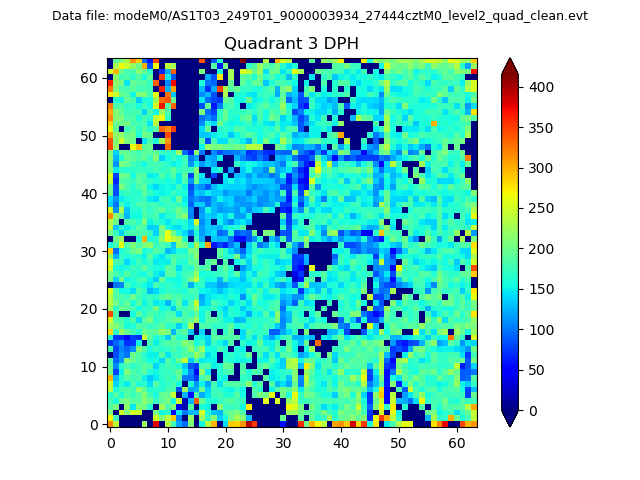 |
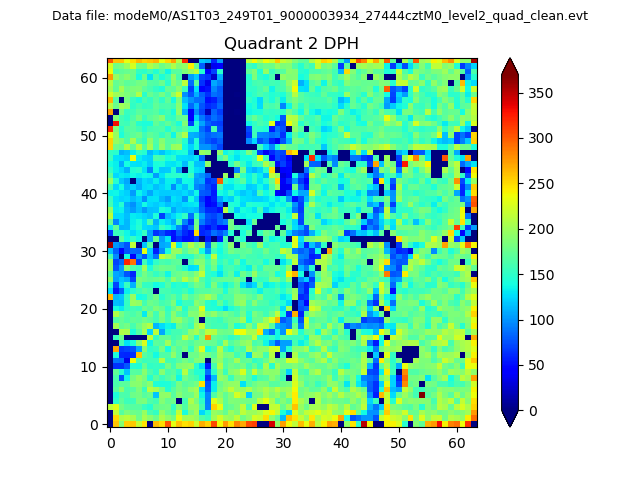 |
Quadrant C |
| Plot type | Count rate plots | Images |
|---|---|---|
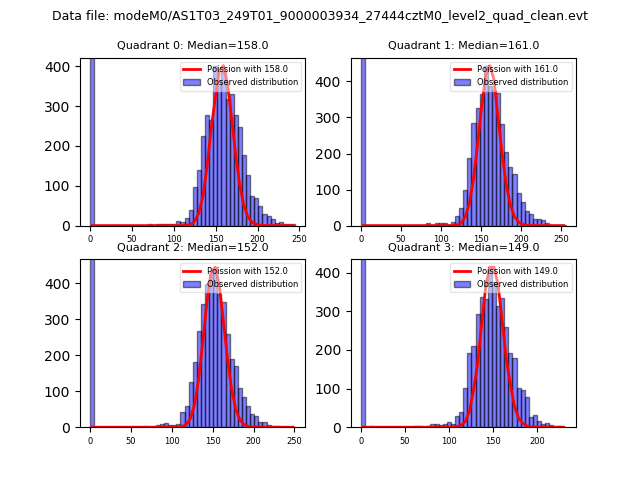
| Comparison with Poisson distribution Blue bars denote a histogram of data divided into 1 sec bins. Red curve is a Poisson curve with rate = median count rate of data. |
 |
 |
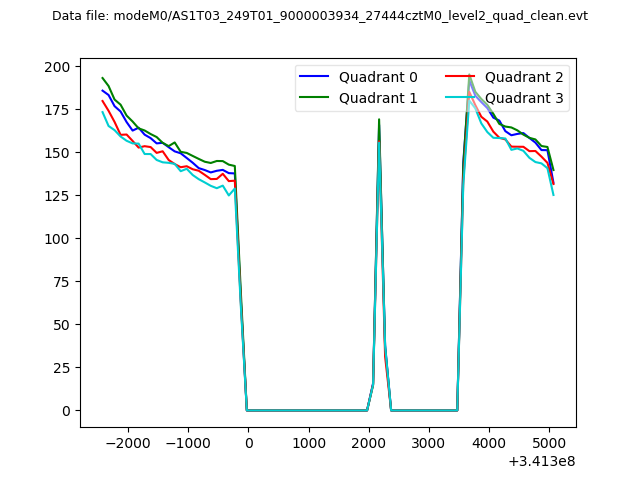
| Quadrant-wise count rates Data is divided into 100 sec bins |
 |
|
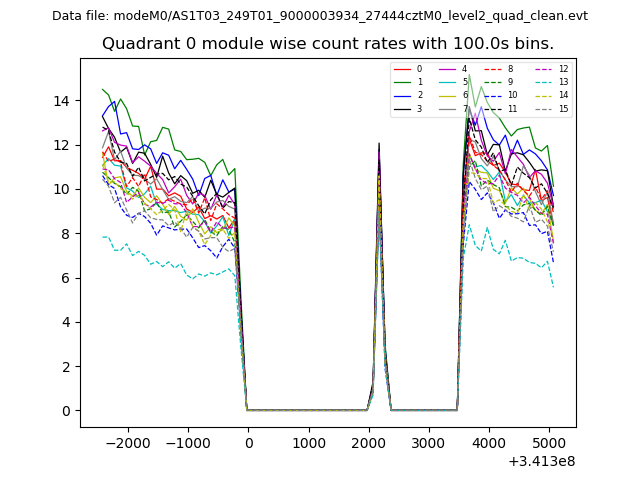
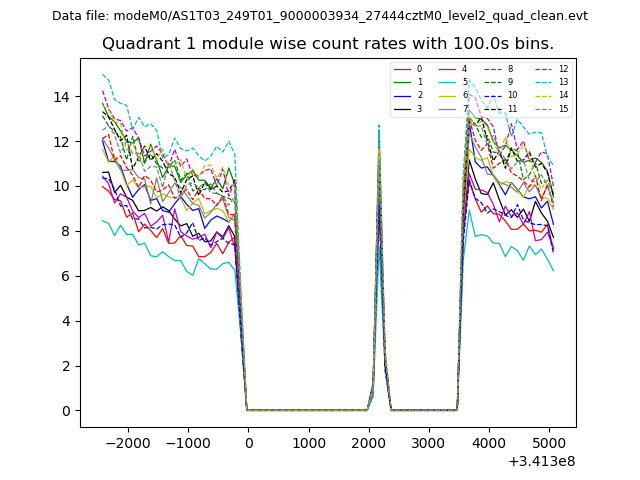
| Module-wise count rates for Quadrant A Data is divided into 100 sec bins |
 |
 |
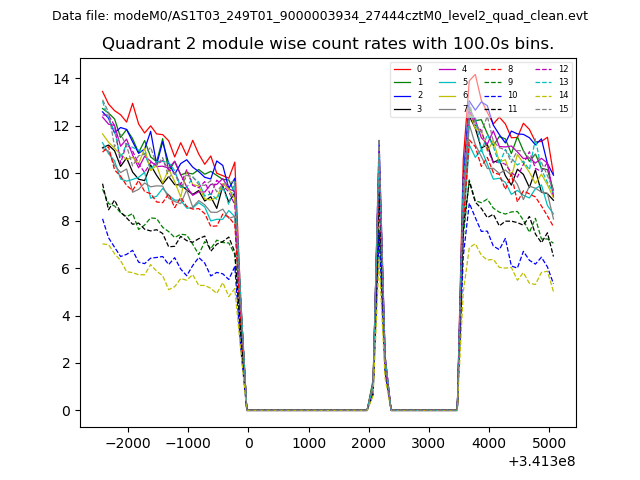
| Module-wise count rates for Quadrant B Data is divided into 100 sec bins |
 |
 |
| Module-wise count rates for Quadrant C Data is divided into 100 sec bins |
 |
 |
| Module-wise count rates for Quadrant D Data is divided into 100 sec bins |
 |
 |
| Parameter | Plot |
|---|---|
| CZT HV Monitor | 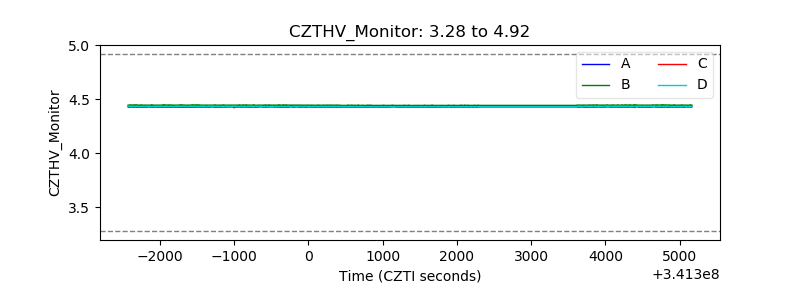 |
| D_VDD | 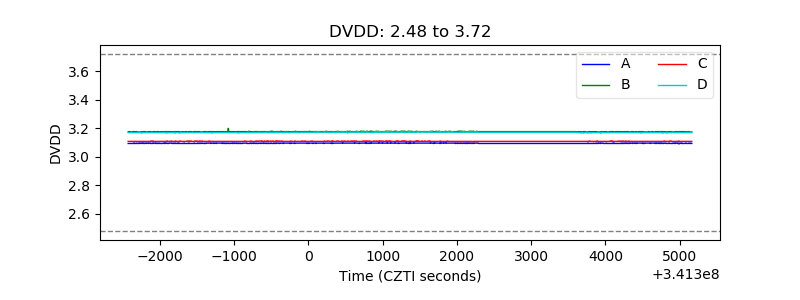 |
| Temperature 1 | 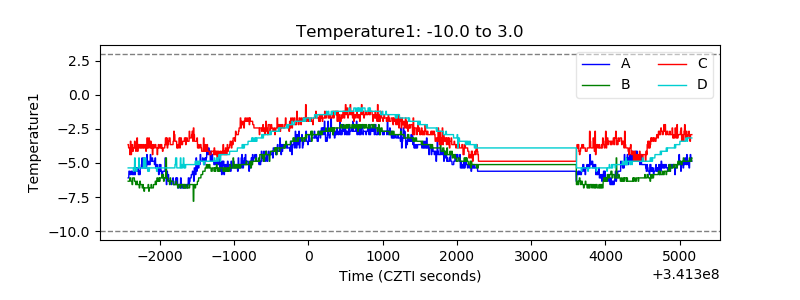 |
| Veto HV Monitor | 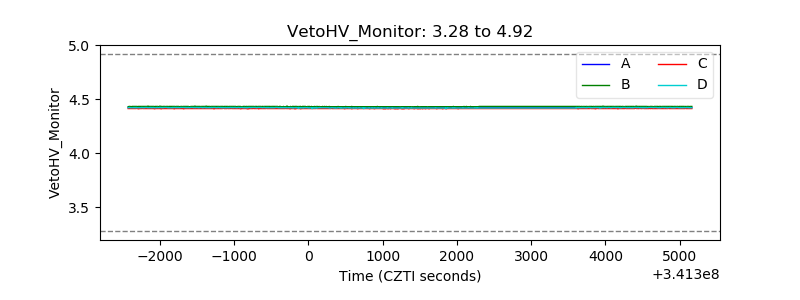 |
| Veto LLD | 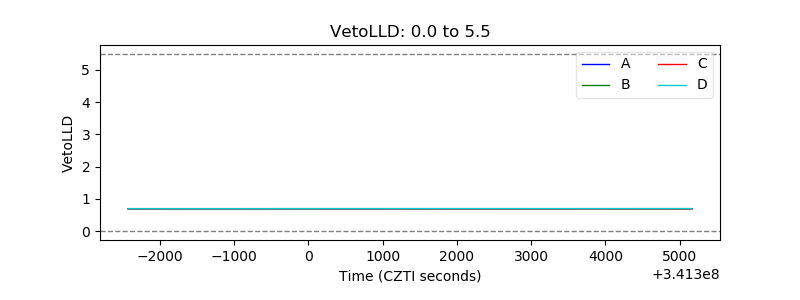 |
| Alpha Counter | 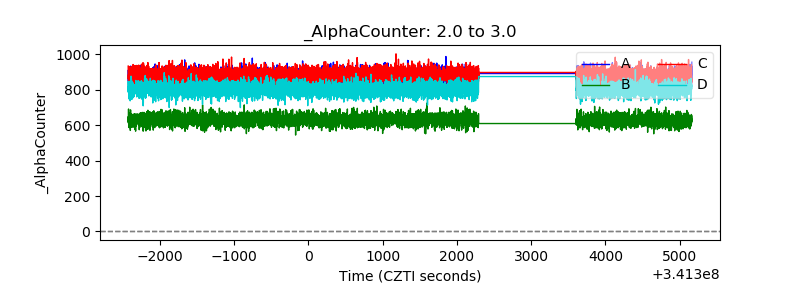 |
| _CPM_Rate | 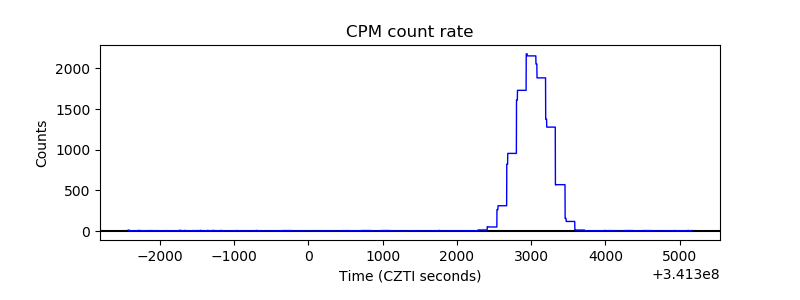 |
| CZT Counter | 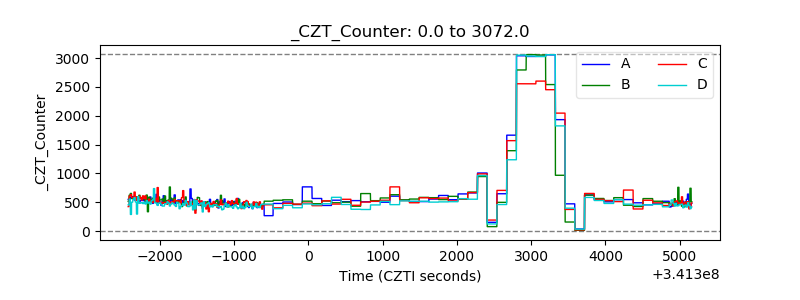 |
| +2.5 Volts monitor |  |
| +5 Volts monitor |  |
| _ROLL_ROT |  |
| _Roll_DEC | 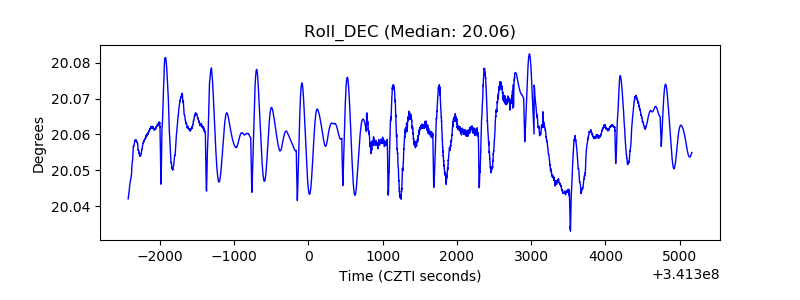 |
| _Roll_RA | 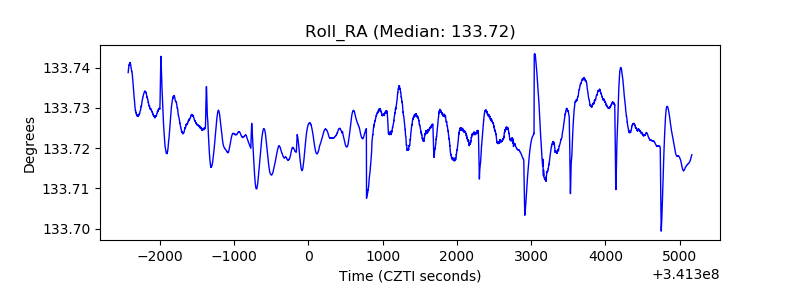 |
| Veto Counter |  |