| Param | Original file | Final file |
|---|---|---|
| Filename | modeM0/AS1T03_249T01_9000003934_27445cztM0_level2.evt | modeM0/AS1T03_249T01_9000003934_27445cztM0_level2_quad_clean.evt |
| Size (bytes) | 457,525,440 | 100,180,800 |
| Size | 436.3 MB | 95.5 MB |
| Events in quadrant A | 3,343,140 | 660,213 |
| Events in quadrant B | 3,394,187 | 666,920 |
| Events in quadrant C | 3,356,869 | 633,225 |
| Events in quadrant D | 3,325,323 | 625,302 |
| Mode M0 | |||
|---|---|---|---|
| Quadrant | BADHDUFLAG | Total packets | Discarded packets |
| A | 0 | 13507 | 0 |
| B | 0 | 13707 | 0 |
| C | 0 | 13616 | 0 |
| D | 0 | 13778 | 0 |
| Mode M9 | |||
|---|---|---|---|
| Quadrant | BADHDUFLAG | Total packets | Discarded packets |
| A | 0 | 12 | 0 |
| B | 0 | 13 | 0 |
| C | 0 | 13 | 0 |
| D | 0 | 13 | 0 |
| Quadrant | Total seconds | Saturated seconds | Saturation percentage |
|---|---|---|---|
| A | 6424 | 66 | 1.027397% |
| B | 6424 | 88 | 1.369863% |
| C | 6424 | 98 | 1.525529% |
| D | 6424 | 53 | 0.825031% |
Noise dominated data is calculated using 1-second bins in cleaned event files. If a bin has >2000 counts, and if more than 50% of those come from <1% of pixels, then it is considered to be noise-dominated and hence unusable.
| Quadrant | # 1 sec bins | Bins with >0 counts | Bins with >2000 counts | High rate bins dominated by noise | Noise dominated (total time) | Noise dominated (detector-on time) | Marked lightcurve |
|---|---|---|---|---|---|---|---|
| A | 7684 | 6424 | 0 | 0 | 0.00% | 0.00% | 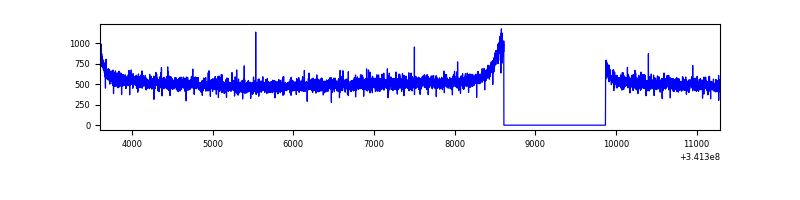 |
| B | 7684 | 6424 | 1 | 1 | 0.01% | 0.02% | 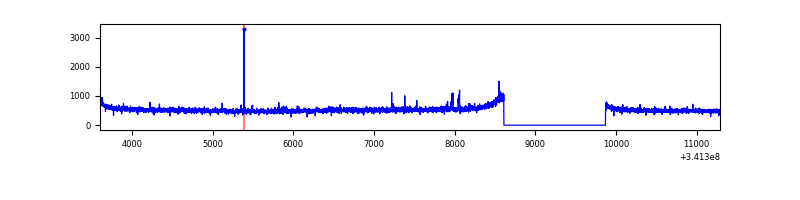 |
| C | 7684 | 6425 | 2 | 2 | 0.03% | 0.03% | 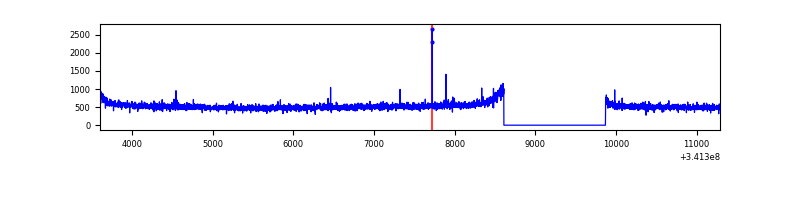 |
| D | 7684 | 6424 | 15 | 15 | 0.20% | 0.23% | 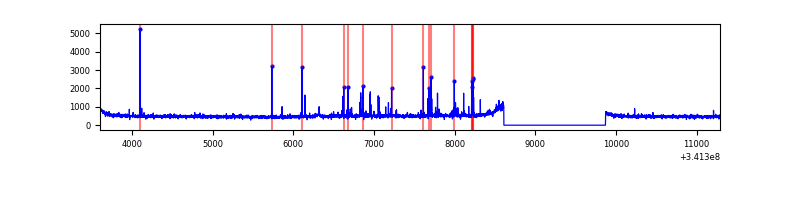 |
Top three noisy pixels from each quadrant. If the there are fewer than three noisy pixels in the level2.evt file, extra rows are filled as -1
| Pixel properties | Quadrant properties | ||||||
|---|---|---|---|---|---|---|---|
| Quadrant | DetID | PixID | Counts | Sigma | Mean | Median | Sigma |
| A | 13 | 254 | 11181 | 59.89 | 867 | 853 | 172.4 |
| A | 0 | 226 | 7595 | 39.1 | 867 | 853 | 172.4 |
| A | 3 | 137 | 7539 | 38.77 | 867 | 853 | 172.4 |
| B | 0 | 189 | 23654 | 142.96 | 852 | 833 | 159.6 |
| B | 12 | 111 | 18884 | 113.08 | 852 | 833 | 159.6 |
| B | 11 | 111 | 17218 | 102.64 | 852 | 833 | 159.6 |
| C | 14 | 238 | 134078 | 693.01 | 824 | 830 | 192.3 |
| C | 10 | 22 | 14186 | 69.46 | 824 | 830 | 192.3 |
| C | 13 | 61 | 5623 | 24.93 | 824 | 830 | 192.3 |
| D | 2 | 250 | 87485 | 438.78 | 835 | 816 | 197.5 |
| D | 1 | 52 | 62016 | 309.84 | 835 | 816 | 197.5 |
| D | 2 | 234 | 23641 | 115.56 | 835 | 816 | 197.5 |
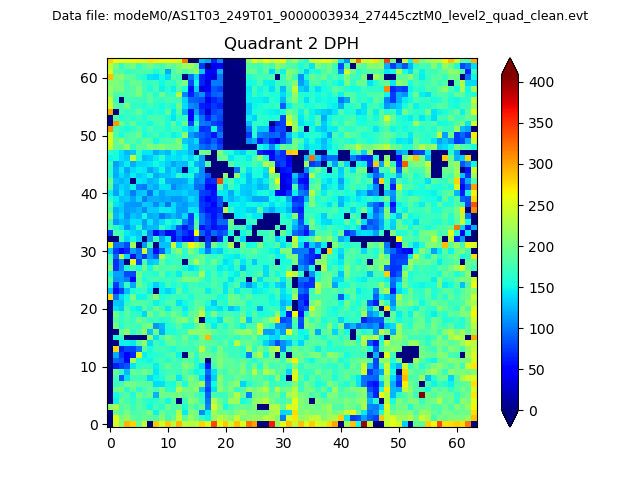
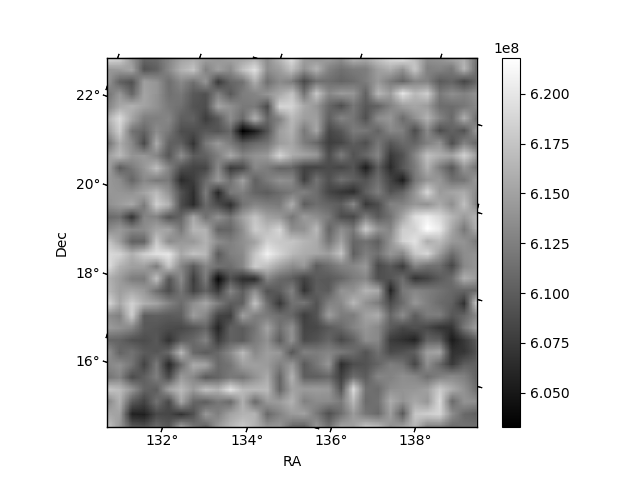
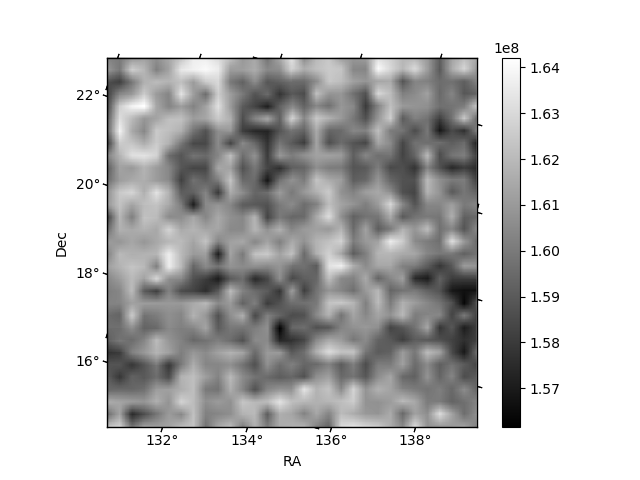
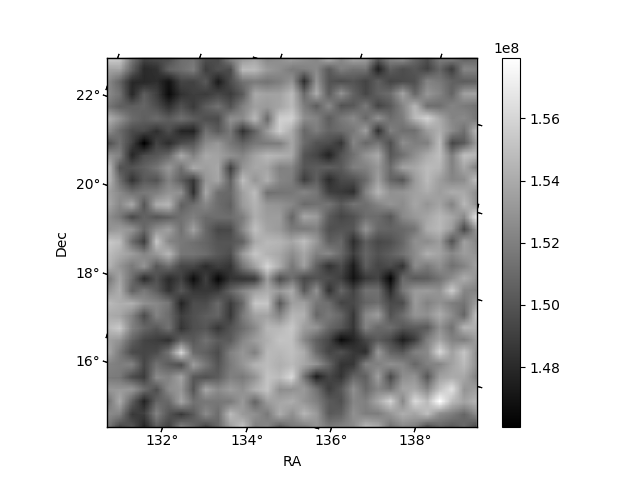
Histogram calculated using DETX and DETY for each event in the final _common_clean file
| Quadrant A | 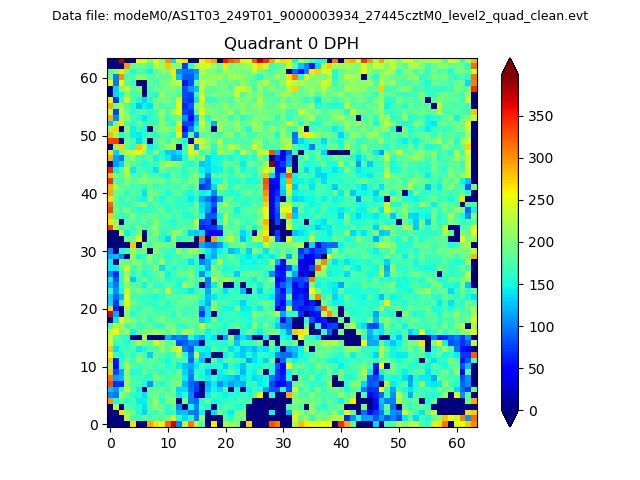 |
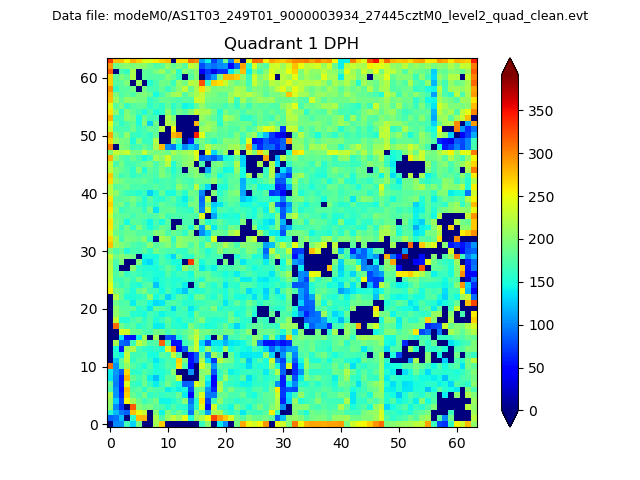 |
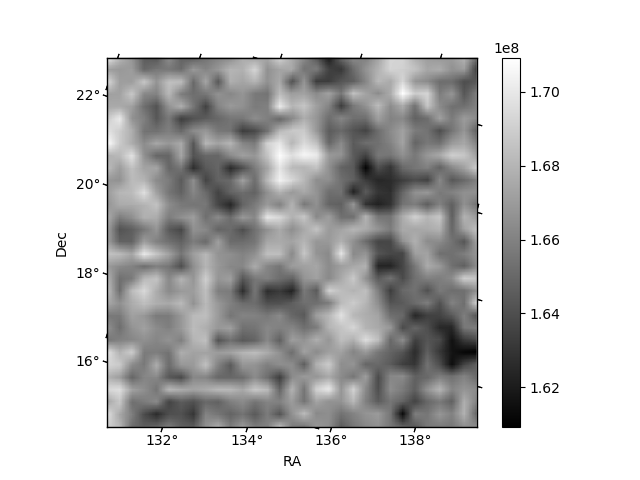
Quadrant B |
|---|---|---|---|
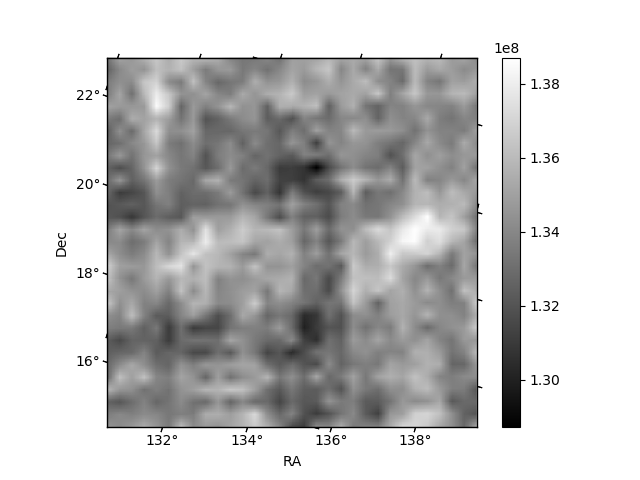
| Quadrant D | 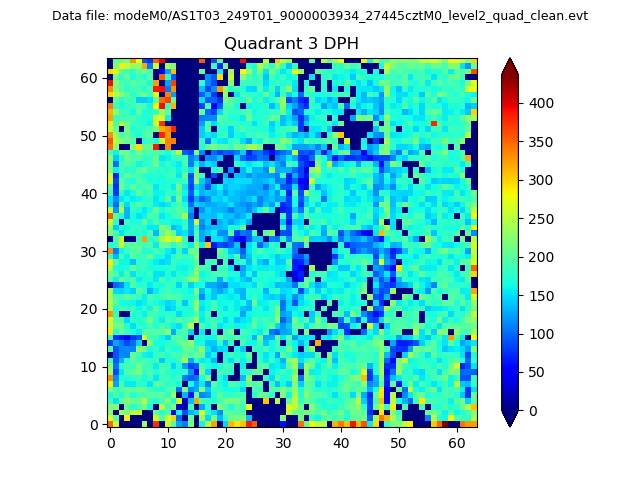 |
 |
Quadrant C |
| Plot type | Count rate plots | Images |
|---|---|---|
| Comparison with Poisson distribution Blue bars denote a histogram of data divided into 1 sec bins. Red curve is a Poisson curve with rate = median count rate of data. |
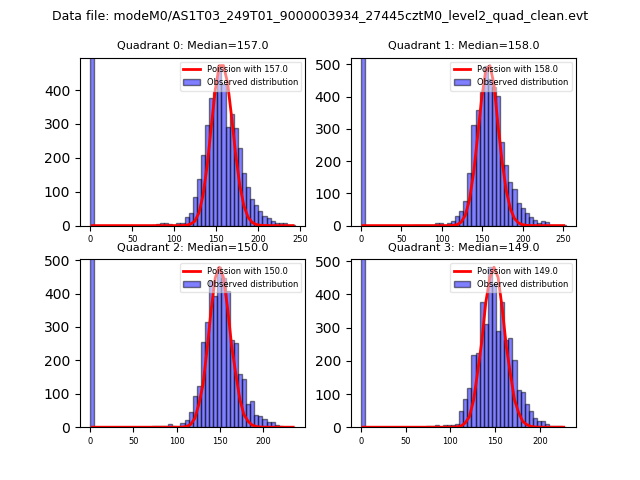 |
 |
| Quadrant-wise count rates Data is divided into 100 sec bins |
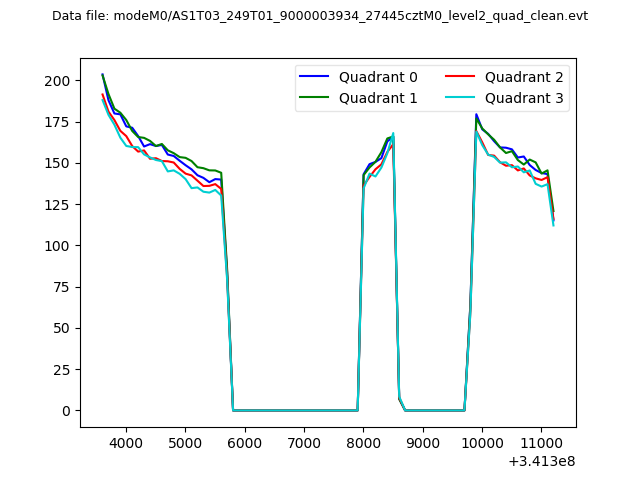 |
|
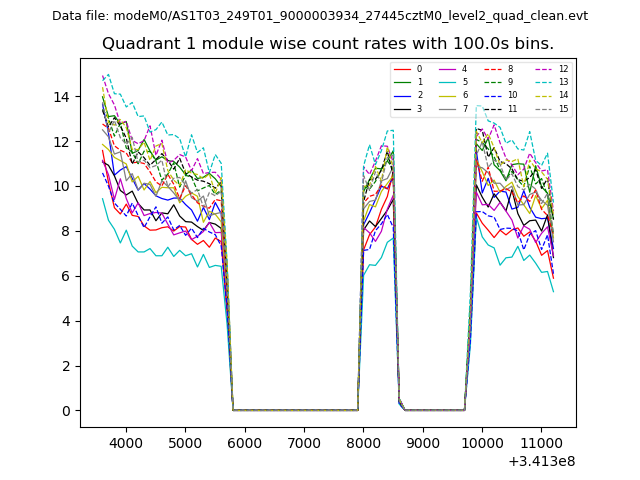
| Module-wise count rates for Quadrant A Data is divided into 100 sec bins |
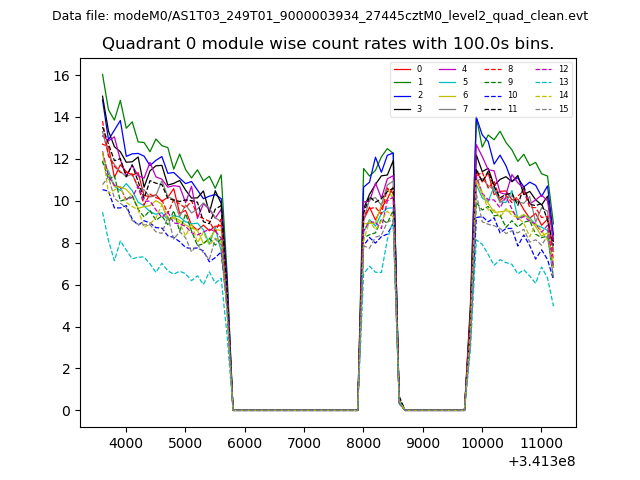 |
 |
| Module-wise count rates for Quadrant B Data is divided into 100 sec bins |
 |
 |
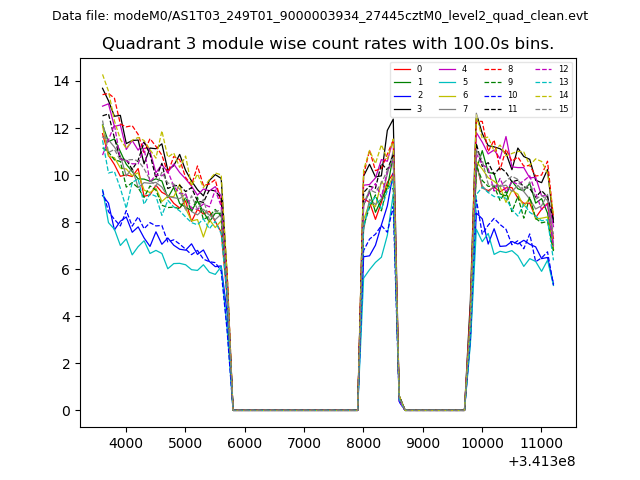
| Module-wise count rates for Quadrant C Data is divided into 100 sec bins |
 |
 |
| Module-wise count rates for Quadrant D Data is divided into 100 sec bins |
 |
 |
| Parameter | Plot |
|---|---|
| CZT HV Monitor | 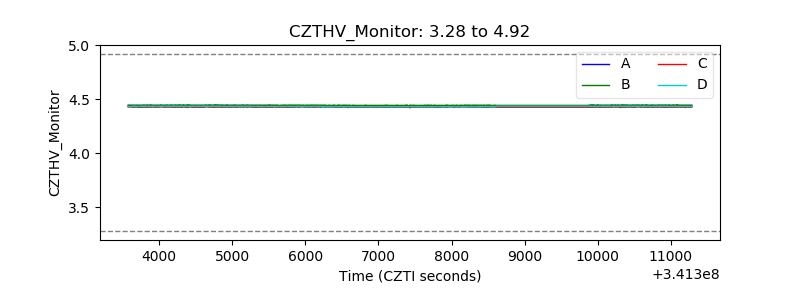 |
| D_VDD | 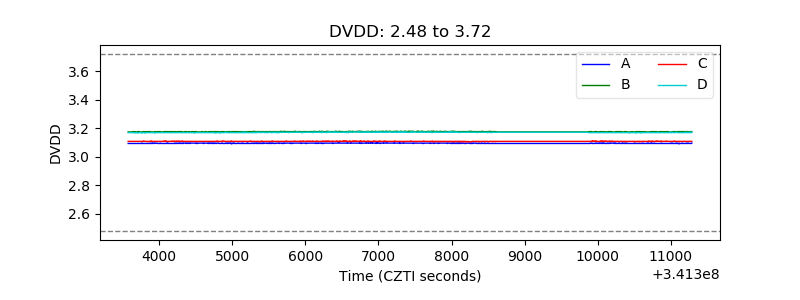 |
| Temperature 1 | 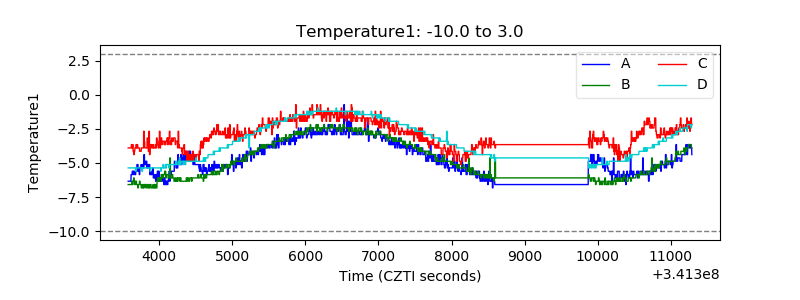 |
| Veto HV Monitor | 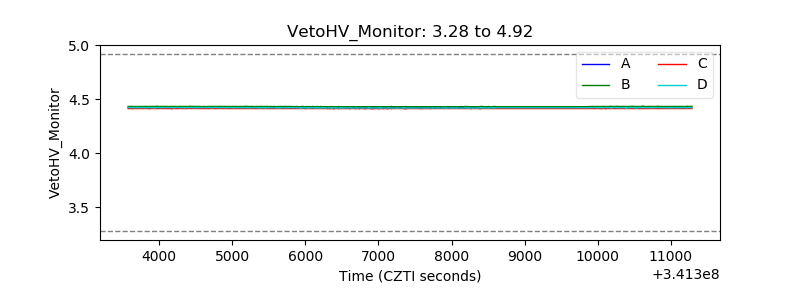 |
| Veto LLD | 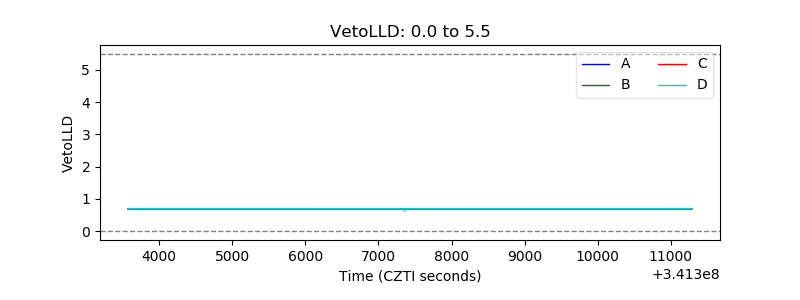 |
| Alpha Counter | 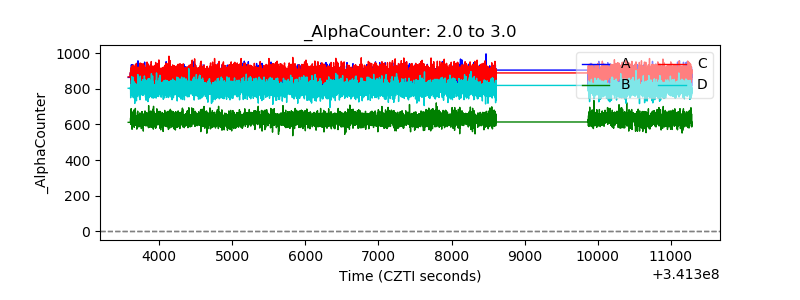 |
| _CPM_Rate | 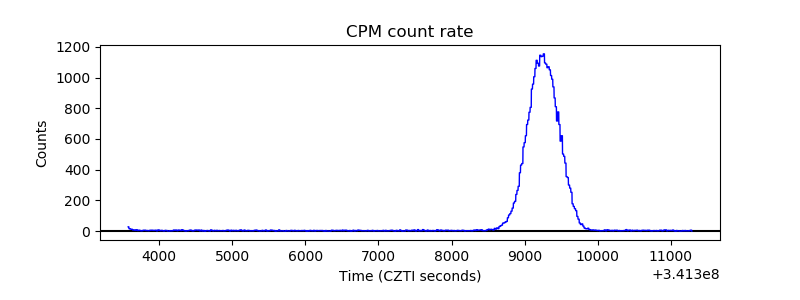 |
| CZT Counter | 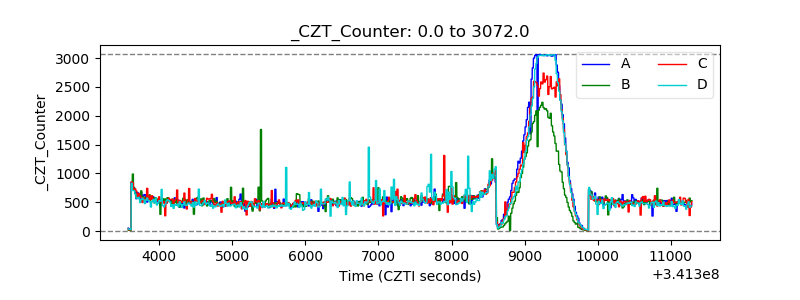 |
| +2.5 Volts monitor |  |
| +5 Volts monitor |  |
| _ROLL_ROT | 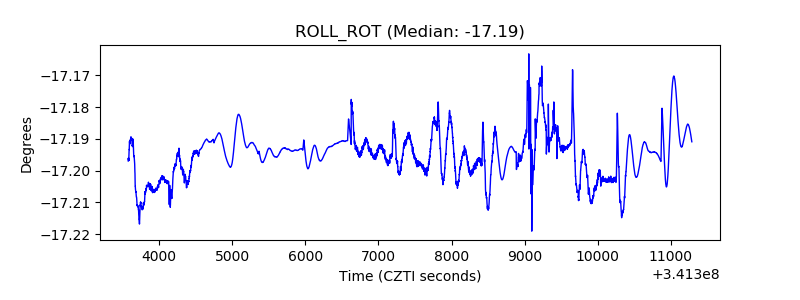 |
| _Roll_DEC | 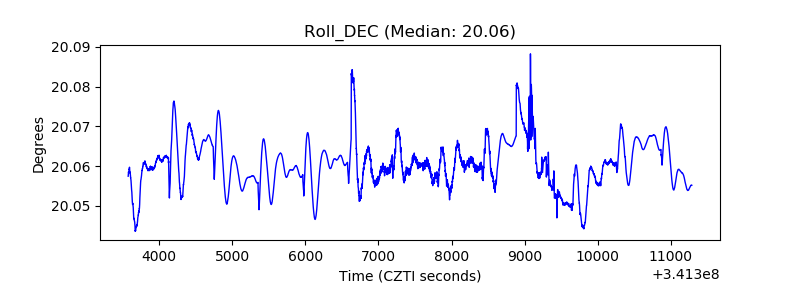 |
| _Roll_RA |  |
| Veto Counter | 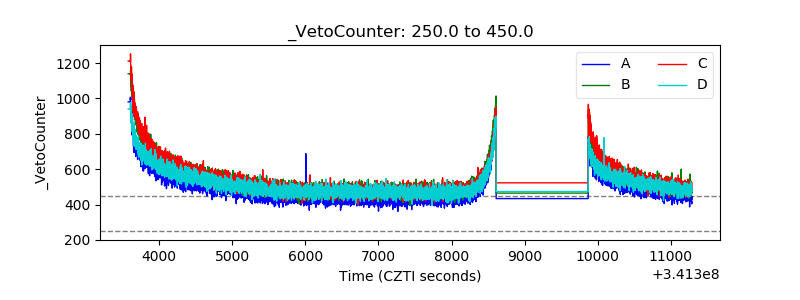 |