| Param | Original file | Final file |
|---|---|---|
| Filename | modeM0/AS1T03_249T01_9000003934_27446cztM0_level2.evt | modeM0/AS1T03_249T01_9000003934_27446cztM0_level2_quad_clean.evt |
| Size (bytes) | 423,063,360 | 87,192,000 |
| Size | 403.5 MB | 83.2 MB |
| Events in quadrant A | 3,079,462 | 564,617 |
| Events in quadrant B | 3,117,636 | 568,535 |
| Events in quadrant C | 3,107,186 | 542,830 |
| Events in quadrant D | 3,092,149 | 537,239 |
| Mode M0 | |||
|---|---|---|---|
| Quadrant | BADHDUFLAG | Total packets | Discarded packets |
| A | 0 | 12618 | 0 |
| B | 0 | 12761 | 0 |
| C | 0 | 12717 | 0 |
| D | 0 | 13022 | 0 |
| Mode M9 | |||
|---|---|---|---|
| Quadrant | BADHDUFLAG | Total packets | Discarded packets |
| A | 0 | 11 | 0 |
| B | 0 | 11 | 0 |
| C | 0 | 11 | 0 |
| D | 0 | 11 | 0 |
| Quadrant | Total seconds | Saturated seconds | Saturation percentage |
|---|---|---|---|
| A | 6121 | 69 | 1.127267% |
| B | 6122 | 60 | 0.980072% |
| C | 6122 | 87 | 1.421104% |
| D | 6122 | 47 | 0.767723% |
Noise dominated data is calculated using 1-second bins in cleaned event files. If a bin has >2000 counts, and if more than 50% of those come from <1% of pixels, then it is considered to be noise-dominated and hence unusable.
| Quadrant | # 1 sec bins | Bins with >0 counts | Bins with >2000 counts | High rate bins dominated by noise | Noise dominated (total time) | Noise dominated (detector-on time) | Marked lightcurve |
|---|---|---|---|---|---|---|---|
| A | 7221 | 6121 | 0 | 0 | 0.00% | 0.00% | 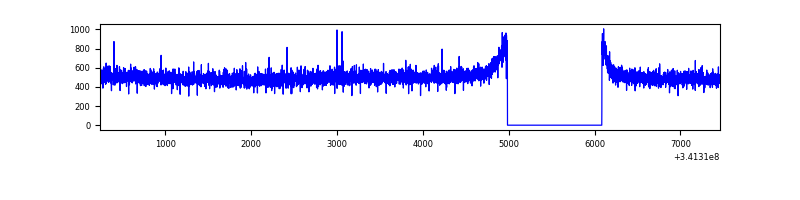 |
| B | 7222 | 6123 | 1 | 1 | 0.01% | 0.02% | 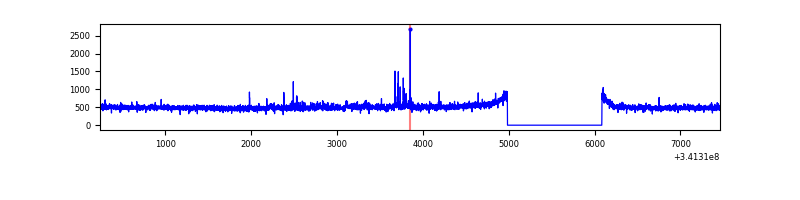 |
| C | 7222 | 6123 | 3 | 3 | 0.04% | 0.05% | 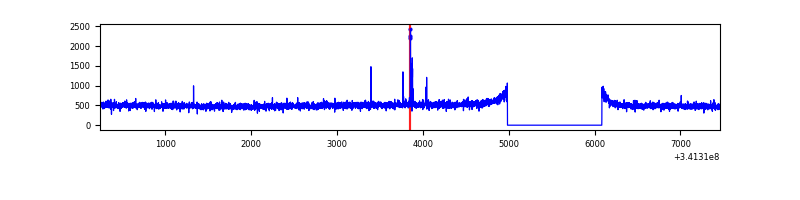 |
| D | 7222 | 6123 | 11 | 11 | 0.15% | 0.18% | 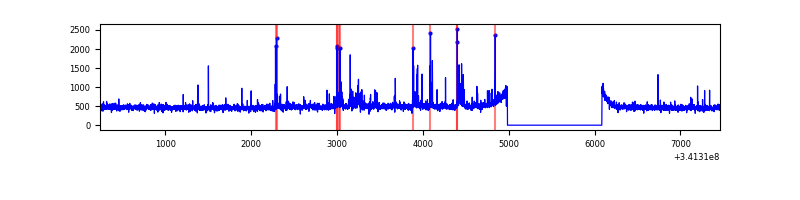 |
Top three noisy pixels from each quadrant. If the there are fewer than three noisy pixels in the level2.evt file, extra rows are filled as -1
| Pixel properties | Quadrant properties | ||||||
|---|---|---|---|---|---|---|---|
| Quadrant | DetID | PixID | Counts | Sigma | Mean | Median | Sigma |
| A | 13 | 254 | 10192 | 58.98 | 798 | 783 | 159.5 |
| A | 3 | 137 | 7279 | 40.72 | 798 | 783 | 159.5 |
| A | 0 | 226 | 6932 | 38.54 | 798 | 783 | 159.5 |
| B | 0 | 189 | 30791 | 202.53 | 782 | 762 | 148.3 |
| B | 12 | 111 | 18003 | 116.28 | 782 | 762 | 148.3 |
| B | 11 | 111 | 16484 | 106.04 | 782 | 762 | 148.3 |
| C | 14 | 238 | 122778 | 693.27 | 757 | 761 | 176.0 |
| C | 10 | 22 | 29475 | 163.15 | 757 | 761 | 176.0 |
| C | 4 | 224 | 6759 | 34.08 | 757 | 761 | 176.0 |
| D | 2 | 250 | 132597 | 726.56 | 771 | 753 | 181.5 |
| D | 1 | 52 | 31228 | 167.94 | 771 | 753 | 181.5 |
| D | 2 | 234 | 24287 | 129.69 | 771 | 753 | 181.5 |
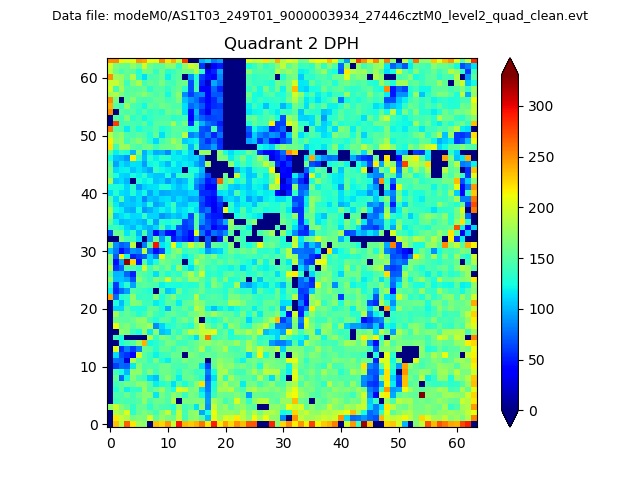
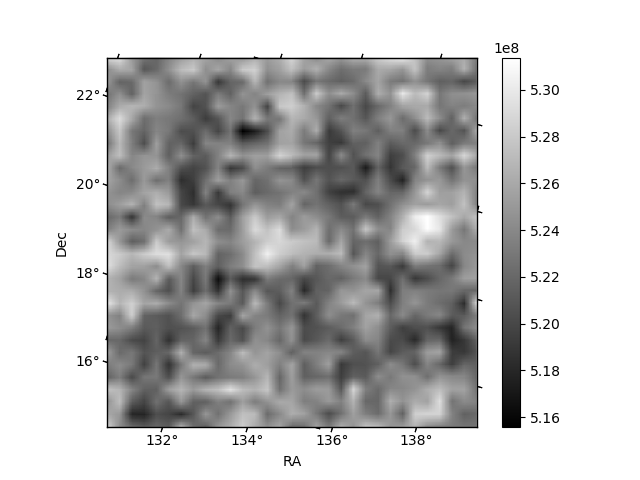
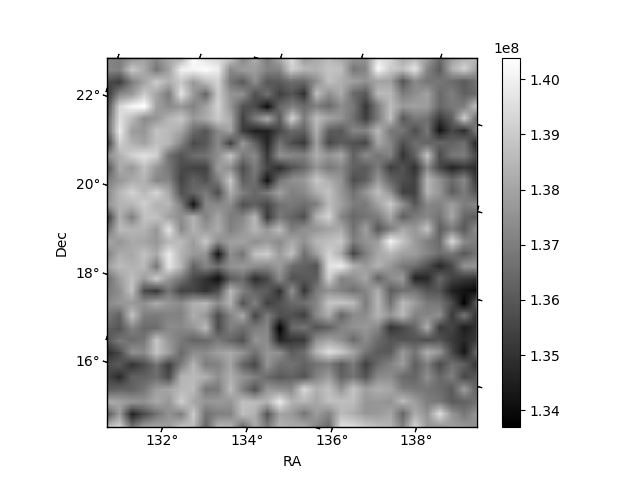
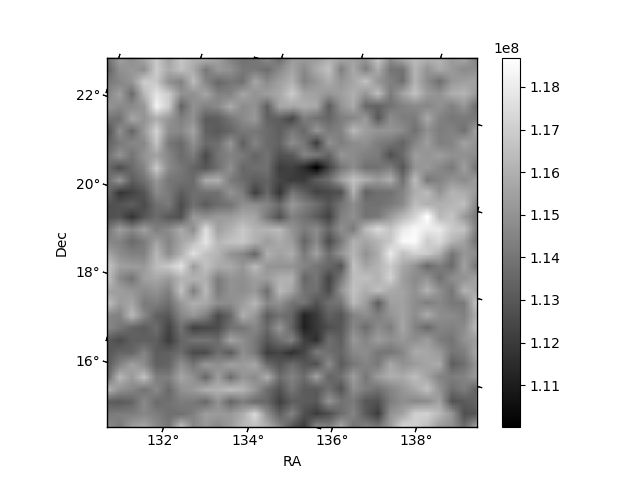
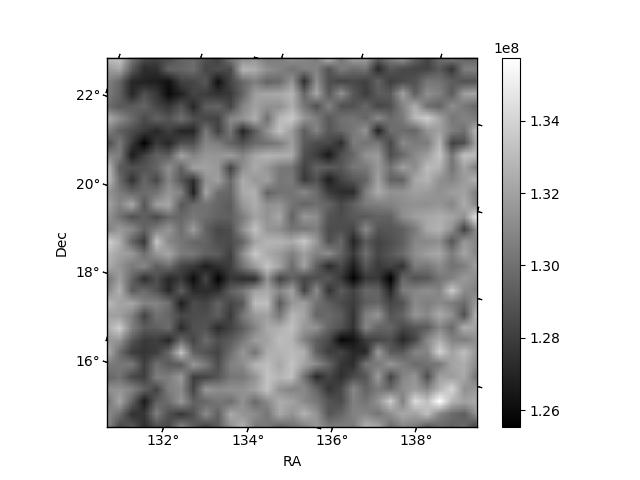
Histogram calculated using DETX and DETY for each event in the final _common_clean file
| Quadrant A | 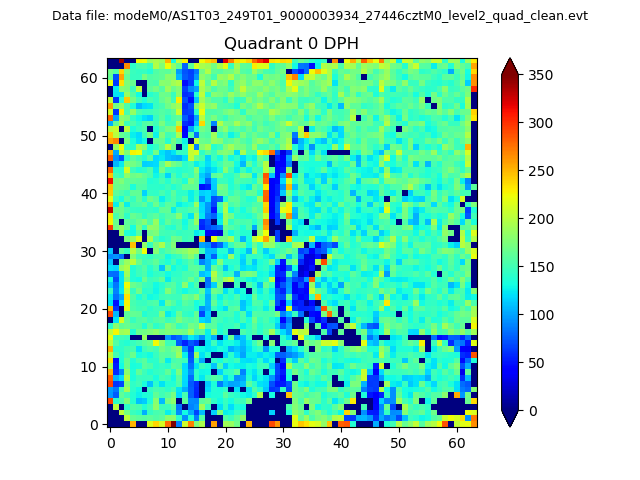 |
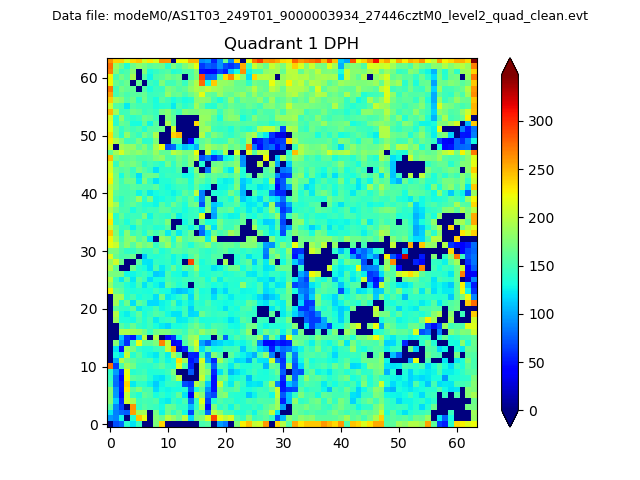 |
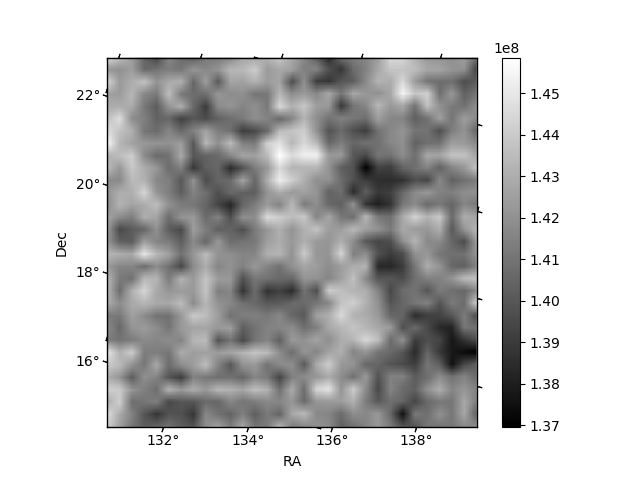
Quadrant B |
|---|---|---|---|
| Quadrant D | 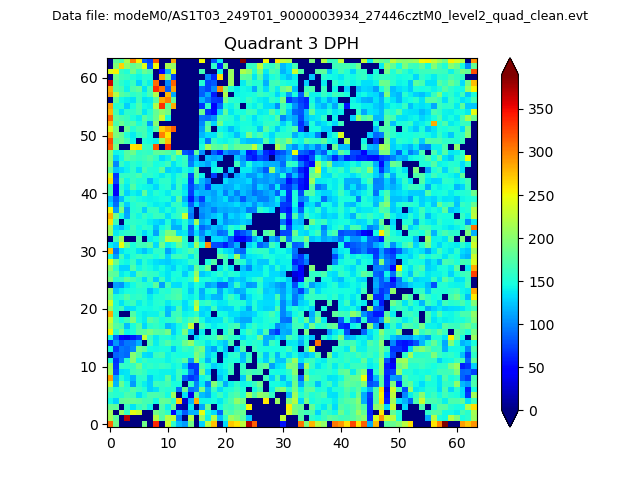 |
 |
Quadrant C |
| Plot type | Count rate plots | Images |
|---|---|---|
| Comparison with Poisson distribution Blue bars denote a histogram of data divided into 1 sec bins. Red curve is a Poisson curve with rate = median count rate of data. |
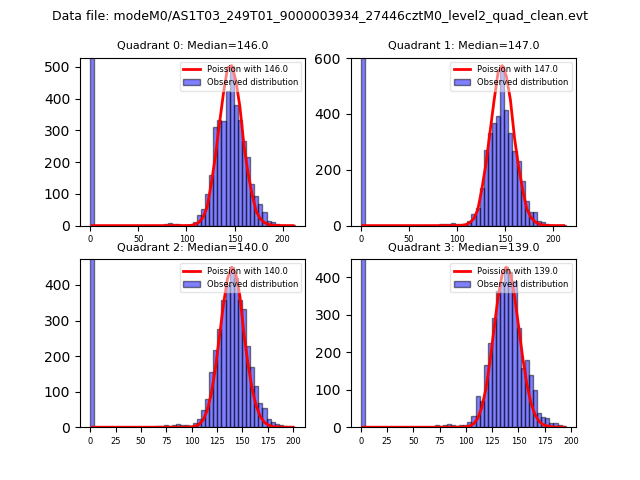 |
 |
| Quadrant-wise count rates Data is divided into 100 sec bins |
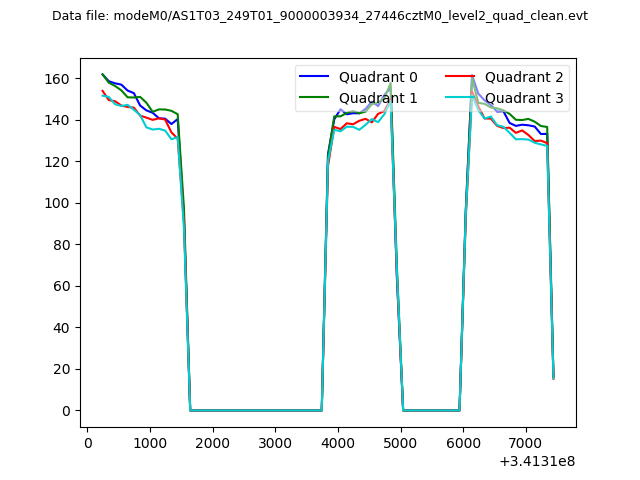 |
|
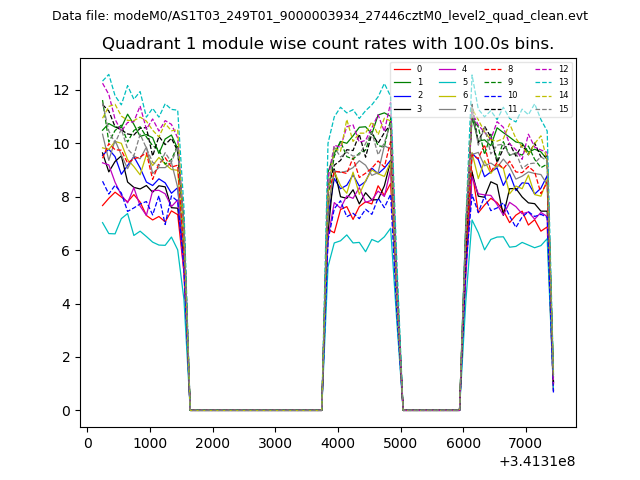
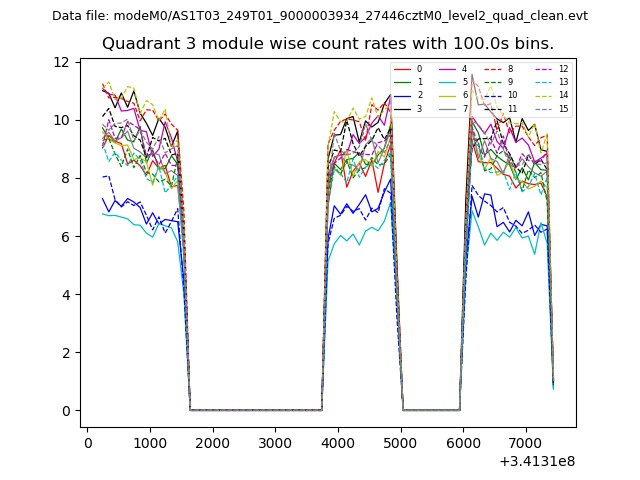
| Module-wise count rates for Quadrant A Data is divided into 100 sec bins |
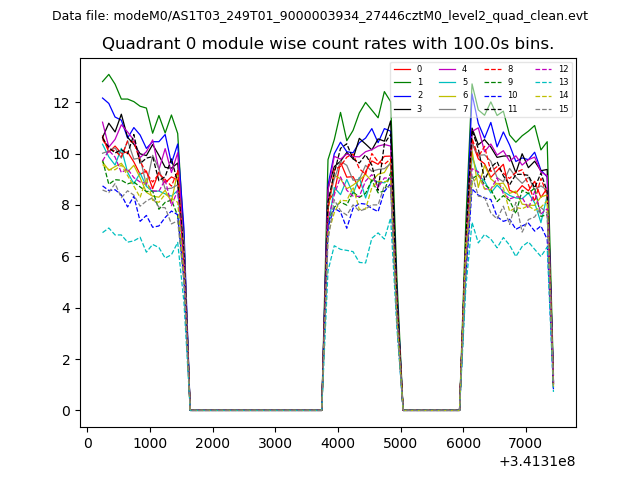 |
 |
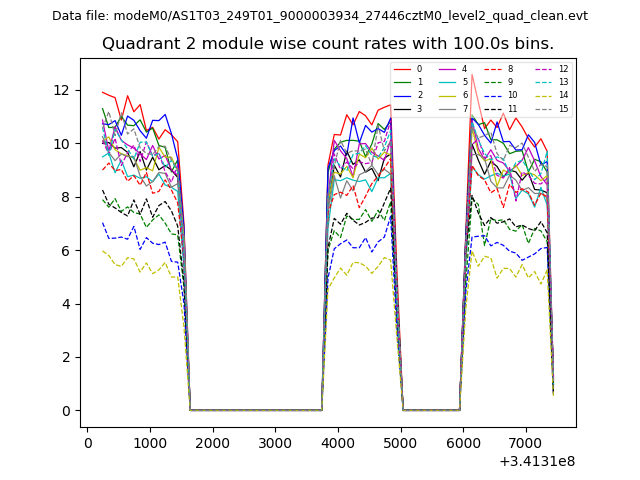
| Module-wise count rates for Quadrant B Data is divided into 100 sec bins |
 |
 |
| Module-wise count rates for Quadrant C Data is divided into 100 sec bins |
 |
 |
| Module-wise count rates for Quadrant D Data is divided into 100 sec bins |
 |
 |
| Parameter | Plot |
|---|---|
| CZT HV Monitor | 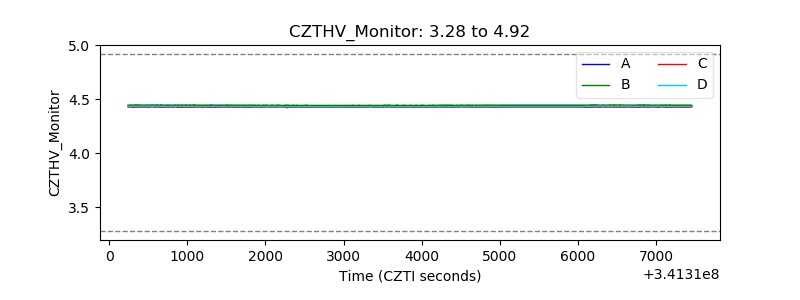 |
| D_VDD | 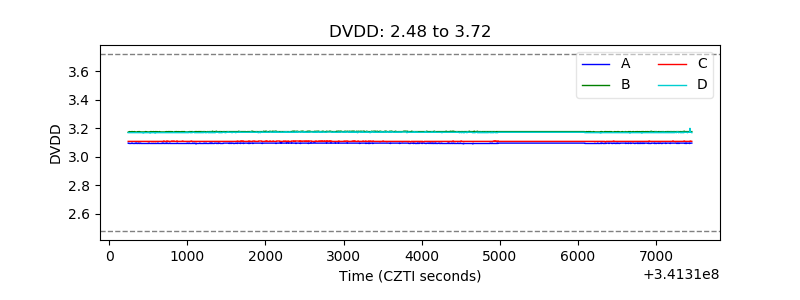 |
| Temperature 1 | 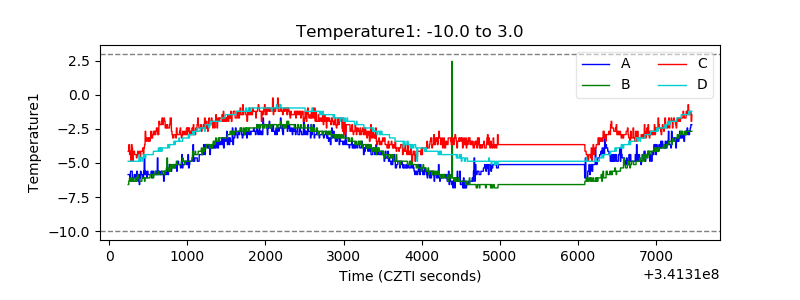 |
| Veto HV Monitor | 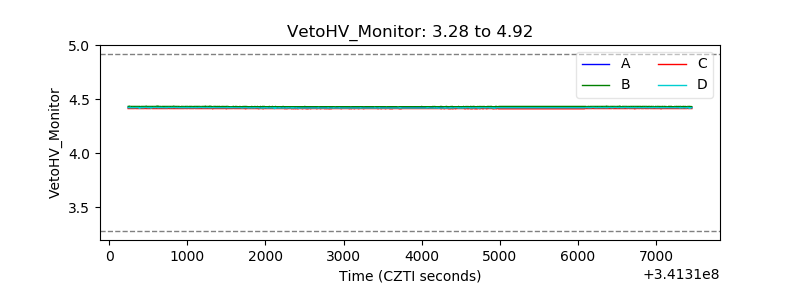 |
| Veto LLD | 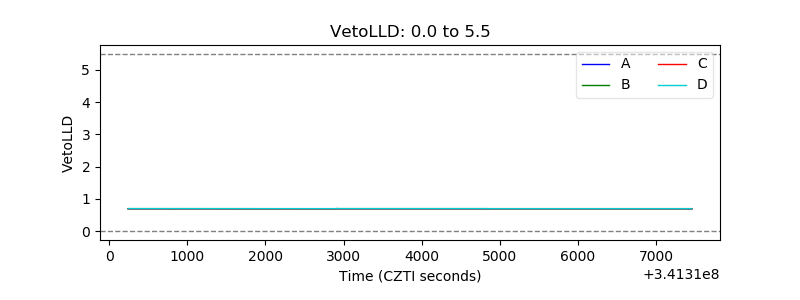 |
| Alpha Counter | 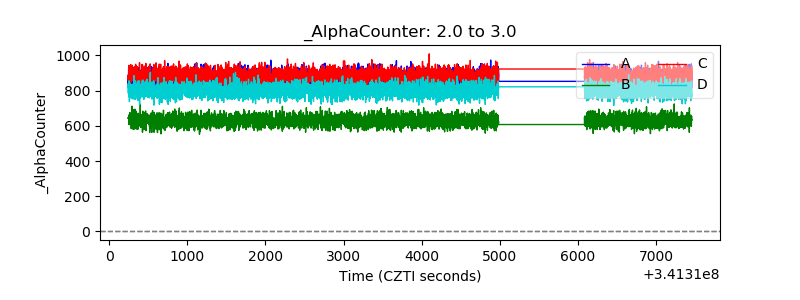 |
| _CPM_Rate | 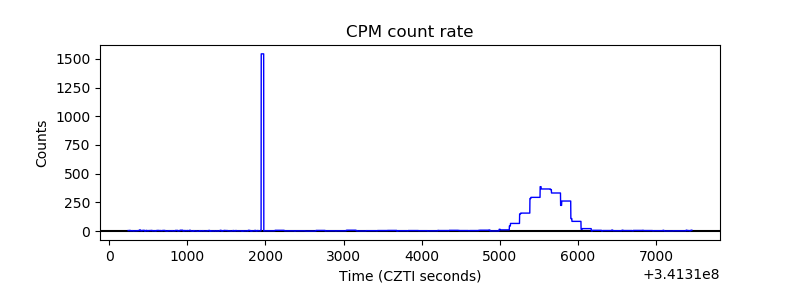 |
| CZT Counter | 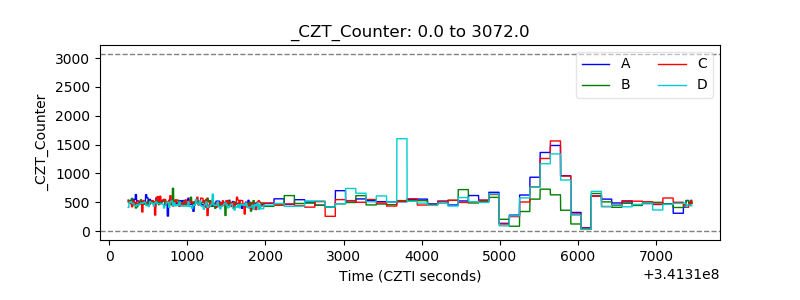 |
| +2.5 Volts monitor | 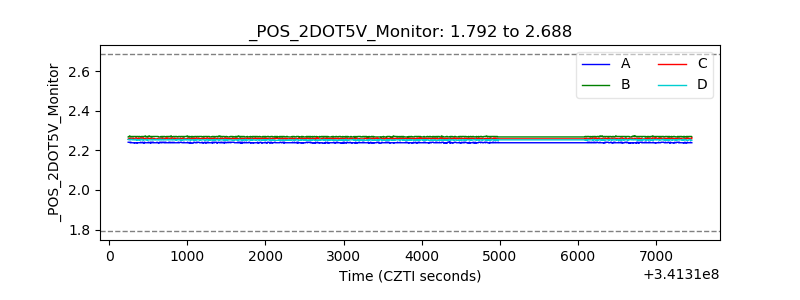 |
| +5 Volts monitor |  |
| _ROLL_ROT | 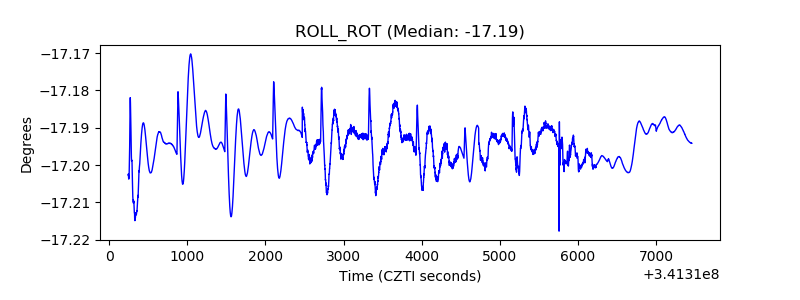 |
| _Roll_DEC |  |
| _Roll_RA | 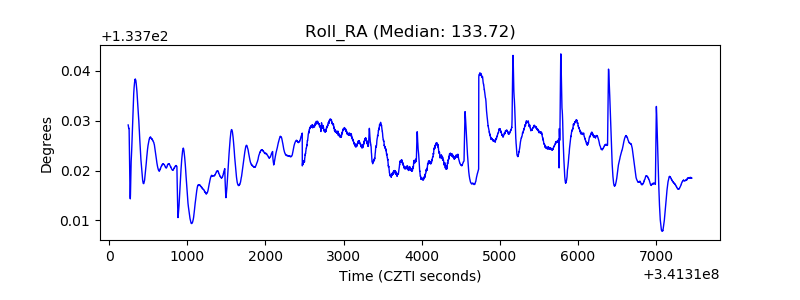 |
| Veto Counter | 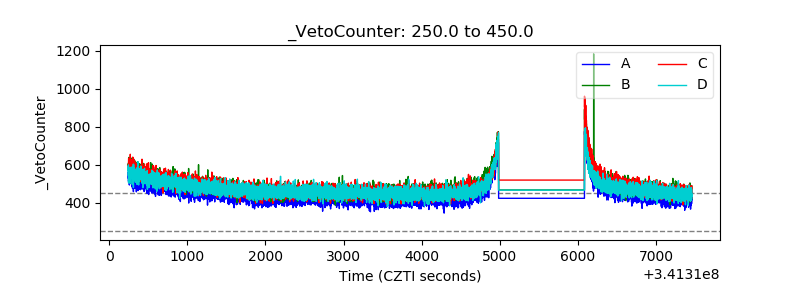 |