| Param | Original file | Final file |
|---|---|---|
| Filename | modeM0/AS1T03_249T01_9000003934_27447cztM0_level2.evt | modeM0/AS1T03_249T01_9000003934_27447cztM0_level2_quad_clean.evt |
| Size (bytes) | 444,121,920 | 80,674,560 |
| Size | 423.5 MB | 76.9 MB |
| Events in quadrant A | 3,142,054 | 508,750 |
| Events in quadrant B | 3,257,328 | 512,235 |
| Events in quadrant C | 3,187,561 | 489,573 |
| Events in quadrant D | 3,424,980 | 482,568 |
| Mode M0 | |||
|---|---|---|---|
| Quadrant | BADHDUFLAG | Total packets | Discarded packets |
| A | 0 | 13219 | 0 |
| B | 0 | 13366 | 0 |
| C | 0 | 13313 | 0 |
| D | 0 | 14418 | 0 |
| Mode M9 | |||
|---|---|---|---|
| Quadrant | BADHDUFLAG | Total packets | Discarded packets |
| A | 0 | 8 | 0 |
| B | 0 | 8 | 0 |
| C | 0 | 8 | 0 |
| D | 0 | 8 | 0 |
| Quadrant | Total seconds | Saturated seconds | Saturation percentage |
|---|---|---|---|
| A | 6450 | 107 | 1.658915% |
| B | 6451 | 112 | 1.736165% |
| C | 6451 | 130 | 2.015191% |
| D | 6450 | 99 | 1.534884% |
Noise dominated data is calculated using 1-second bins in cleaned event files. If a bin has >2000 counts, and if more than 50% of those come from <1% of pixels, then it is considered to be noise-dominated and hence unusable.
| Quadrant | # 1 sec bins | Bins with >0 counts | Bins with >2000 counts | High rate bins dominated by noise | Noise dominated (total time) | Noise dominated (detector-on time) | Marked lightcurve |
|---|---|---|---|---|---|---|---|
| A | 7200 | 6450 | 0 | 0 | 0.00% | 0.00% | 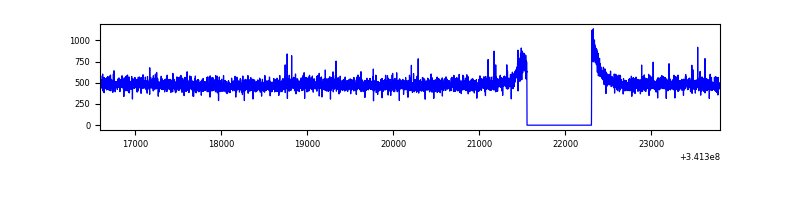 |
| B | 7201 | 6451 | 5 | 5 | 0.07% | 0.08% | 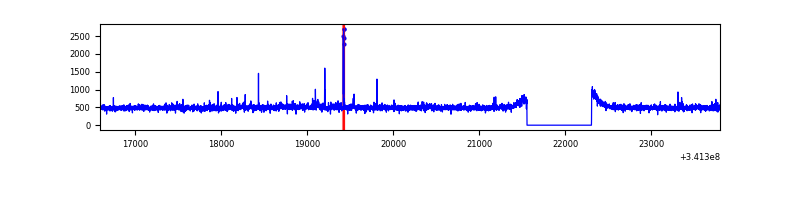 |
| C | 7201 | 6451 | 3 | 3 | 0.04% | 0.05% | 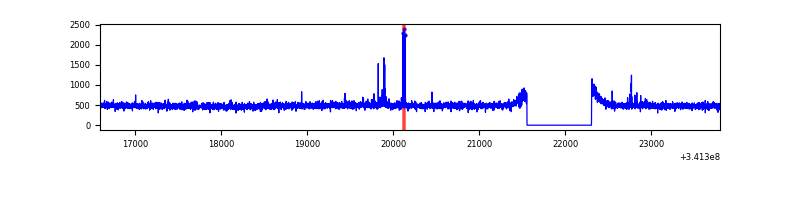 |
| D | 7200 | 6450 | 11 | 11 | 0.15% | 0.17% | 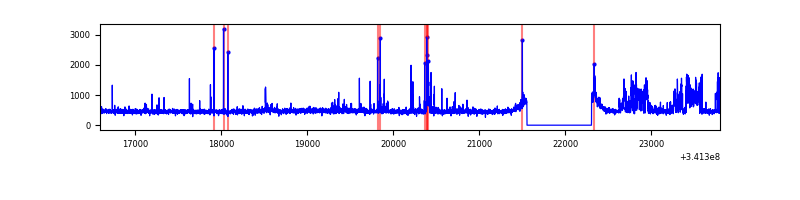 |
Top three noisy pixels from each quadrant. If the there are fewer than three noisy pixels in the level2.evt file, extra rows are filled as -1
| Pixel properties | Quadrant properties | ||||||
|---|---|---|---|---|---|---|---|
| Quadrant | DetID | PixID | Counts | Sigma | Mean | Median | Sigma |
| A | 13 | 254 | 11648 | 66.54 | 814 | 795 | 163.1 |
| A | 3 | 137 | 7561 | 41.48 | 814 | 795 | 163.1 |
| A | 0 | 226 | 7044 | 38.31 | 814 | 795 | 163.1 |
| B | 0 | 189 | 66998 | 425.22 | 800 | 777 | 155.7 |
| B | 0 | 190 | 29463 | 184.2 | 800 | 777 | 155.7 |
| B | 12 | 111 | 19002 | 117.03 | 800 | 777 | 155.7 |
| C | 14 | 238 | 123891 | 678.58 | 775 | 779 | 181.4 |
| C | 10 | 22 | 37191 | 200.7 | 775 | 779 | 181.4 |
| C | 13 | 61 | 5412 | 25.54 | 775 | 779 | 181.4 |
| D | 1 | 52 | 307462 | 1621.26 | 788 | 766 | 189.2 |
| D | 2 | 250 | 96192 | 504.44 | 788 | 766 | 189.2 |
| D | 2 | 234 | 25204 | 129.18 | 788 | 766 | 189.2 |
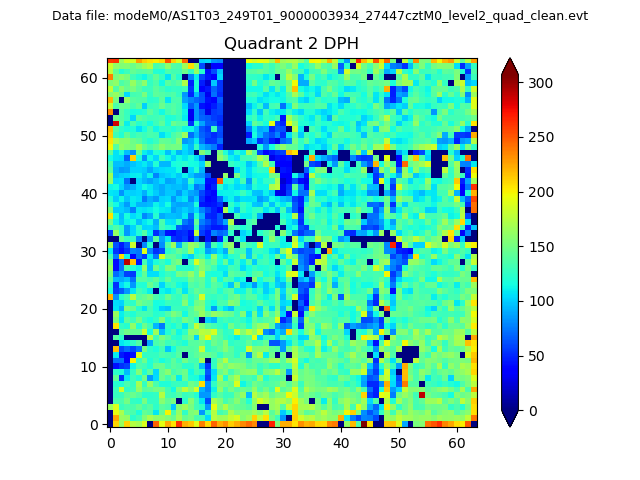
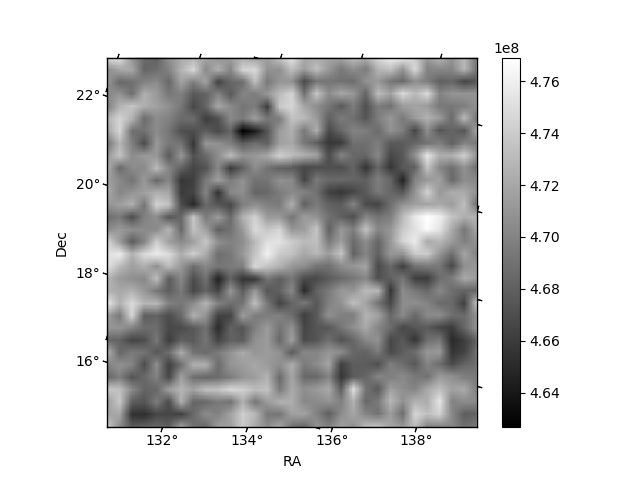
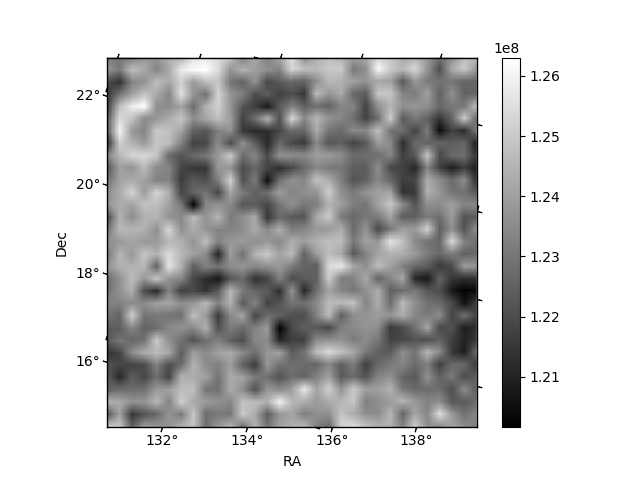
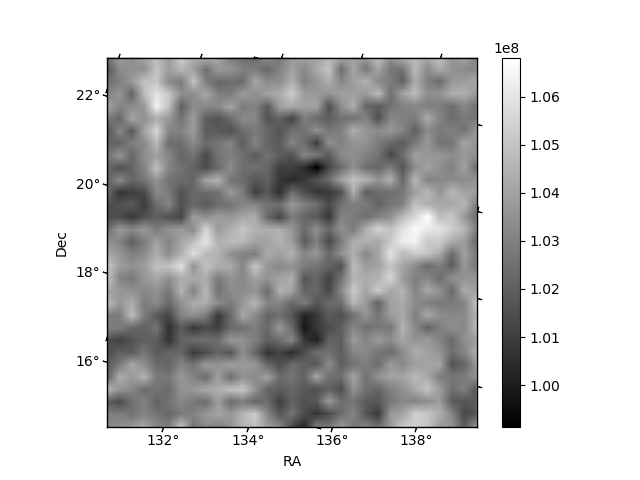
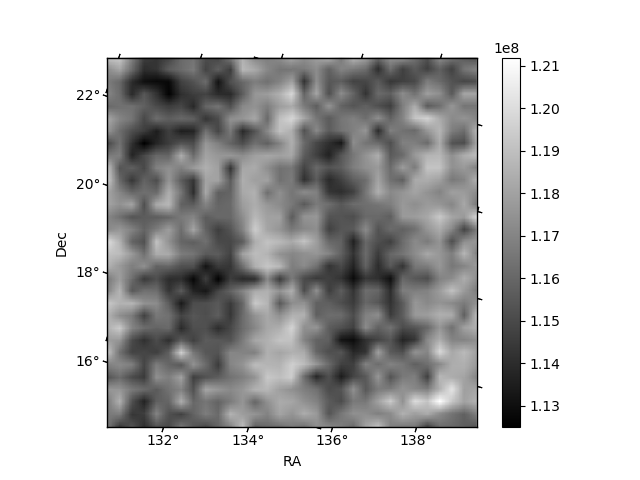
Histogram calculated using DETX and DETY for each event in the final _common_clean file
| Quadrant A | 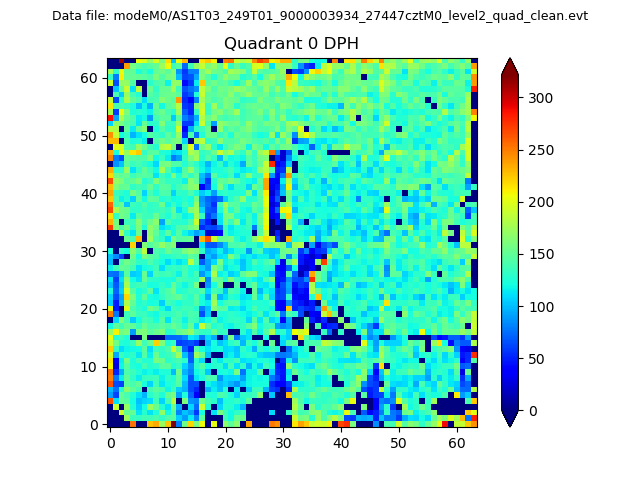 |
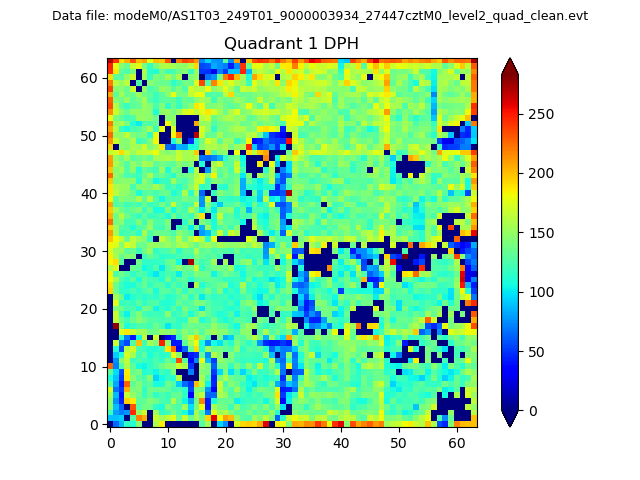 |
Quadrant B |
|---|---|---|---|
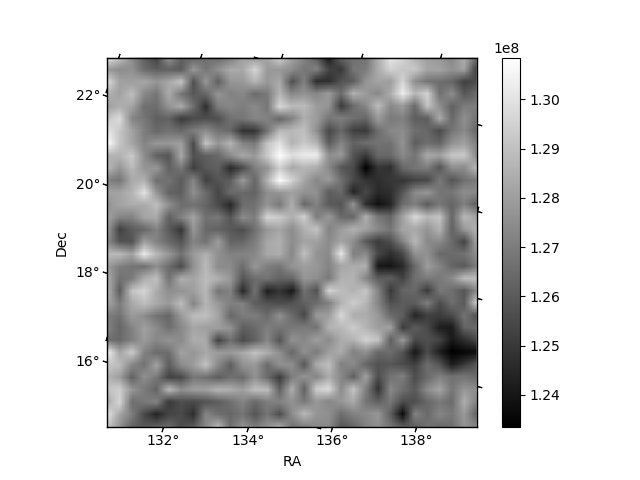
| Quadrant D | 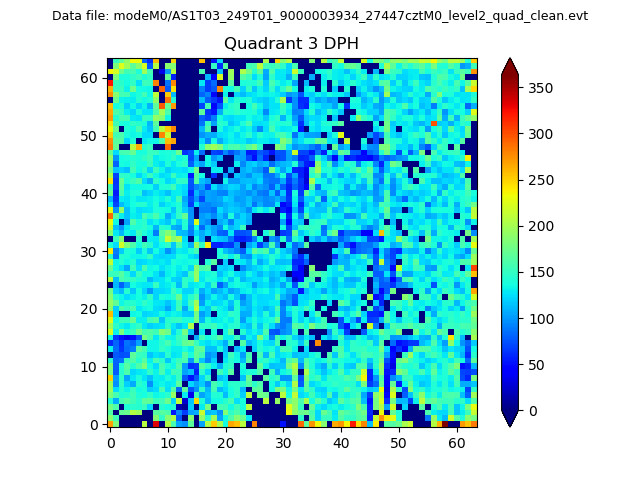 |
 |
Quadrant C |
| Plot type | Count rate plots | Images |
|---|---|---|
| Comparison with Poisson distribution Blue bars denote a histogram of data divided into 1 sec bins. Red curve is a Poisson curve with rate = median count rate of data. |
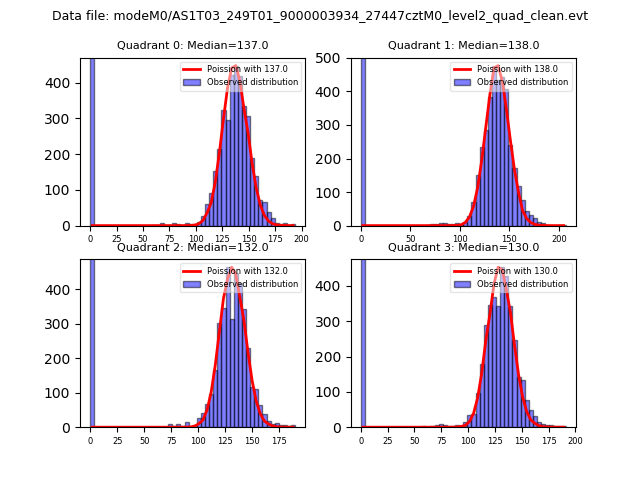 |
 |
| Quadrant-wise count rates Data is divided into 100 sec bins |
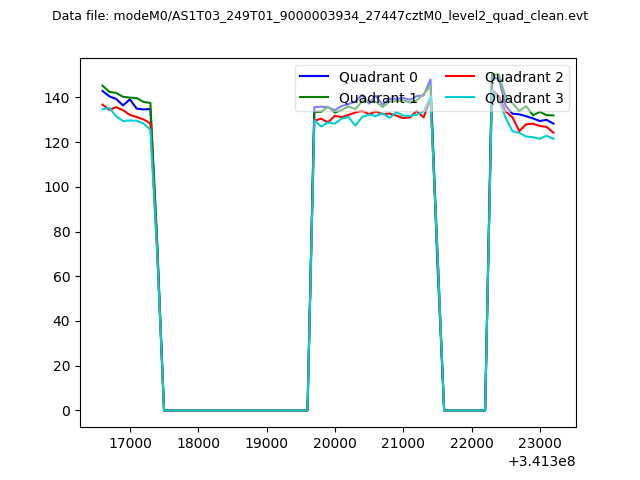 |
|
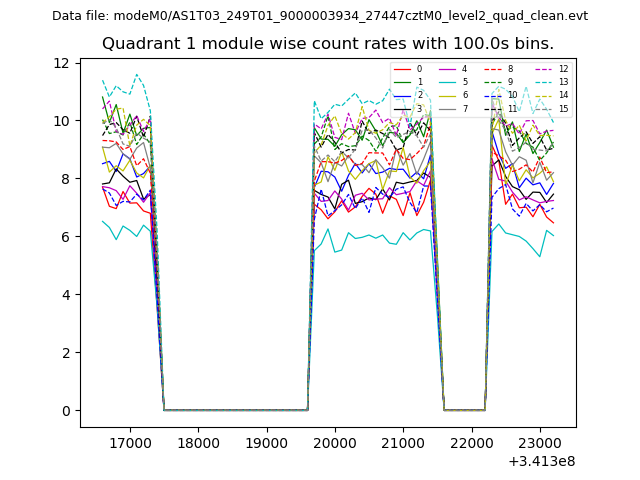
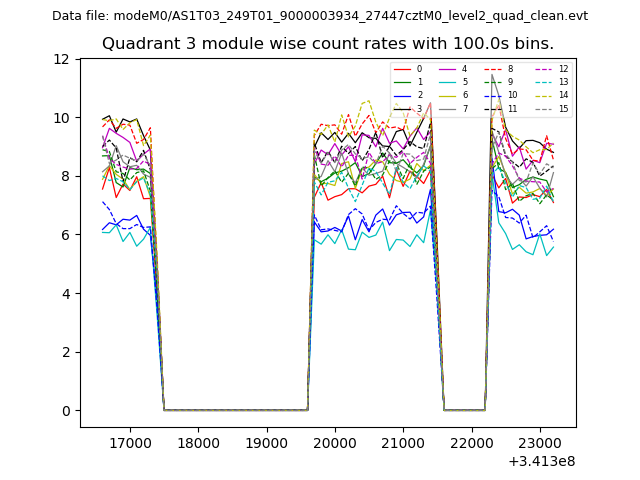
| Module-wise count rates for Quadrant A Data is divided into 100 sec bins |
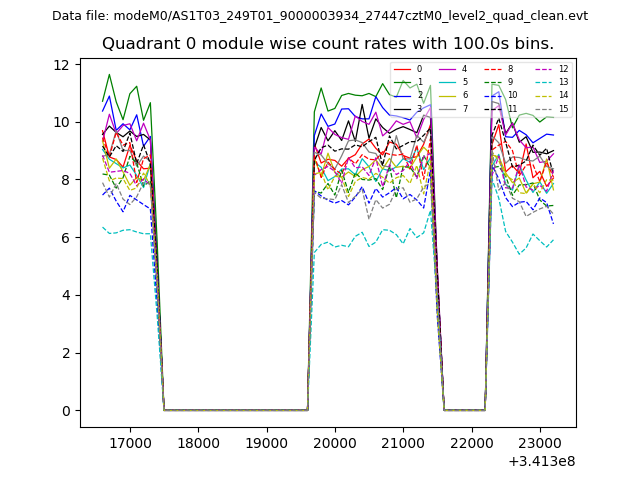 |
 |
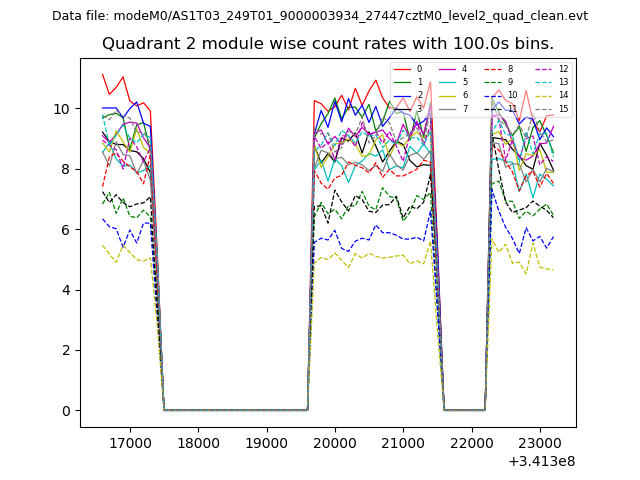
| Module-wise count rates for Quadrant B Data is divided into 100 sec bins |
 |
 |
| Module-wise count rates for Quadrant C Data is divided into 100 sec bins |
 |
 |
| Module-wise count rates for Quadrant D Data is divided into 100 sec bins |
 |
 |
| Parameter | Plot |
|---|---|
| CZT HV Monitor |  |
| D_VDD | 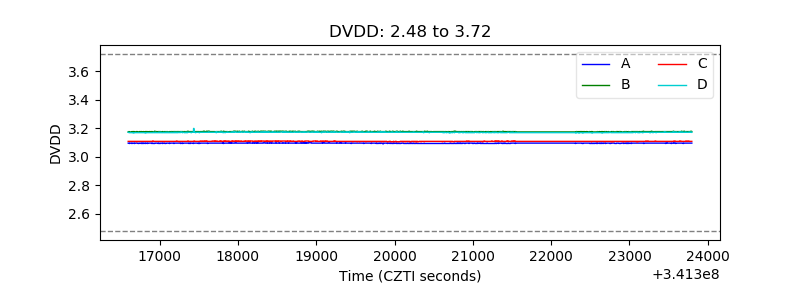 |
| Temperature 1 | 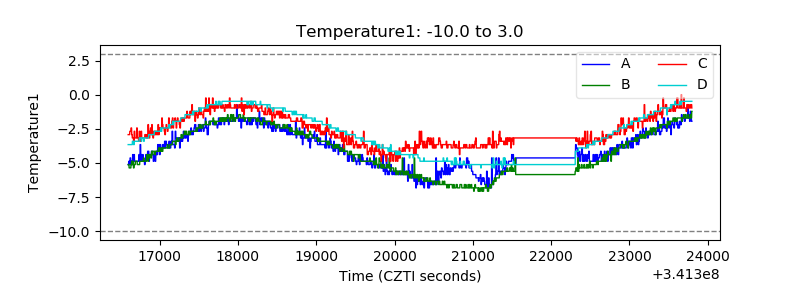 |
| Veto HV Monitor | 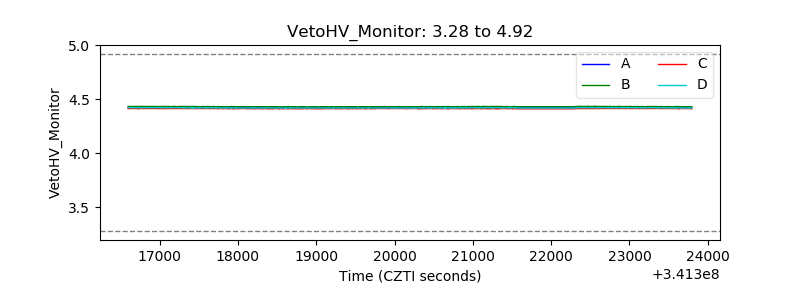 |
| Veto LLD | 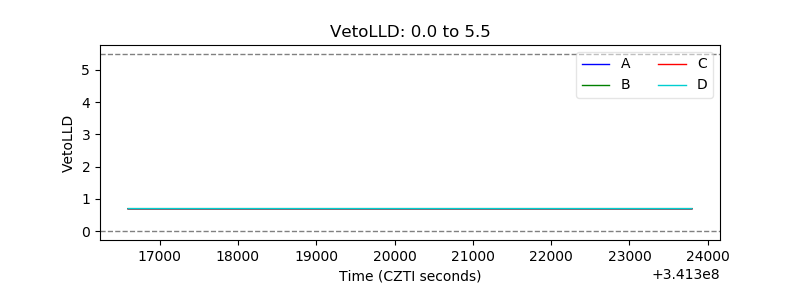 |
| Alpha Counter | 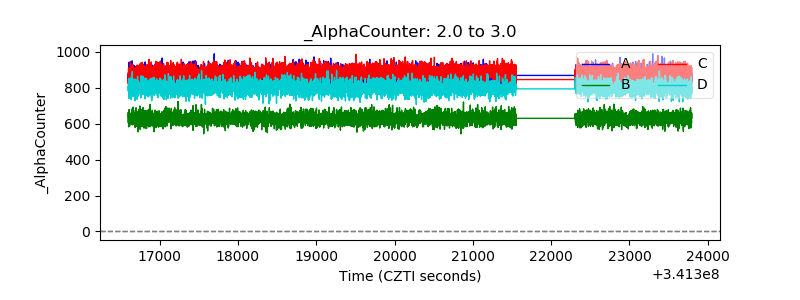 |
| _CPM_Rate | 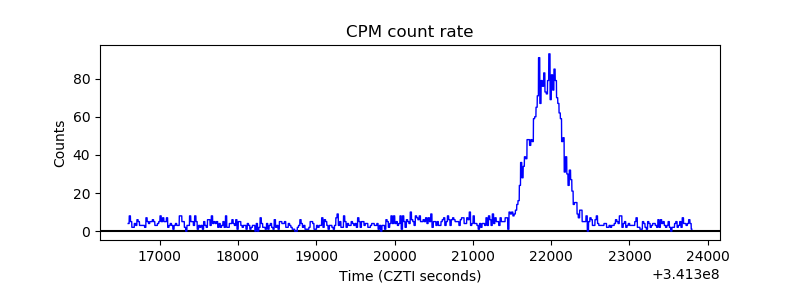 |
| CZT Counter | 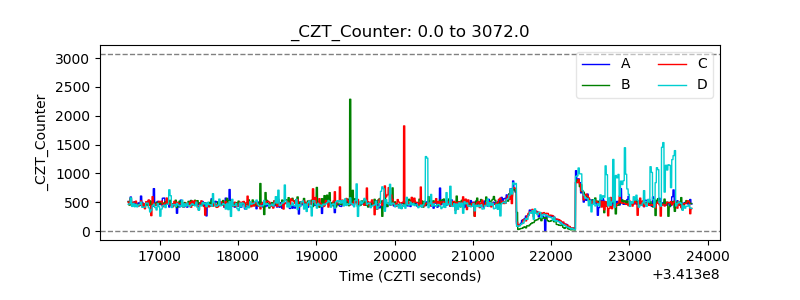 |
| +2.5 Volts monitor | 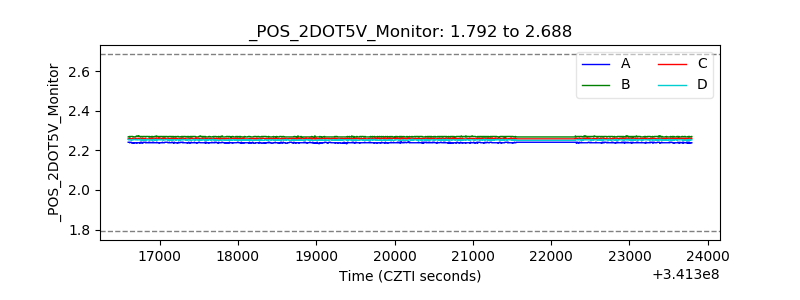 |
| +5 Volts monitor |  |
| _ROLL_ROT | 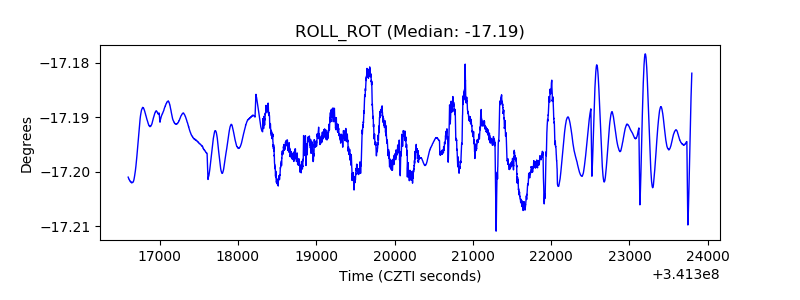 |
| _Roll_DEC | 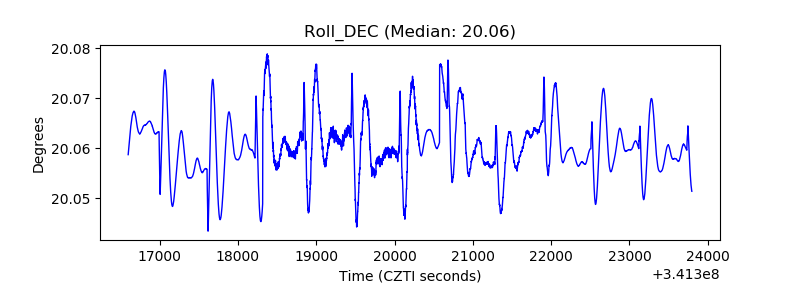 |
| _Roll_RA |  |
| Veto Counter |  |