| Param | Original file | Final file |
|---|---|---|
| Filename | modeM0/AS1T03_249T01_9000003934_27448cztM0_level2.evt | modeM0/AS1T03_249T01_9000003934_27448cztM0_level2_quad_clean.evt |
| Size (bytes) | 530,922,240 | 91,111,680 |
| Size | 506.3 MB | 86.9 MB |
| Events in quadrant A | 3,664,455 | 573,533 |
| Events in quadrant B | 3,797,130 | 573,312 |
| Events in quadrant C | 3,675,974 | 548,060 |
| Events in quadrant D | 4,437,813 | 547,568 |
| Mode M0 | |||
|---|---|---|---|
| Quadrant | BADHDUFLAG | Total packets | Discarded packets |
| A | 0 | 15511 | 0 |
| B | 0 | 15655 | 0 |
| C | 0 | 15502 | 0 |
| D | 0 | 18233 | 0 |
| Mode M9 | |||
|---|---|---|---|
| Quadrant | BADHDUFLAG | Total packets | Discarded packets |
| A | 0 | 4 | 0 |
| B | 0 | 5 | 0 |
| C | 0 | 5 | 0 |
| D | 0 | 5 | 0 |
| Quadrant | Total seconds | Saturated seconds | Saturation percentage |
|---|---|---|---|
| A | 7420 | 204 | 2.749326% |
| B | 7420 | 238 | 3.207547% |
| C | 7420 | 264 | 3.557951% |
| D | 7419 | 228 | 3.073190% |
Noise dominated data is calculated using 1-second bins in cleaned event files. If a bin has >2000 counts, and if more than 50% of those come from <1% of pixels, then it is considered to be noise-dominated and hence unusable.
| Quadrant | # 1 sec bins | Bins with >0 counts | Bins with >2000 counts | High rate bins dominated by noise | Noise dominated (total time) | Noise dominated (detector-on time) | Marked lightcurve |
|---|---|---|---|---|---|---|---|
| A | 7755 | 7420 | 0 | 0 | 0.00% | 0.00% | 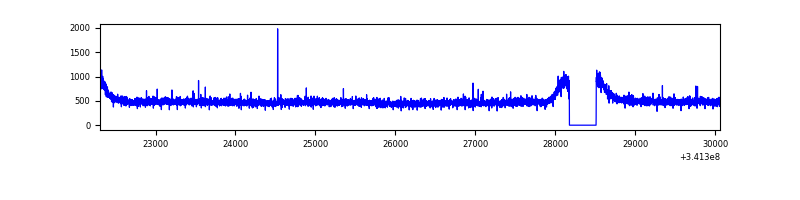 |
| B | 7755 | 7420 | 5 | 5 | 0.06% | 0.07% | 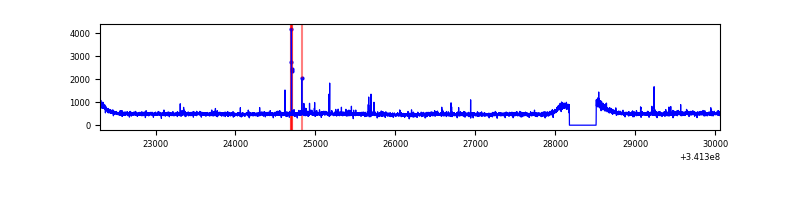 |
| C | 7755 | 7420 | 1 | 1 | 0.01% | 0.01% | 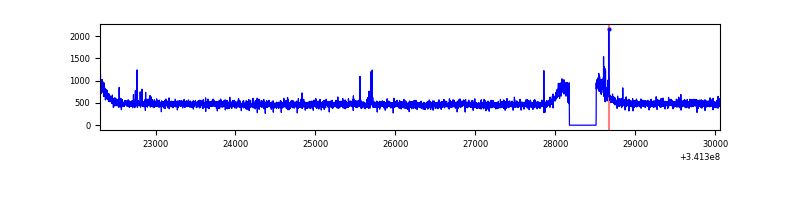 |
| D | 7754 | 7419 | 51 | 51 | 0.66% | 0.69% | 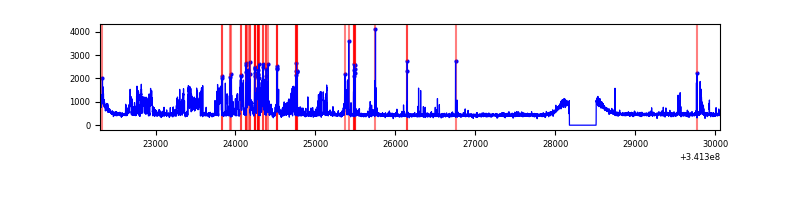 |
Top three noisy pixels from each quadrant. If the there are fewer than three noisy pixels in the level2.evt file, extra rows are filled as -1
| Pixel properties | Quadrant properties | ||||||
|---|---|---|---|---|---|---|---|
| Quadrant | DetID | PixID | Counts | Sigma | Mean | Median | Sigma |
| A | 13 | 254 | 13589 | 65.86 | 948 | 926 | 192.3 |
| A | 3 | 137 | 9271 | 43.4 | 948 | 926 | 192.3 |
| A | 0 | 226 | 8145 | 37.54 | 948 | 926 | 192.3 |
| B | 0 | 189 | 74349 | 405.16 | 930 | 905 | 181.3 |
| B | 0 | 230 | 25044 | 133.16 | 930 | 905 | 181.3 |
| B | 12 | 111 | 22603 | 119.7 | 930 | 905 | 181.3 |
| C | 14 | 238 | 141205 | 661.23 | 900 | 905 | 212.2 |
| C | 10 | 22 | 24546 | 111.42 | 900 | 905 | 212.2 |
| C | 13 | 61 | 6209 | 25.0 | 900 | 905 | 212.2 |
| D | 1 | 52 | 766758 | 3453.67 | 919 | 896 | 221.8 |
| D | 2 | 250 | 183552 | 823.69 | 919 | 896 | 221.8 |
| D | 2 | 234 | 30144 | 131.89 | 919 | 896 | 221.8 |
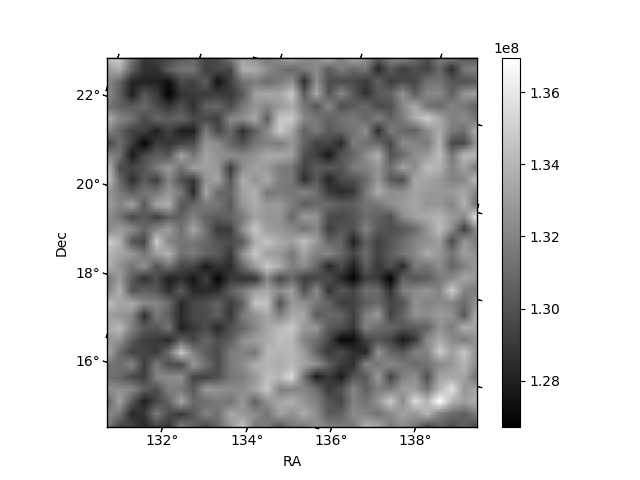
Histogram calculated using DETX and DETY for each event in the final _common_clean file
| Quadrant A | 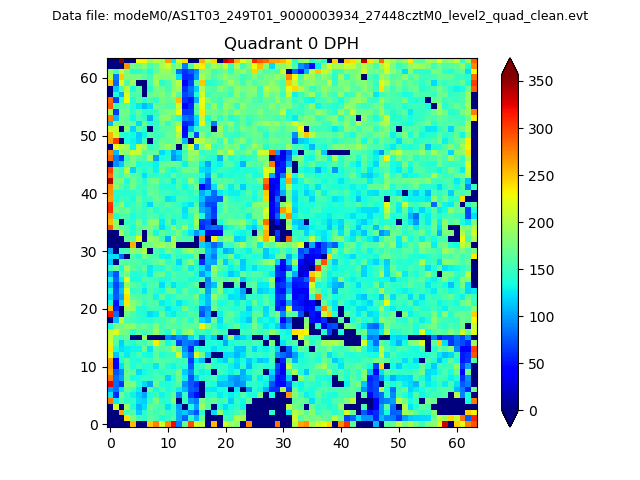 |
 |
Quadrant B |
|---|---|---|---|
| Quadrant D | 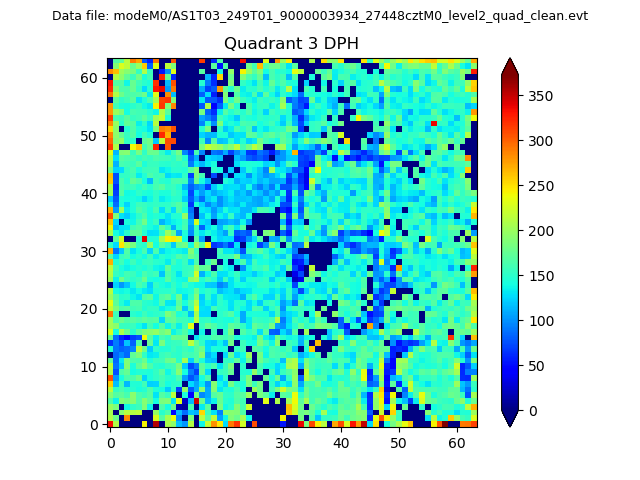 |
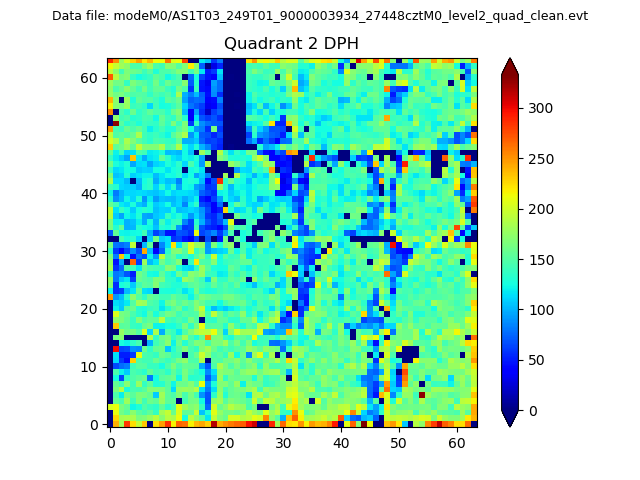 |
Quadrant C |
| Plot type | Count rate plots | Images |
|---|---|---|
| Comparison with Poisson distribution Blue bars denote a histogram of data divided into 1 sec bins. Red curve is a Poisson curve with rate = median count rate of data. |
 |
 |
| Quadrant-wise count rates Data is divided into 100 sec bins |
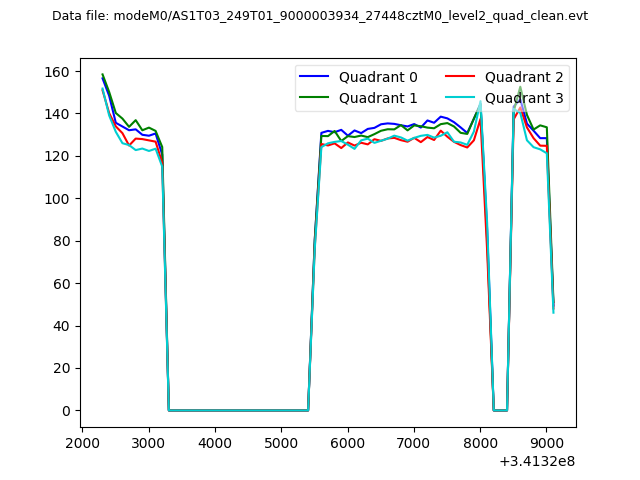 |
|
| Module-wise count rates for Quadrant A Data is divided into 100 sec bins |
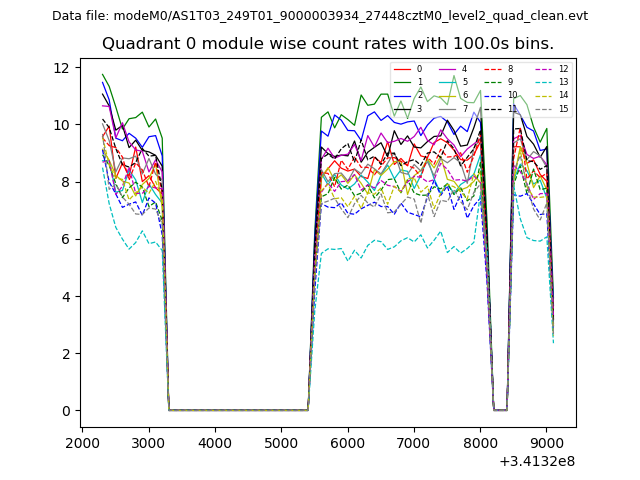 |
 |
| Module-wise count rates for Quadrant B Data is divided into 100 sec bins |
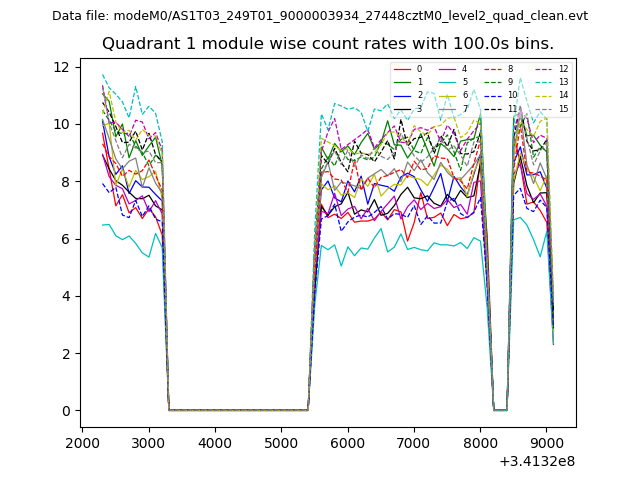 |
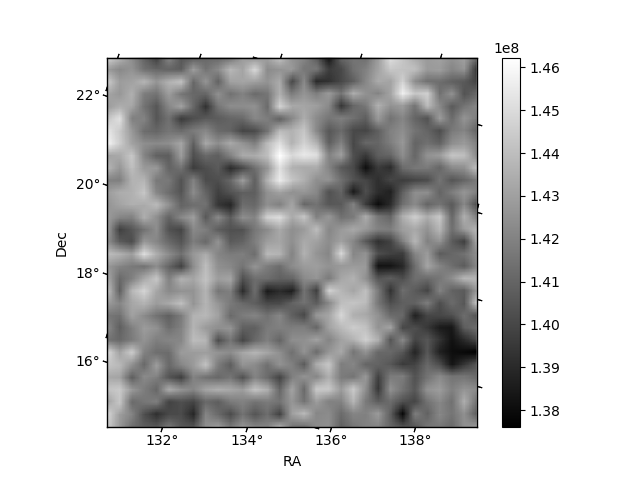 |
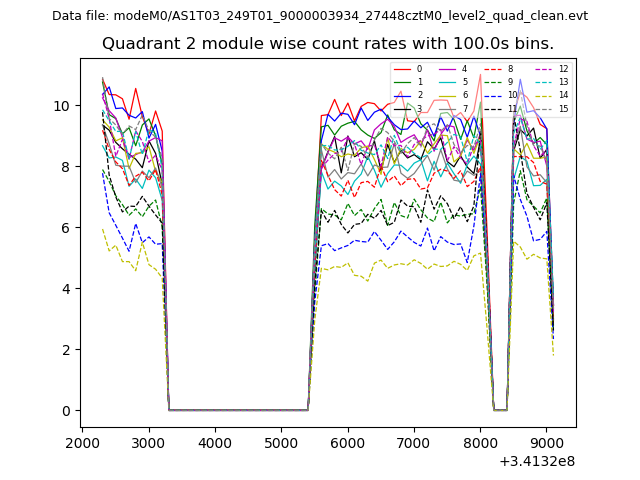
| Module-wise count rates for Quadrant C Data is divided into 100 sec bins |
 |
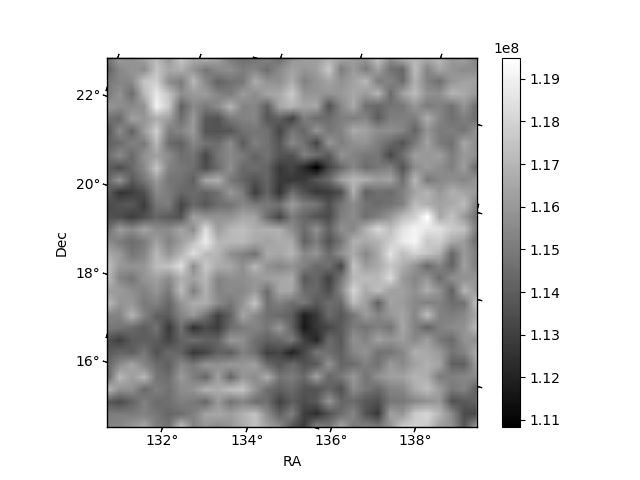 |
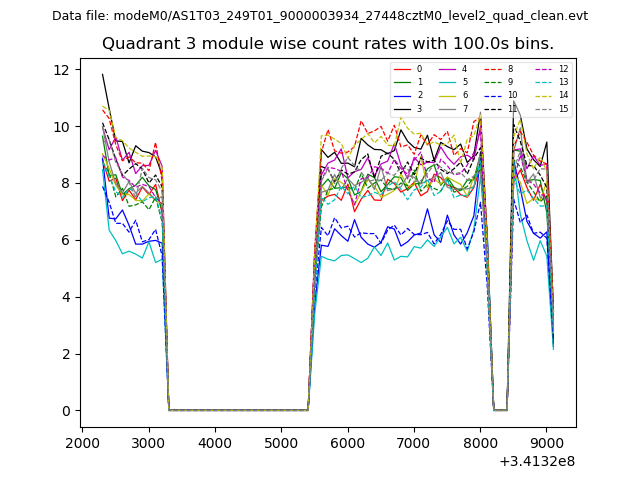
| Module-wise count rates for Quadrant D Data is divided into 100 sec bins |
 |
 |
| Parameter | Plot |
|---|---|
| CZT HV Monitor | 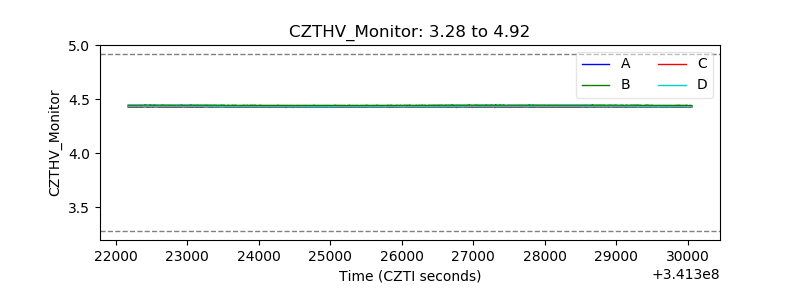 |
| D_VDD | 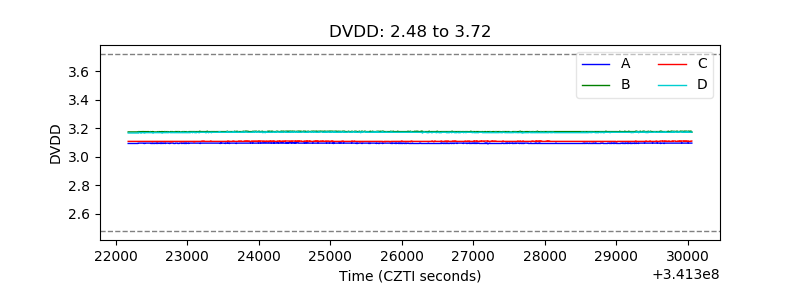 |
| Temperature 1 | 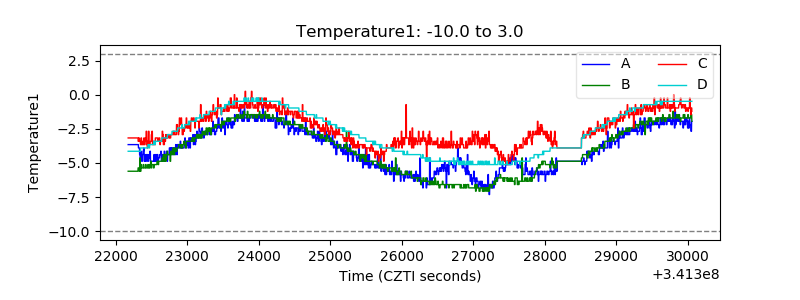 |
| Veto HV Monitor | 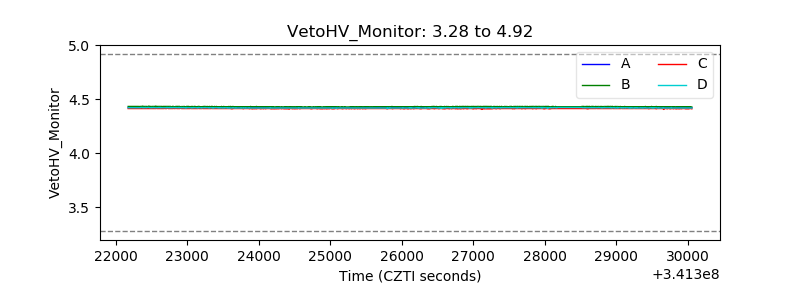 |
| Veto LLD |  |
| Alpha Counter | 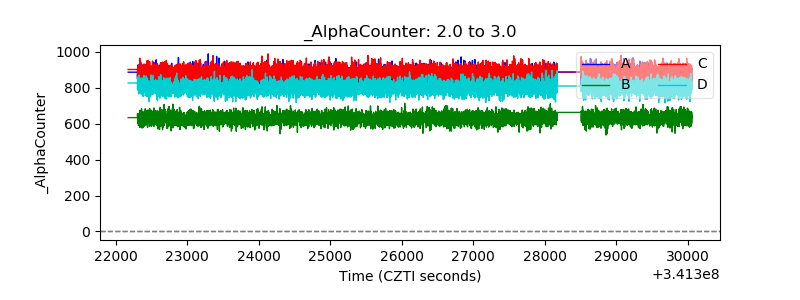 |
| _CPM_Rate | 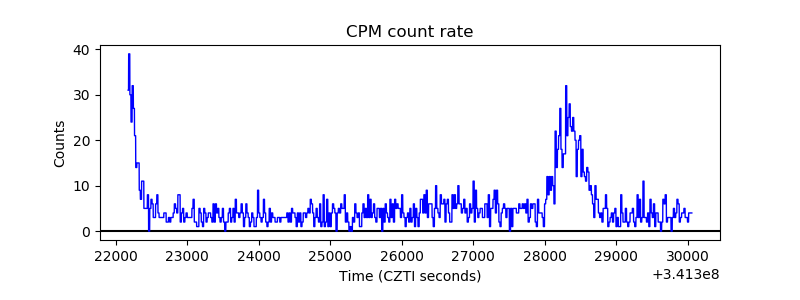 |
| CZT Counter | 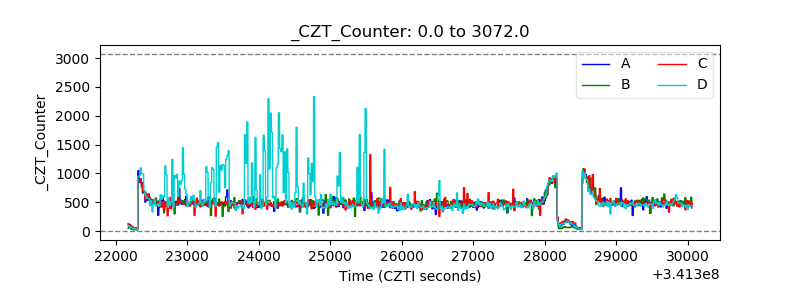 |
| +2.5 Volts monitor | 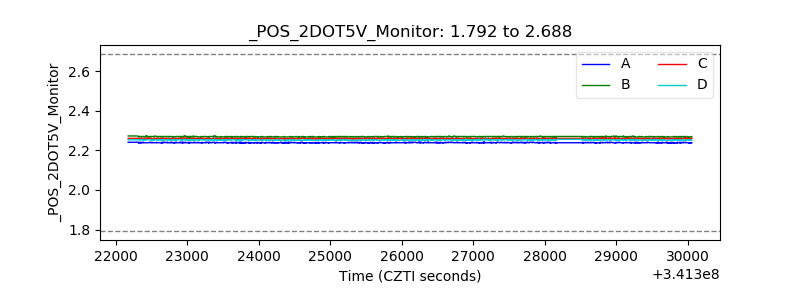 |
| +5 Volts monitor |  |
| _ROLL_ROT | 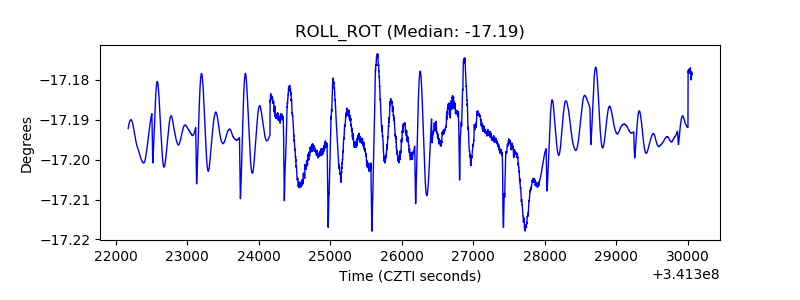 |
| _Roll_DEC | 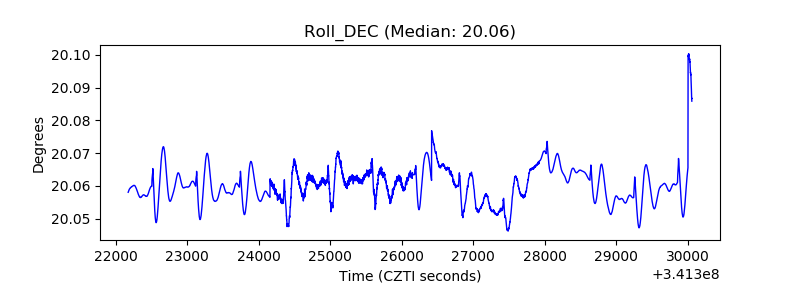 |
| _Roll_RA | 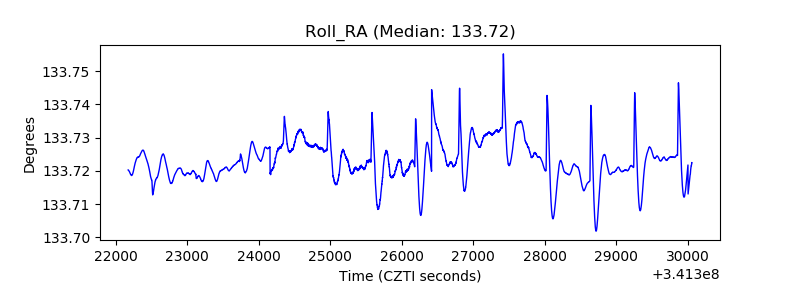 |
| Veto Counter | 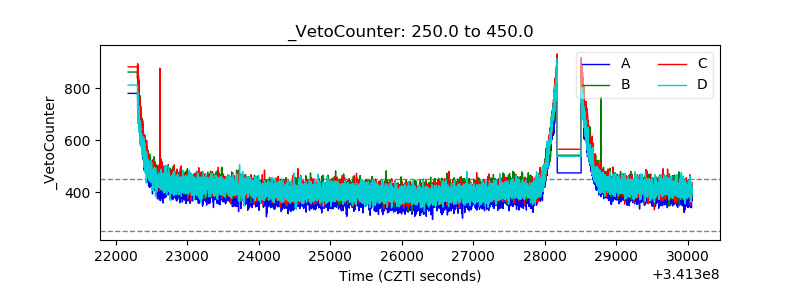 |