| Param | Original file | Final file |
|---|---|---|
| Filename | modeM0/AS1T03_249T01_9000003934_27449cztM0_level2.evt | modeM0/AS1T03_249T01_9000003934_27449cztM0_level2_quad_clean.evt |
| Size (bytes) | 522,504,000 | 85,775,040 |
| Size | 498.3 MB | 81.8 MB |
| Events in quadrant A | 3,751,711 | 528,077 |
| Events in quadrant B | 3,916,605 | 527,347 |
| Events in quadrant C | 3,775,397 | 504,088 |
| Events in quadrant D | 3,860,909 | 505,721 |
| Mode M0 | |||
|---|---|---|---|
| Quadrant | BADHDUFLAG | Total packets | Discarded packets |
| A | 0 | 15961 | 0 |
| B | 0 | 16210 | 0 |
| C | 0 | 16010 | 0 |
| D | 0 | 16688 | 0 |
| Mode M9 | |||
|---|---|---|---|
| Quadrant | BADHDUFLAG | Total packets | Discarded packets |
| A | 0 | 3 | 0 |
| B | 0 | 3 | 0 |
| C | 0 | 3 | 0 |
| D | 0 | 3 | 0 |
| Quadrant | Total seconds | Saturated seconds | Saturation percentage |
|---|---|---|---|
| A | 7650 | 165 | 2.156863% |
| B | 7650 | 192 | 2.509804% |
| C | 7650 | 258 | 3.372549% |
| D | 7650 | 156 | 2.039216% |
Noise dominated data is calculated using 1-second bins in cleaned event files. If a bin has >2000 counts, and if more than 50% of those come from <1% of pixels, then it is considered to be noise-dominated and hence unusable.
| Quadrant | # 1 sec bins | Bins with >0 counts | Bins with >2000 counts | High rate bins dominated by noise | Noise dominated (total time) | Noise dominated (detector-on time) | Marked lightcurve |
|---|---|---|---|---|---|---|---|
| A | 7900 | 7650 | 0 | 0 | 0.00% | 0.00% |  |
| B | 7900 | 7651 | 2 | 2 | 0.03% | 0.03% |  |
| C | 7900 | 7650 | 1 | 1 | 0.01% | 0.01% |  |
| D | 7900 | 7651 | 37 | 37 | 0.47% | 0.48% |  |
Top three noisy pixels from each quadrant. If the there are fewer than three noisy pixels in the level2.evt file, extra rows are filled as -1
| Pixel properties | Quadrant properties | ||||||
|---|---|---|---|---|---|---|---|
| Quadrant | DetID | PixID | Counts | Sigma | Mean | Median | Sigma |
| A | 13 | 254 | 13008 | 61.24 | 972 | 950 | 196.9 |
| A | 3 | 137 | 9485 | 43.35 | 972 | 950 | 196.9 |
| A | 0 | 226 | 8188 | 36.76 | 972 | 950 | 196.9 |
| B | 0 | 189 | 94708 | 503.91 | 955 | 931 | 186.1 |
| B | 0 | 230 | 25806 | 133.66 | 955 | 931 | 186.1 |
| B | 12 | 111 | 23461 | 121.06 | 955 | 931 | 186.1 |
| C | 14 | 238 | 146071 | 658.89 | 924 | 927 | 220.3 |
| C | 10 | 22 | 23959 | 104.55 | 924 | 927 | 220.3 |
| C | 13 | 61 | 6398 | 24.84 | 924 | 927 | 220.3 |
| D | 2 | 250 | 241936 | 1068.54 | 944 | 920 | 225.6 |
| D | 2 | 234 | 34146 | 147.31 | 944 | 920 | 225.6 |
| D | 2 | 120 | 13736 | 56.82 | 944 | 920 | 225.6 |
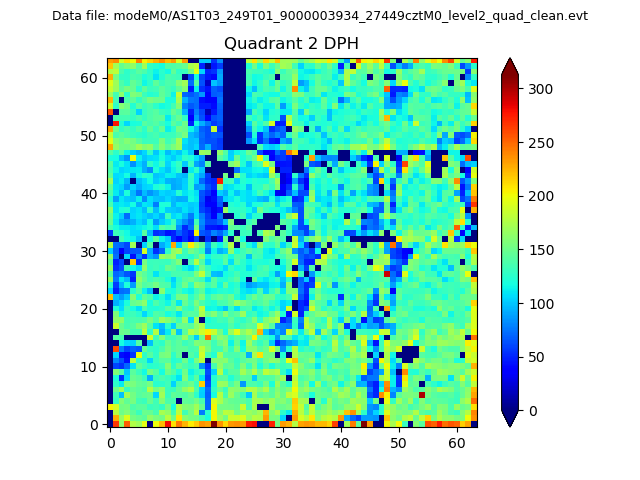
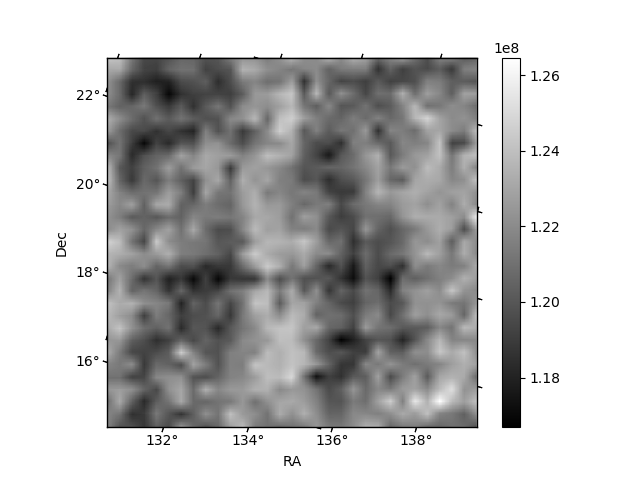
Histogram calculated using DETX and DETY for each event in the final _common_clean file
| Quadrant A |  |
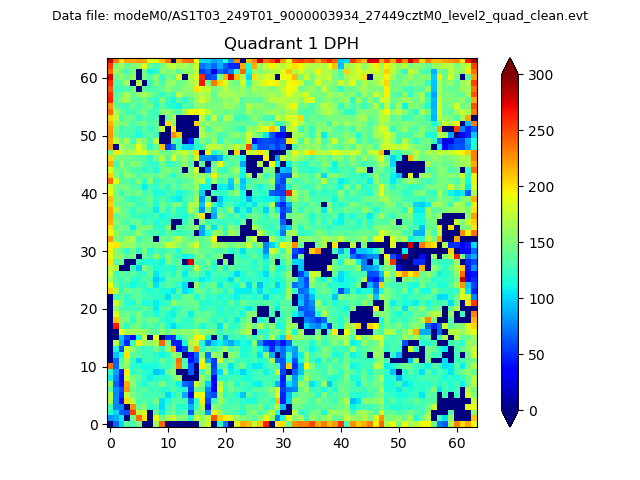 |
Quadrant B |
|---|---|---|---|
| Quadrant D | 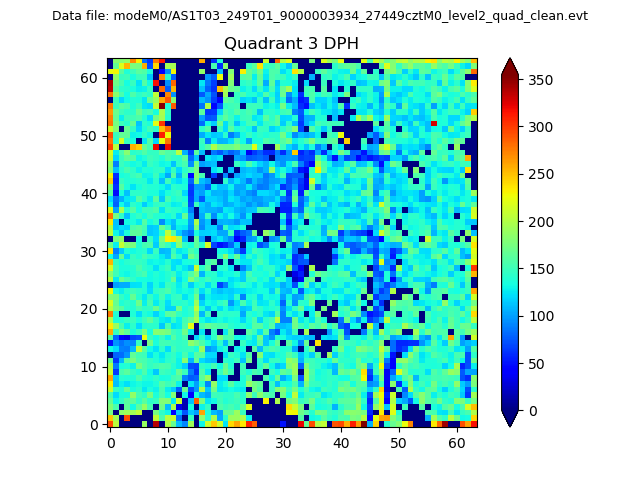 |
 |
Quadrant C |
| Plot type | Count rate plots | Images |
|---|---|---|
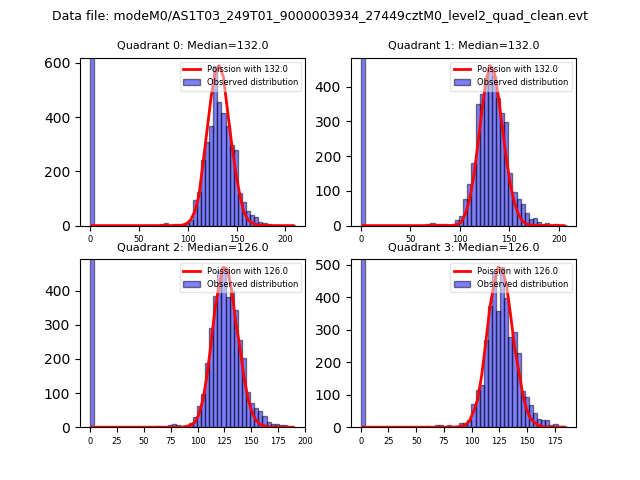
| Comparison with Poisson distribution Blue bars denote a histogram of data divided into 1 sec bins. Red curve is a Poisson curve with rate = median count rate of data. |
 |
 |
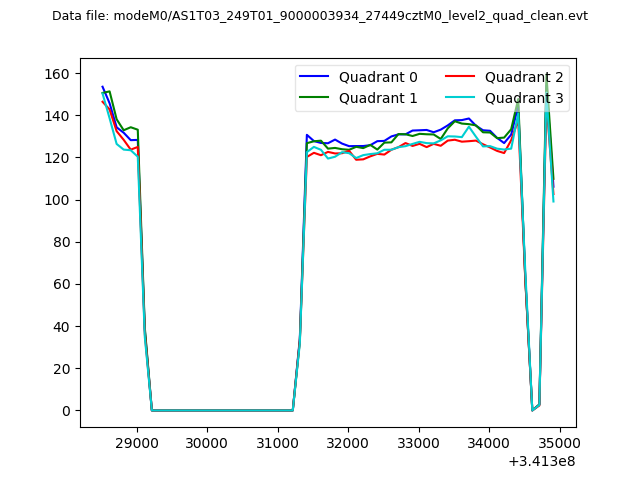
| Quadrant-wise count rates Data is divided into 100 sec bins |
 |
|
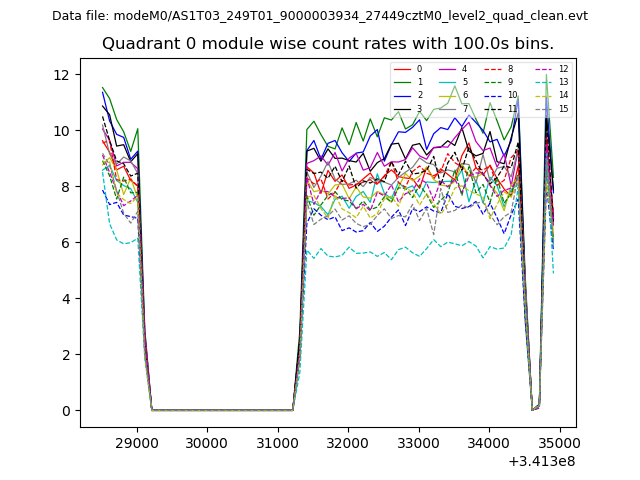
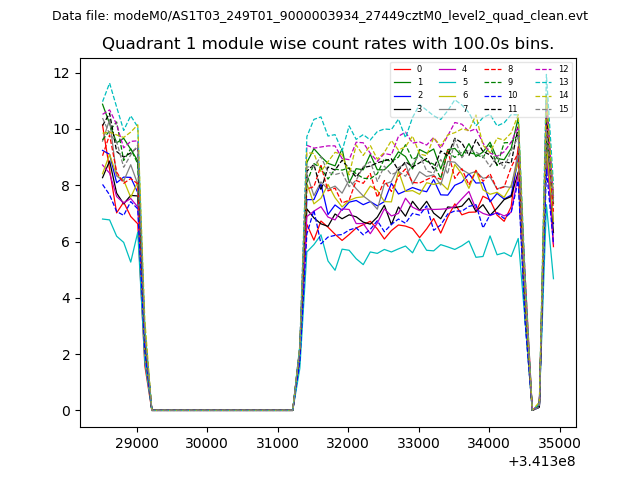
| Module-wise count rates for Quadrant A Data is divided into 100 sec bins |
 |
 |
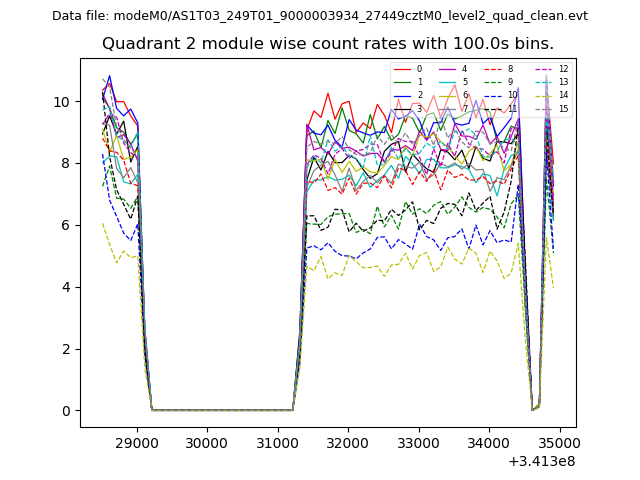
| Module-wise count rates for Quadrant B Data is divided into 100 sec bins |
 |
 |
| Module-wise count rates for Quadrant C Data is divided into 100 sec bins |
 |
 |
| Module-wise count rates for Quadrant D Data is divided into 100 sec bins |
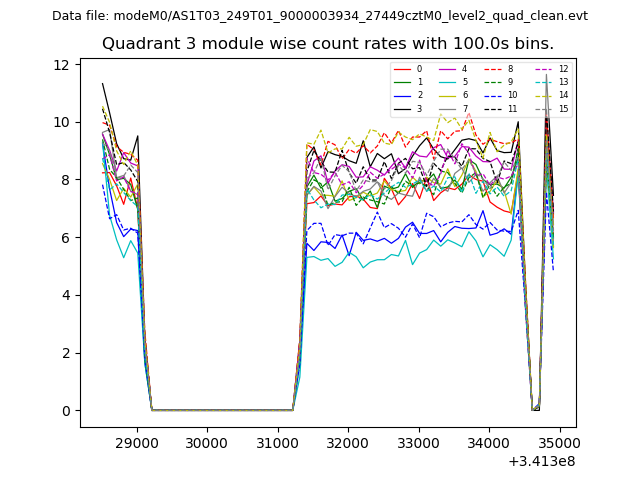 |
 |
| Parameter | Plot |
|---|---|
| CZT HV Monitor | 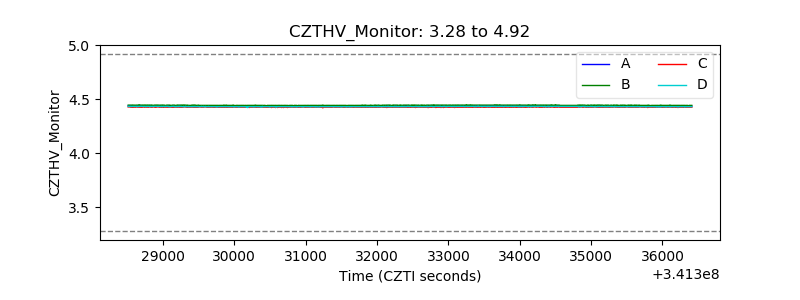 |
| D_VDD | 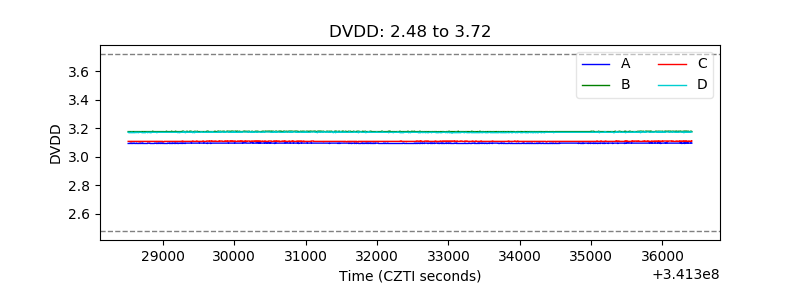 |
| Temperature 1 | 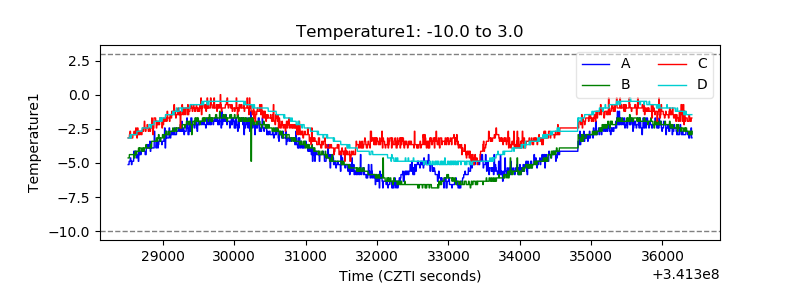 |
| Veto HV Monitor |  |
| Veto LLD | 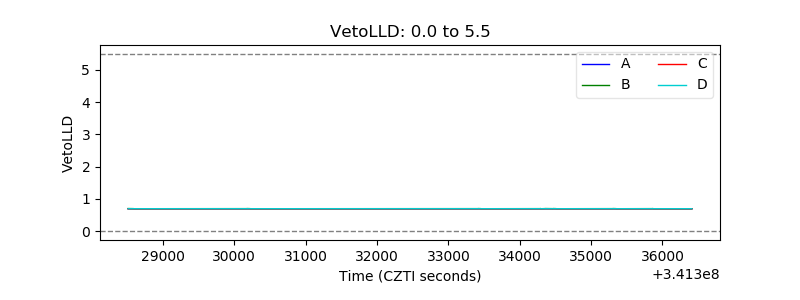 |
| Alpha Counter | 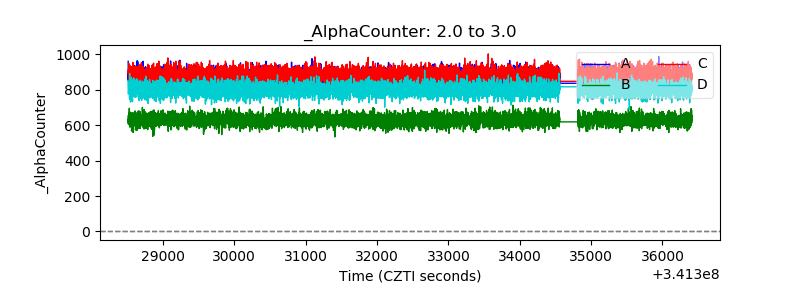 |
| _CPM_Rate | 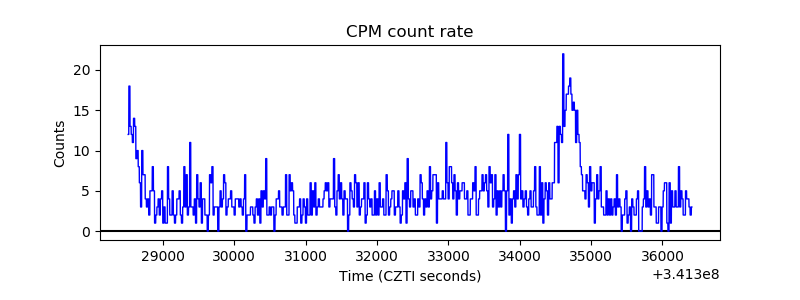 |
| CZT Counter | 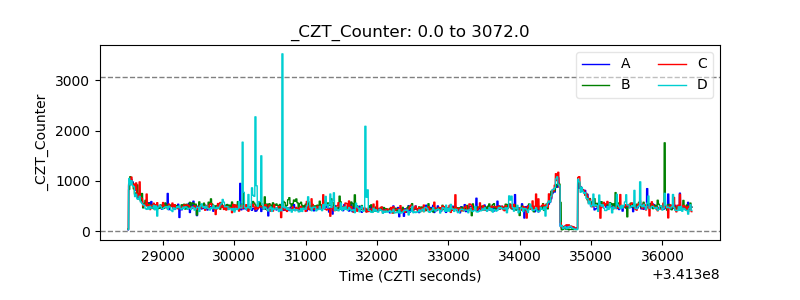 |
| +2.5 Volts monitor |  |
| +5 Volts monitor |  |
| _ROLL_ROT | 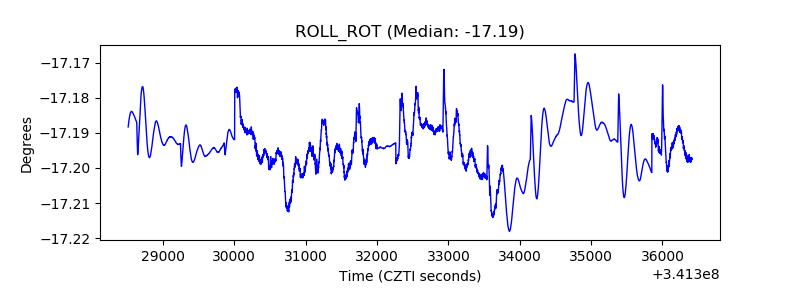 |
| _Roll_DEC | 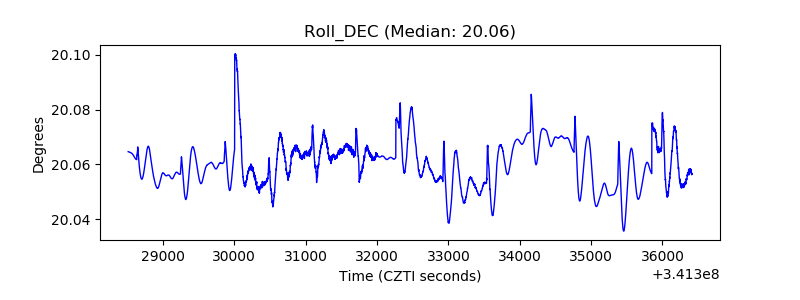 |
| _Roll_RA | 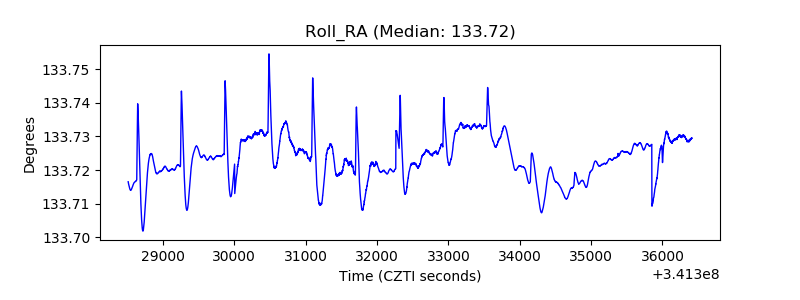 |
| Veto Counter | 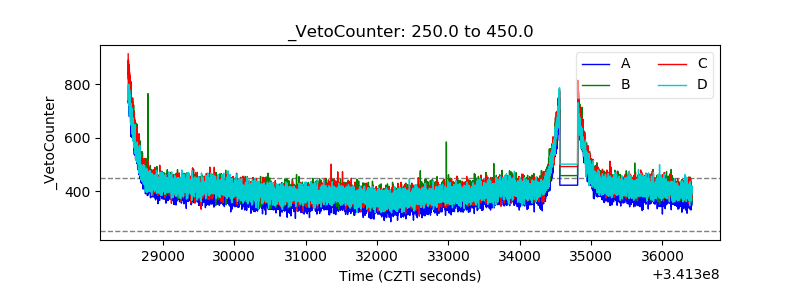 |