| Param | Original file | Final file |
|---|---|---|
| Filename | modeM0/AS1T03_249T01_9000003934_27450cztM0_level2.evt | modeM0/AS1T03_249T01_9000003934_27450cztM0_level2_quad_clean.evt |
| Size (bytes) | 492,301,440 | 77,448,960 |
| Size | 469.5 MB | 73.9 MB |
| Events in quadrant A | 3,563,622 | 467,552 |
| Events in quadrant B | 3,693,835 | 465,905 |
| Events in quadrant C | 3,600,960 | 446,770 |
| Events in quadrant D | 3,545,472 | 447,130 |
| Mode M0 | |||
|---|---|---|---|
| Quadrant | BADHDUFLAG | Total packets | Discarded packets |
| A | 0 | 15284 | 0 |
| B | 0 | 15576 | 0 |
| C | 0 | 15317 | 0 |
| D | 0 | 15583 | 0 |
| Mode M9 | |||
|---|---|---|---|
| Quadrant | BADHDUFLAG | Total packets | Discarded packets |
| A | 0 | 5 | 0 |
| B | 0 | 5 | 0 |
| C | 0 | 5 | 0 |
| D | 0 | 5 | 0 |
| Quadrant | Total seconds | Saturated seconds | Saturation percentage |
|---|---|---|---|
| A | 7447 | 49 | 0.657983% |
| B | 7448 | 55 | 0.738453% |
| C | 7448 | 110 | 1.476907% |
| D | 7448 | 60 | 0.805585% |
Noise dominated data is calculated using 1-second bins in cleaned event files. If a bin has >2000 counts, and if more than 50% of those come from <1% of pixels, then it is considered to be noise-dominated and hence unusable.
| Quadrant | # 1 sec bins | Bins with >0 counts | Bins with >2000 counts | High rate bins dominated by noise | Noise dominated (total time) | Noise dominated (detector-on time) | Marked lightcurve |
|---|---|---|---|---|---|---|---|
| A | 7862 | 7448 | 2 | 2 | 0.03% | 0.03% | 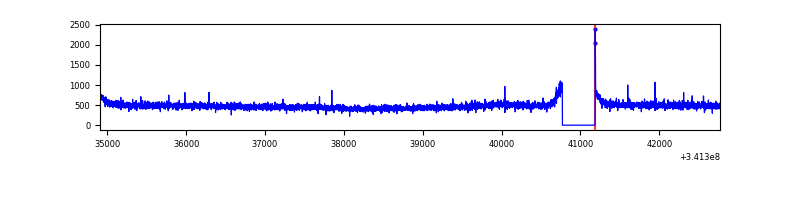 |
| B | 7863 | 7448 | 1 | 1 | 0.01% | 0.01% | 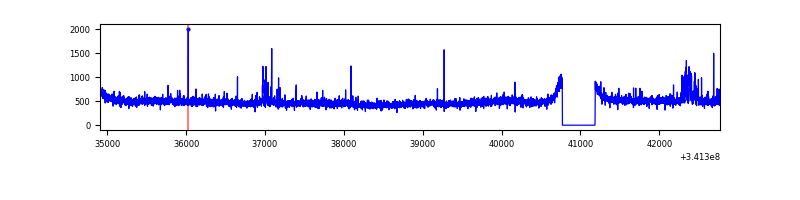 |
| C | 7863 | 7448 | 1 | 1 | 0.01% | 0.01% | 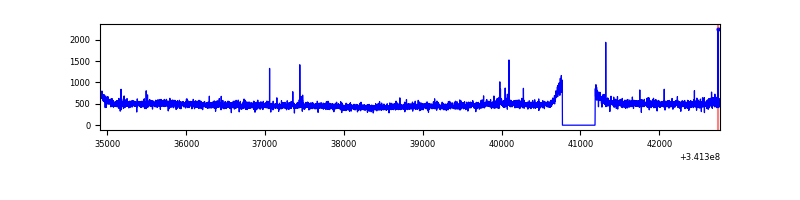 |
| D | 7863 | 7449 | 18 | 18 | 0.23% | 0.24% | 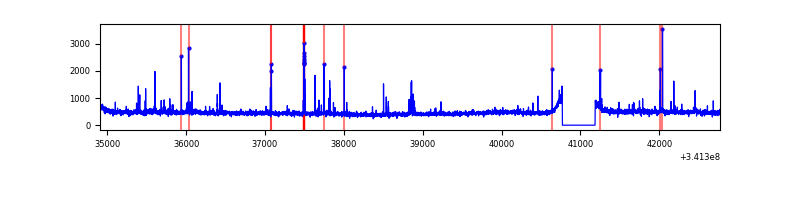 |
Top three noisy pixels from each quadrant. If the there are fewer than three noisy pixels in the level2.evt file, extra rows are filled as -1
| Pixel properties | Quadrant properties | ||||||
|---|---|---|---|---|---|---|---|
| Quadrant | DetID | PixID | Counts | Sigma | Mean | Median | Sigma |
| A | 13 | 254 | 12182 | 60.69 | 922 | 902 | 185.9 |
| A | 3 | 137 | 9037 | 43.77 | 922 | 902 | 185.9 |
| A | 0 | 226 | 7968 | 38.02 | 922 | 902 | 185.9 |
| B | 15 | 32 | 51090 | 284.88 | 909 | 884 | 176.2 |
| B | 0 | 244 | 22567 | 123.03 | 909 | 884 | 176.2 |
| B | 12 | 111 | 22100 | 120.38 | 909 | 884 | 176.2 |
| C | 14 | 238 | 140434 | 670.32 | 879 | 883 | 208.2 |
| C | 2 | 16 | 16633 | 75.65 | 879 | 883 | 208.2 |
| C | 15 | 208 | 10656 | 46.94 | 879 | 883 | 208.2 |
| D | 2 | 250 | 113142 | 525.93 | 893 | 868 | 213.5 |
| D | 2 | 234 | 35554 | 162.48 | 893 | 868 | 213.5 |
| D | 2 | 120 | 27303 | 123.83 | 893 | 868 | 213.5 |
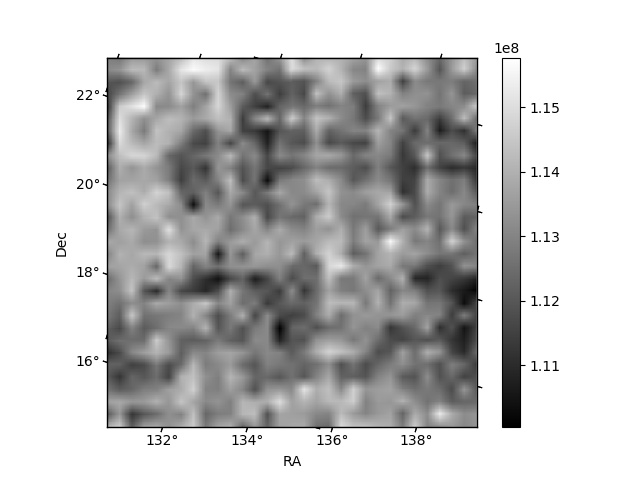
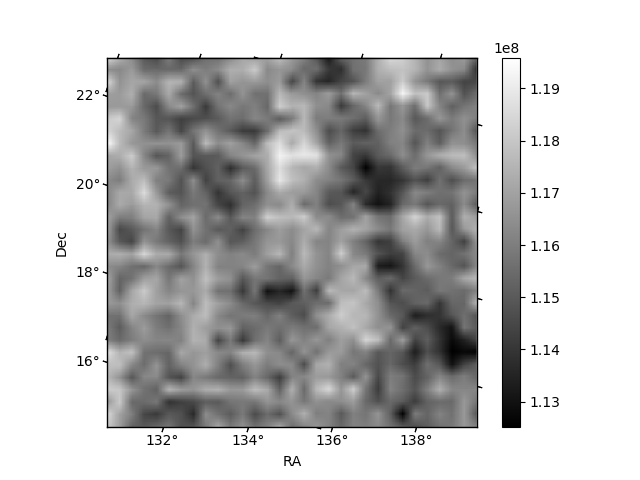
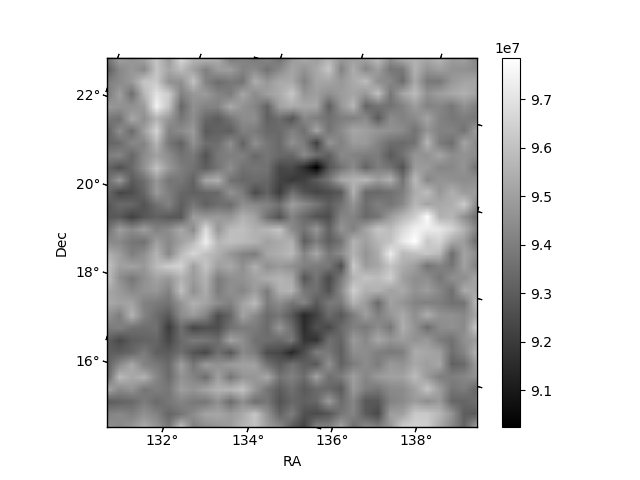
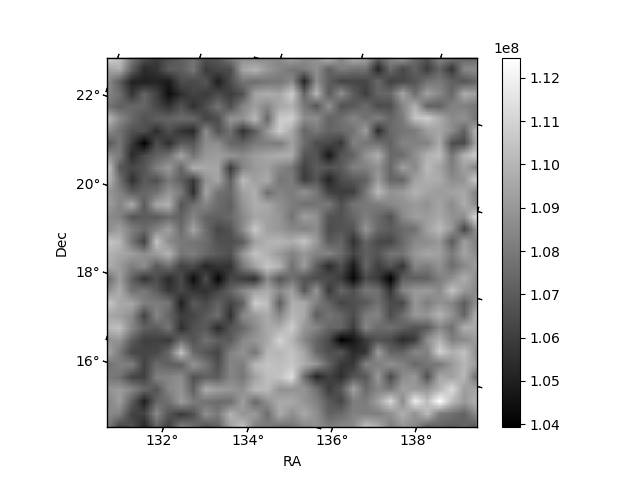
Histogram calculated using DETX and DETY for each event in the final _common_clean file
| Quadrant A | 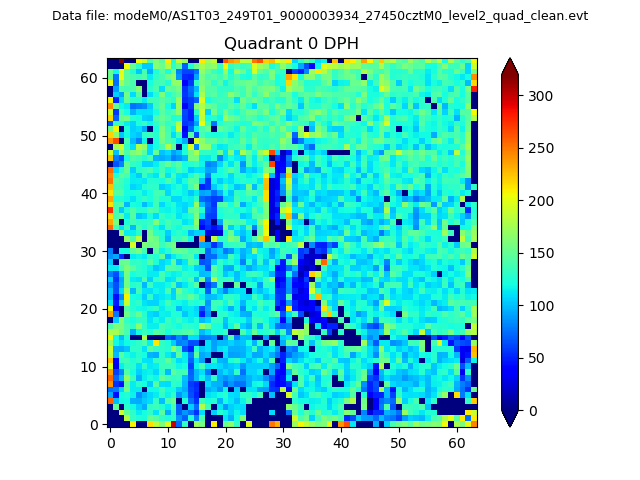 |
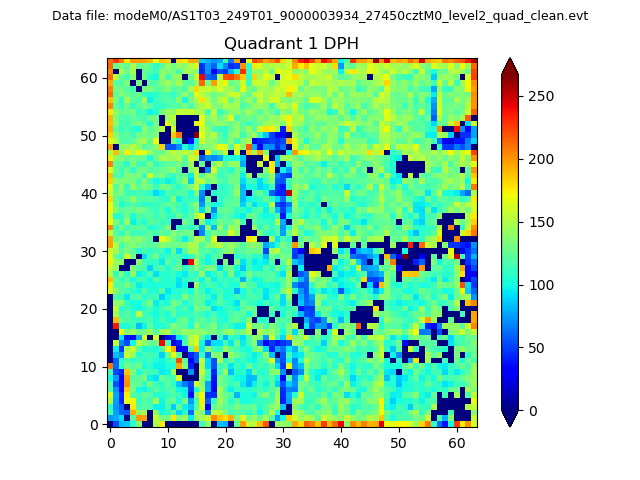 |
Quadrant B |
|---|---|---|---|
| Quadrant D | 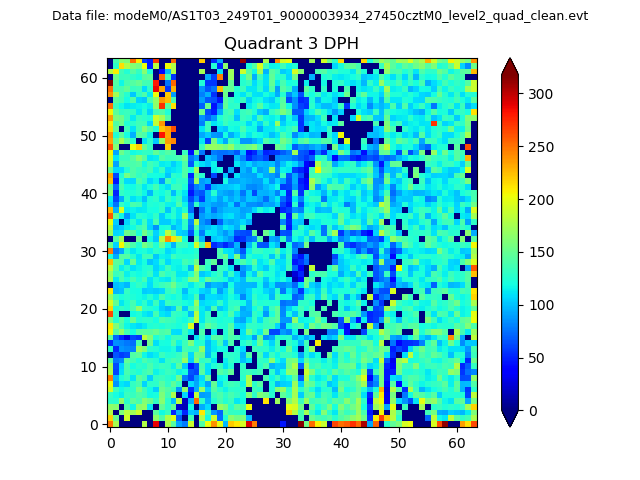 |
 |
Quadrant C |
| Plot type | Count rate plots | Images |
|---|---|---|
| Comparison with Poisson distribution Blue bars denote a histogram of data divided into 1 sec bins. Red curve is a Poisson curve with rate = median count rate of data. |
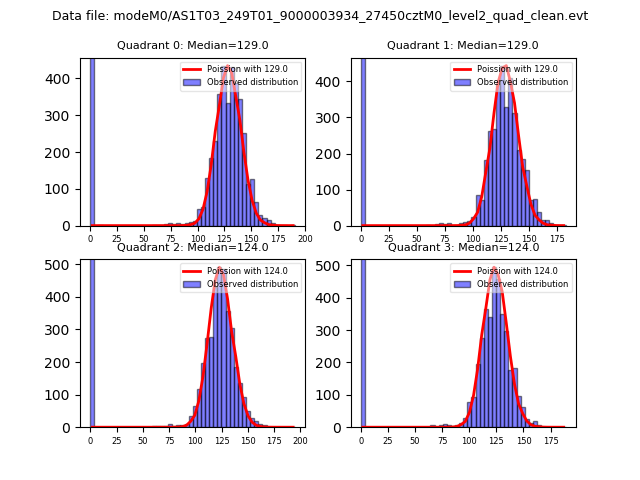 |
 |
| Quadrant-wise count rates Data is divided into 100 sec bins |
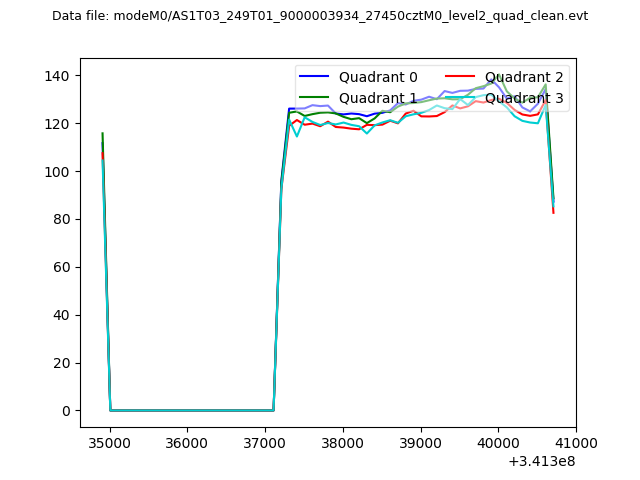 |
|
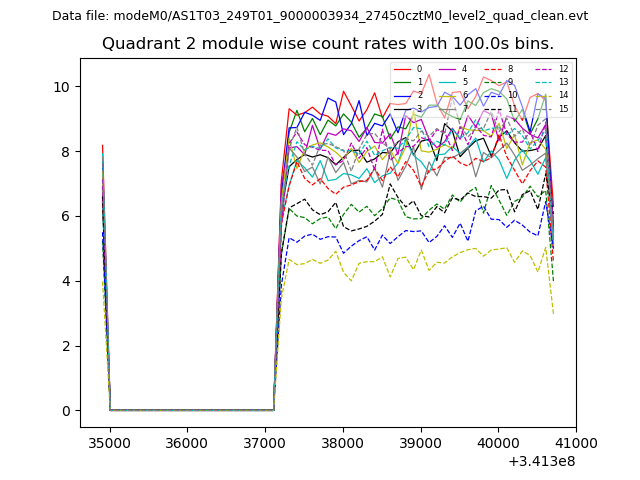
| Module-wise count rates for Quadrant A Data is divided into 100 sec bins |
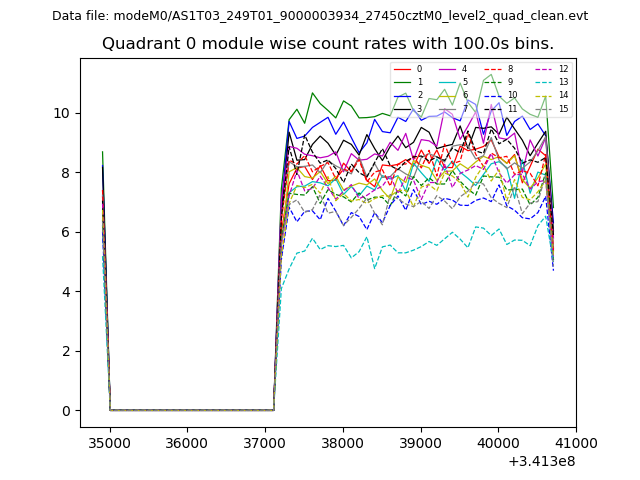 |
 |
| Module-wise count rates for Quadrant B Data is divided into 100 sec bins |
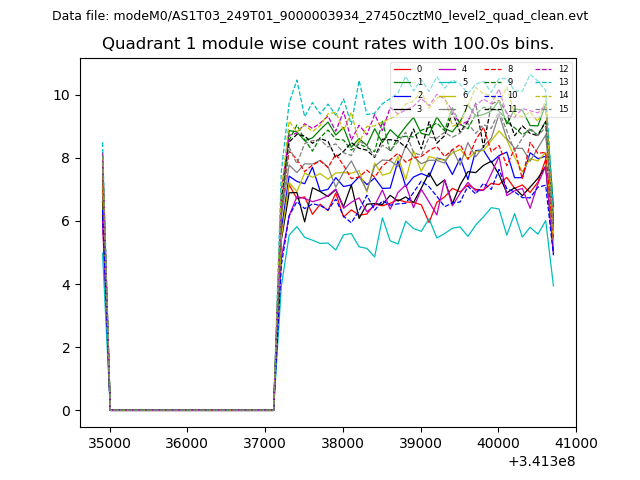 |
 |
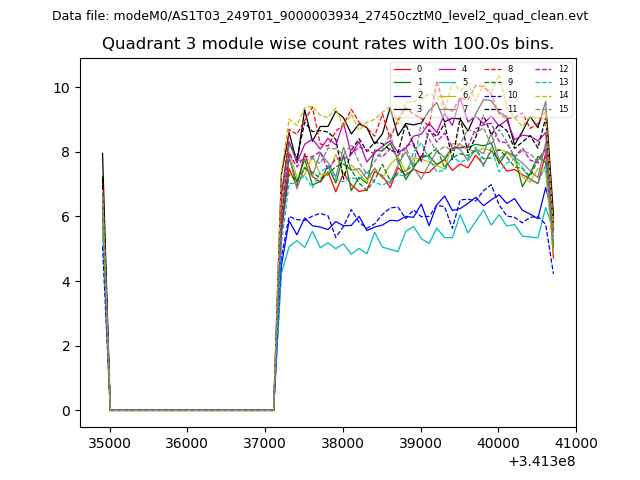
| Module-wise count rates for Quadrant C Data is divided into 100 sec bins |
 |
 |
| Module-wise count rates for Quadrant D Data is divided into 100 sec bins |
 |
 |
| Parameter | Plot |
|---|---|
| CZT HV Monitor | 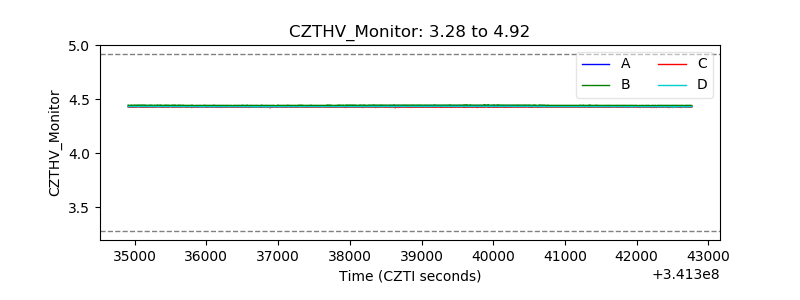 |
| D_VDD | 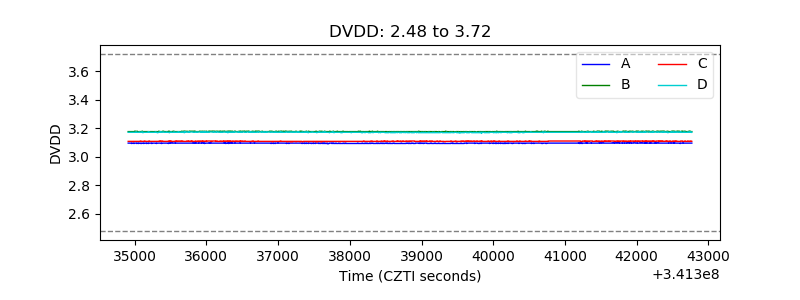 |
| Temperature 1 | 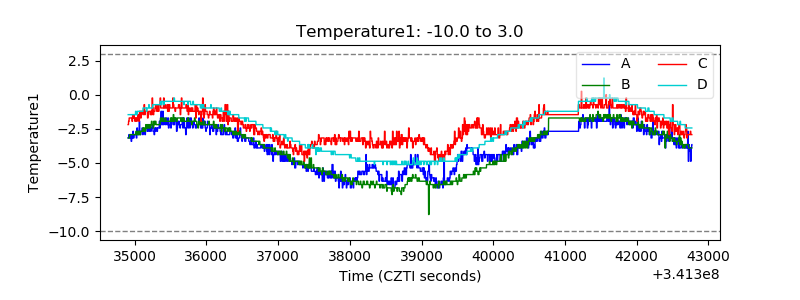 |
| Veto HV Monitor | 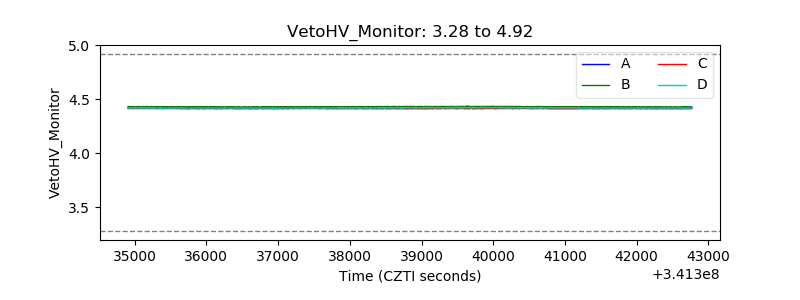 |
| Veto LLD | 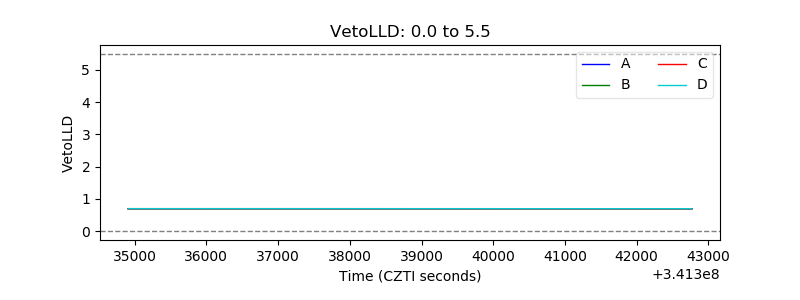 |
| Alpha Counter | 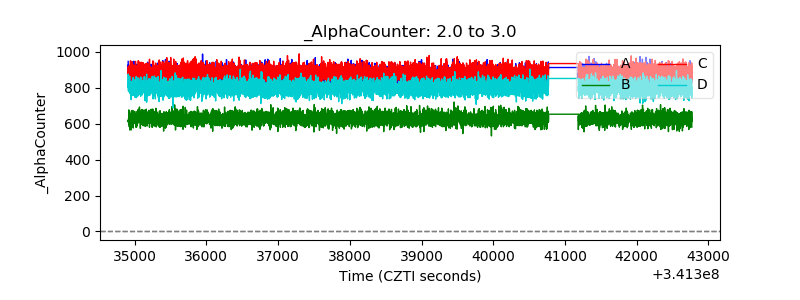 |
| _CPM_Rate | 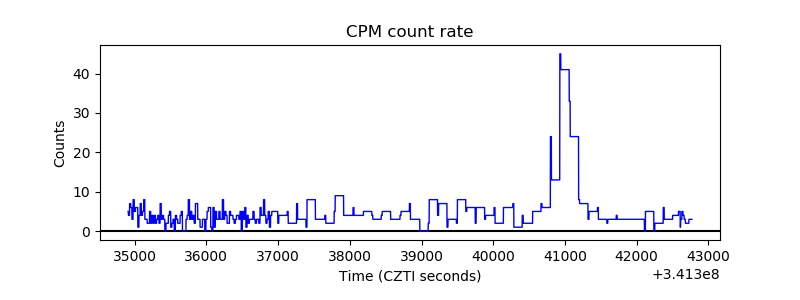 |
| CZT Counter |  |
| +2.5 Volts monitor |  |
| +5 Volts monitor |  |
| _ROLL_ROT |  |
| _Roll_DEC |  |
| _Roll_RA |  |
| Veto Counter |  |