| Param | Original file | Final file |
|---|---|---|
| Filename | modeM0/AS1T03_249T01_9000003934_27453cztM0_level2.evt | modeM0/AS1T03_249T01_9000003934_27453cztM0_level2_quad_clean.evt |
| Size (bytes) | 620,084,160 | 130,939,200 |
| Size | 591.4 MB | 124.9 MB |
| Events in quadrant A | 4,454,890 | 843,358 |
| Events in quadrant B | 4,563,362 | 837,766 |
| Events in quadrant C | 4,634,553 | 801,924 |
| Events in quadrant D | 4,467,032 | 808,942 |
| Mode M0 | |||
|---|---|---|---|
| Quadrant | BADHDUFLAG | Total packets | Discarded packets |
| A | 0 | 19711 | 0 |
| B | 0 | 19975 | 0 |
| C | 0 | 20100 | 0 |
| D | 0 | 20236 | 0 |
| Mode M9 | |||
|---|---|---|---|
| Quadrant | BADHDUFLAG | Total packets | Discarded packets |
| A | 0 | 6 | 0 |
| B | 0 | 6 | 0 |
| C | 0 | 6 | 0 |
| D | 0 | 6 | 0 |
| Quadrant | Total seconds | Saturated seconds | Saturation percentage |
|---|---|---|---|
| A | 9719 | 47 | 0.483589% |
| B | 9720 | 60 | 0.617284% |
| C | 9720 | 118 | 1.213992% |
| D | 9720 | 62 | 0.637860% |
Noise dominated data is calculated using 1-second bins in cleaned event files. If a bin has >2000 counts, and if more than 50% of those come from <1% of pixels, then it is considered to be noise-dominated and hence unusable.
| Quadrant | # 1 sec bins | Bins with >0 counts | Bins with >2000 counts | High rate bins dominated by noise | Noise dominated (total time) | Noise dominated (detector-on time) | Marked lightcurve |
|---|---|---|---|---|---|---|---|
| A | 10279 | 9720 | 0 | 0 | 0.00% | 0.00% | 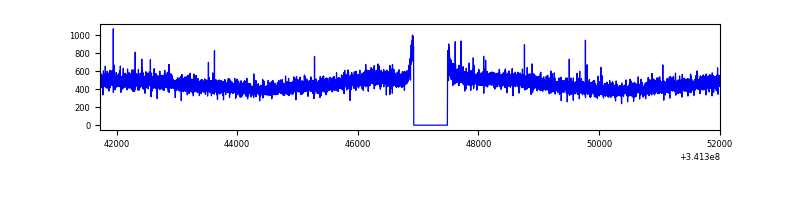 |
| B | 10280 | 9720 | 0 | 0 | 0.00% | 0.00% | 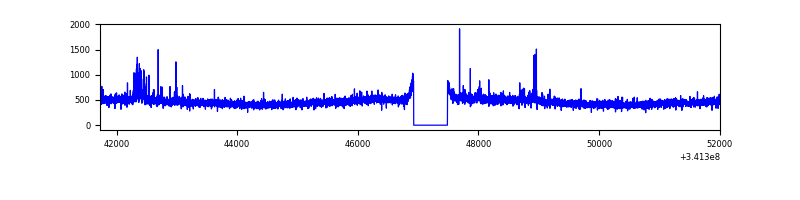 |
| C | 10280 | 9720 | 10 | 10 | 0.10% | 0.10% | 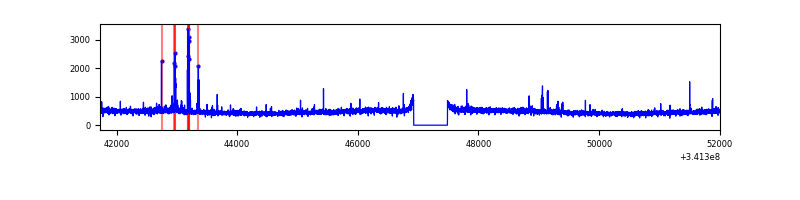 |
| D | 10280 | 9720 | 15 | 15 | 0.15% | 0.15% | 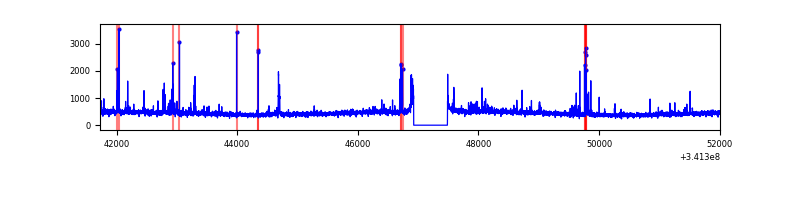 |
Top three noisy pixels from each quadrant. If the there are fewer than three noisy pixels in the level2.evt file, extra rows are filled as -1
| Pixel properties | Quadrant properties | ||||||
|---|---|---|---|---|---|---|---|
| Quadrant | DetID | PixID | Counts | Sigma | Mean | Median | Sigma |
| A | 13 | 254 | 15756 | 62.51 | 1154 | 1128 | 234.0 |
| A | 3 | 137 | 11024 | 42.29 | 1154 | 1128 | 234.0 |
| A | 0 | 226 | 9881 | 37.4 | 1154 | 1128 | 234.0 |
| B | 15 | 32 | 56252 | 251.55 | 1138 | 1106 | 219.2 |
| B | 12 | 111 | 27056 | 118.37 | 1138 | 1106 | 219.2 |
| B | 11 | 111 | 24361 | 106.08 | 1138 | 1106 | 219.2 |
| C | 14 | 238 | 176885 | 675.86 | 1099 | 1106 | 260.1 |
| C | 2 | 16 | 108604 | 413.32 | 1099 | 1106 | 260.1 |
| C | 10 | 22 | 52284 | 196.78 | 1099 | 1106 | 260.1 |
| D | 2 | 250 | 193740 | 718.25 | 1115 | 1087 | 268.2 |
| D | 2 | 234 | 42683 | 155.08 | 1115 | 1087 | 268.2 |
| D | 2 | 120 | 35092 | 126.78 | 1115 | 1087 | 268.2 |
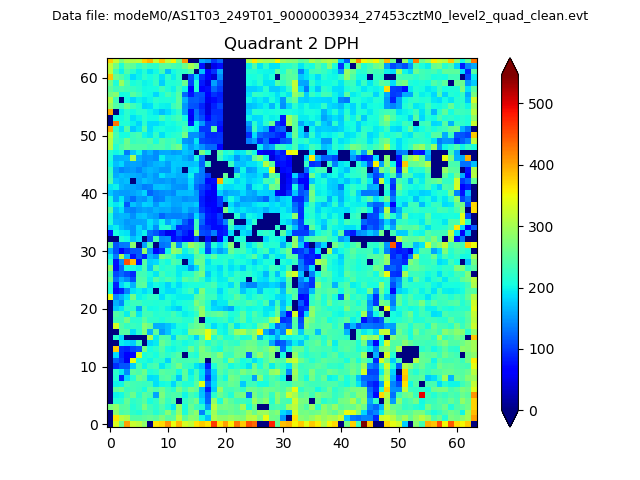
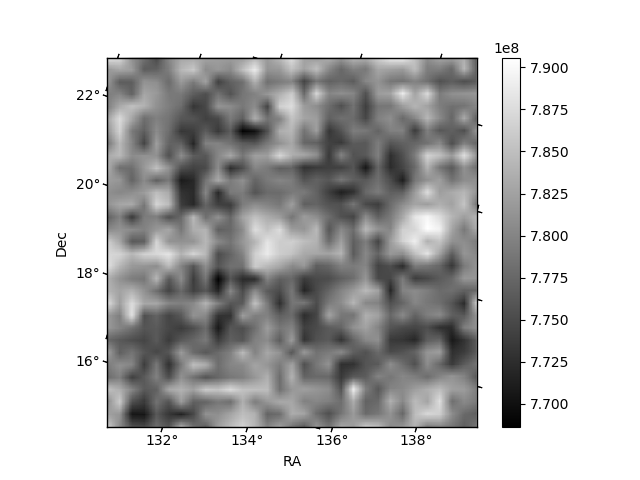
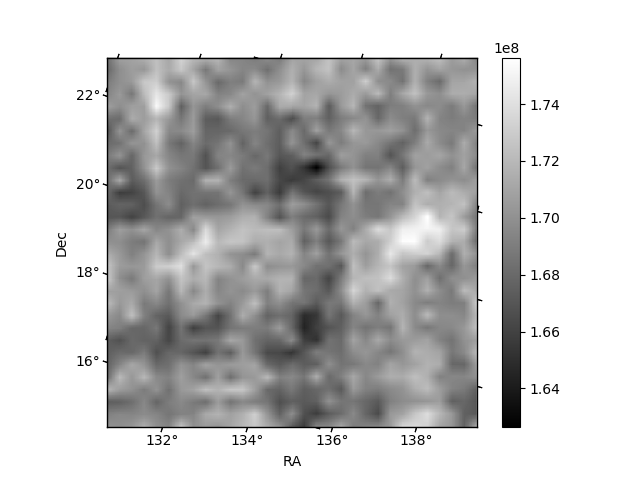
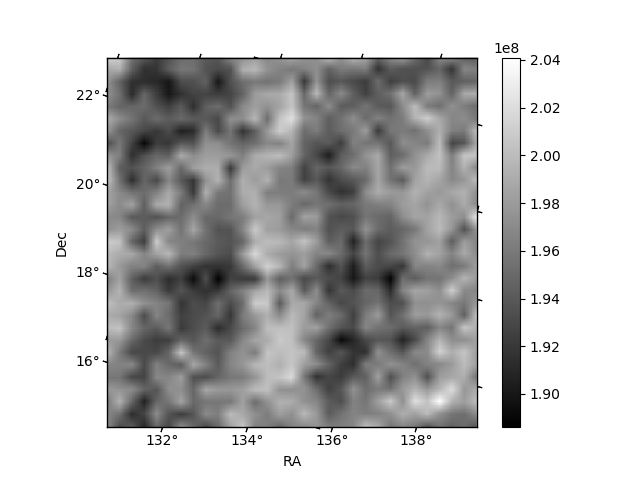
Histogram calculated using DETX and DETY for each event in the final _common_clean file
| Quadrant A | 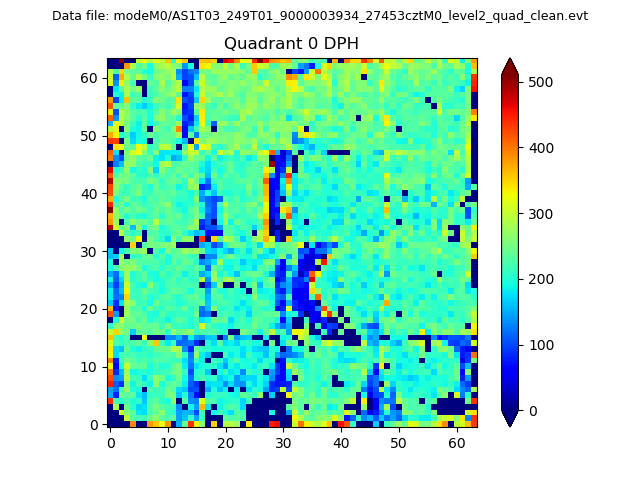 |
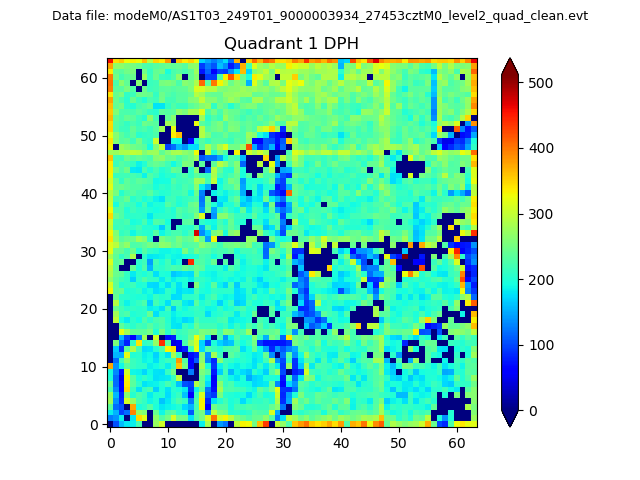 |
Quadrant B |
|---|---|---|---|
| Quadrant D | 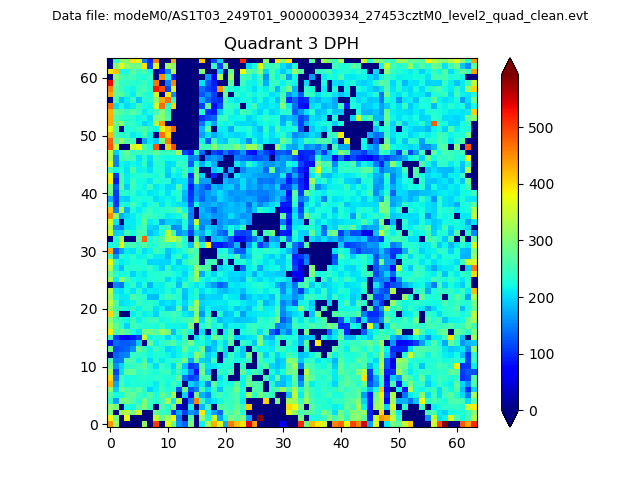 |
 |
Quadrant C |
| Plot type | Count rate plots | Images |
|---|---|---|
| Comparison with Poisson distribution Blue bars denote a histogram of data divided into 1 sec bins. Red curve is a Poisson curve with rate = median count rate of data. |
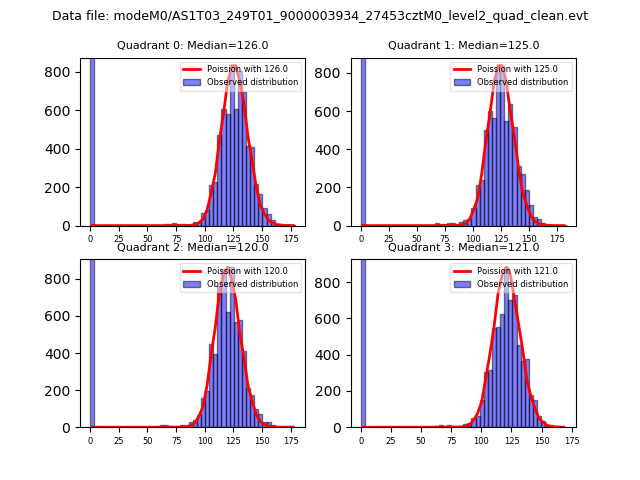 |
 |
| Quadrant-wise count rates Data is divided into 100 sec bins |
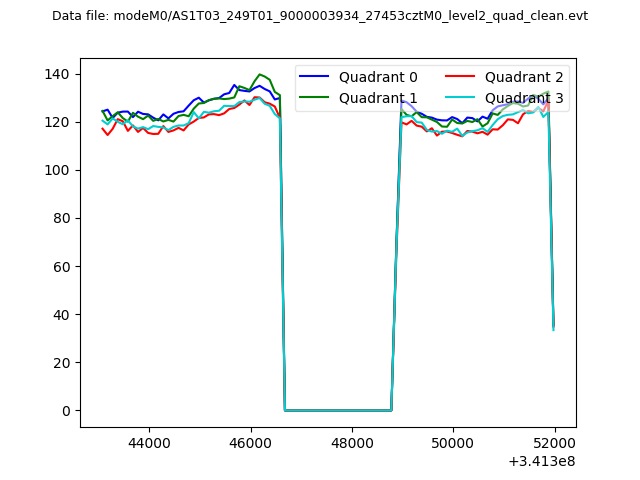 |
|
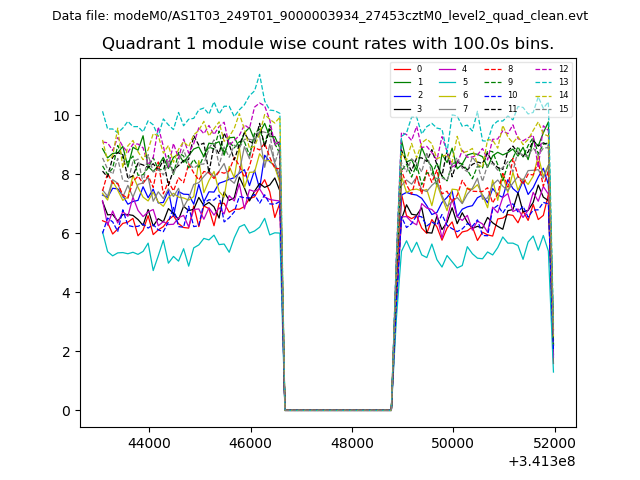
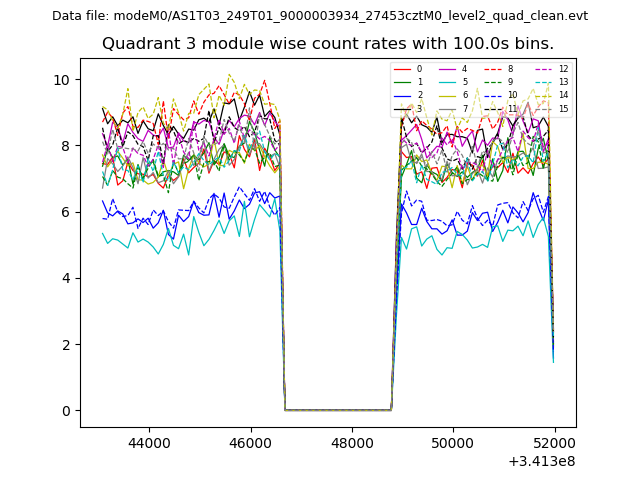
| Module-wise count rates for Quadrant A Data is divided into 100 sec bins |
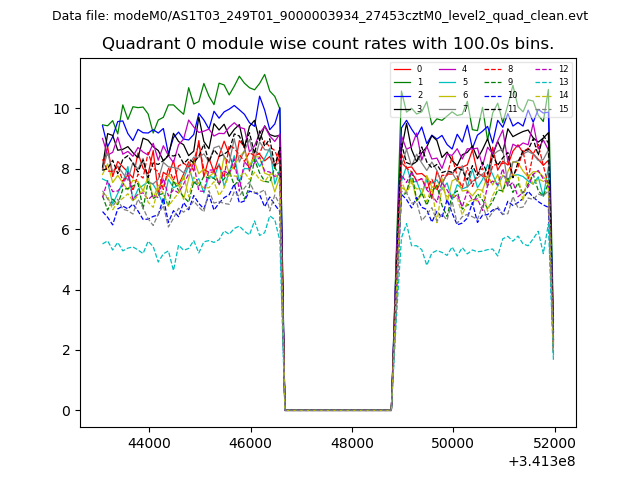 |
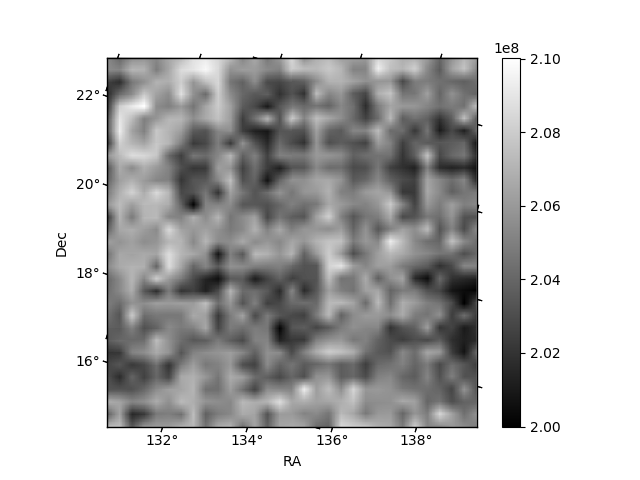 |
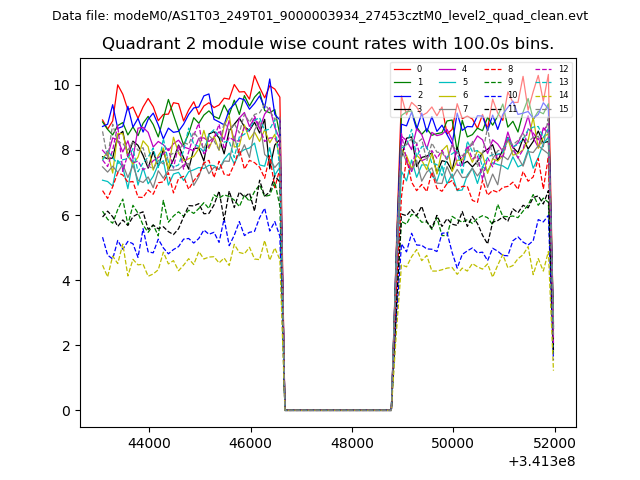
| Module-wise count rates for Quadrant B Data is divided into 100 sec bins |
 |
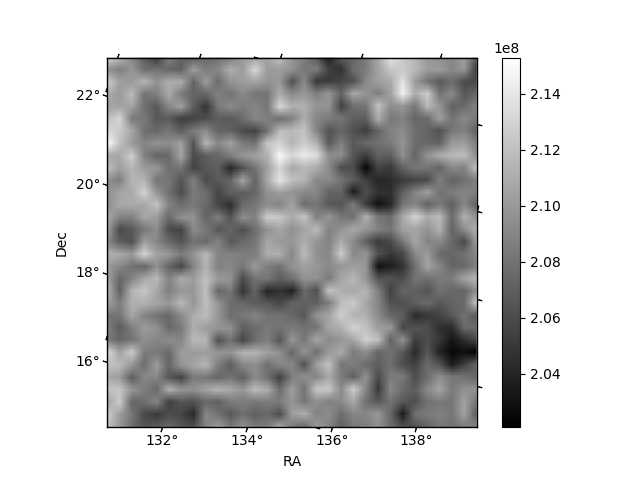 |
| Module-wise count rates for Quadrant C Data is divided into 100 sec bins |
 |
 |
| Module-wise count rates for Quadrant D Data is divided into 100 sec bins |
 |
 |
| Parameter | Plot |
|---|---|
| CZT HV Monitor | 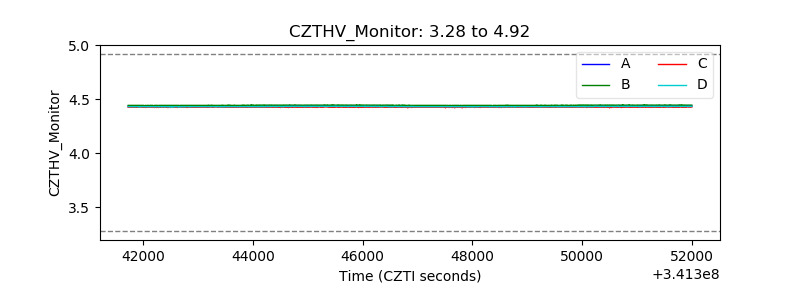 |
| D_VDD | 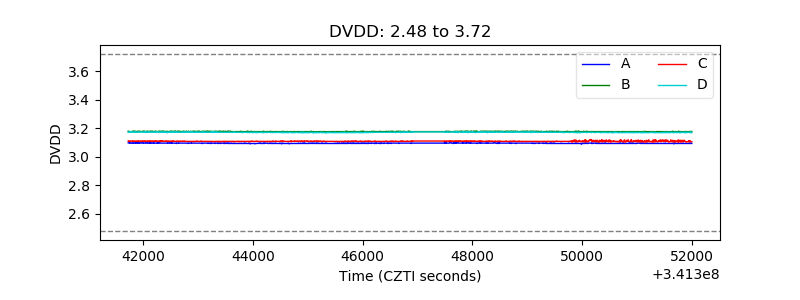 |
| Temperature 1 | 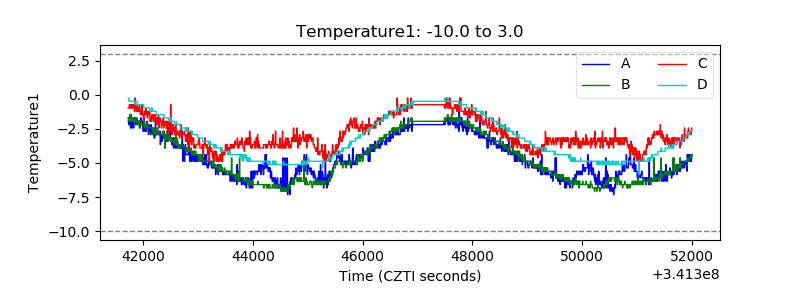 |
| Veto HV Monitor | 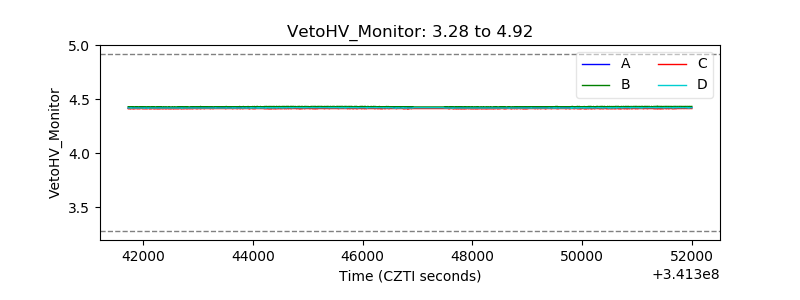 |
| Veto LLD | 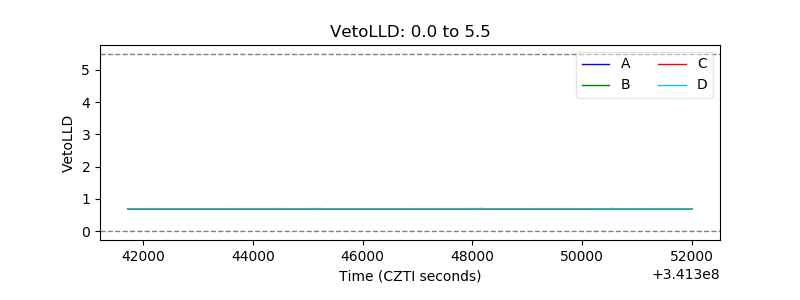 |
| Alpha Counter | 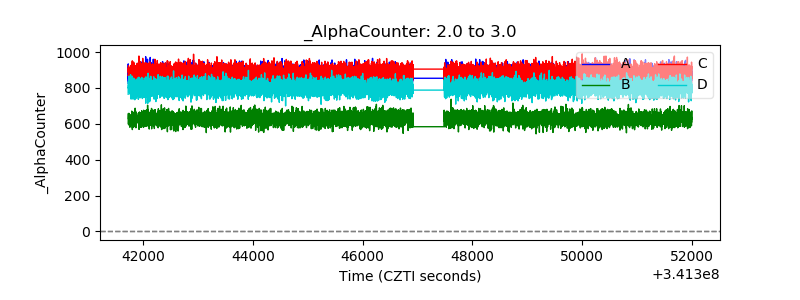 |
| _CPM_Rate | 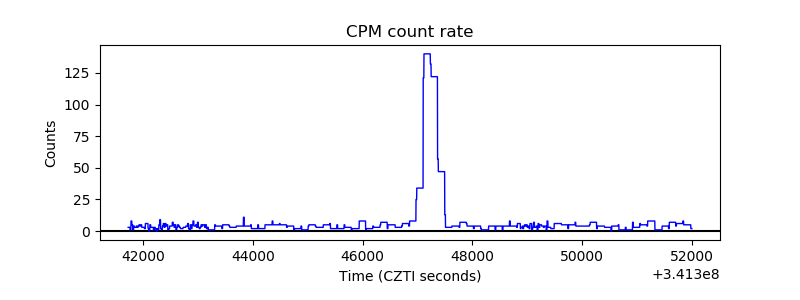 |
| CZT Counter | 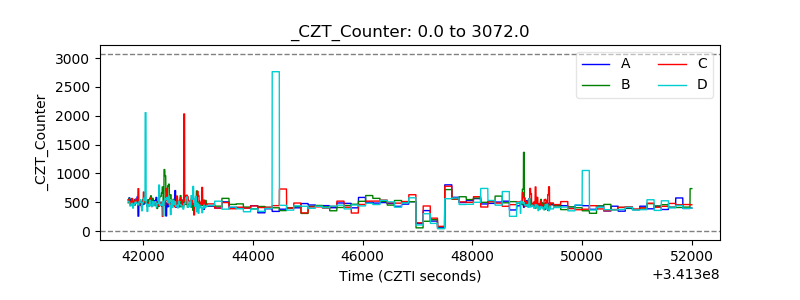 |
| +2.5 Volts monitor | 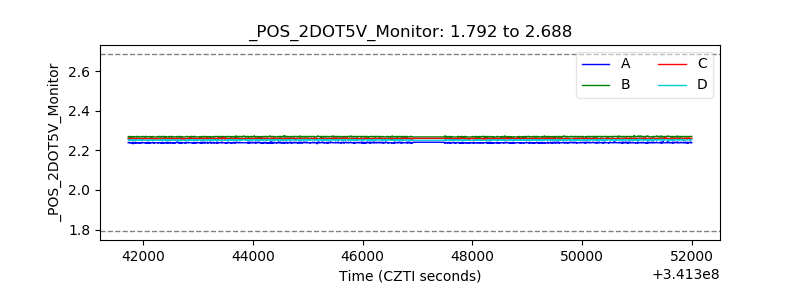 |
| +5 Volts monitor |  |
| _ROLL_ROT | 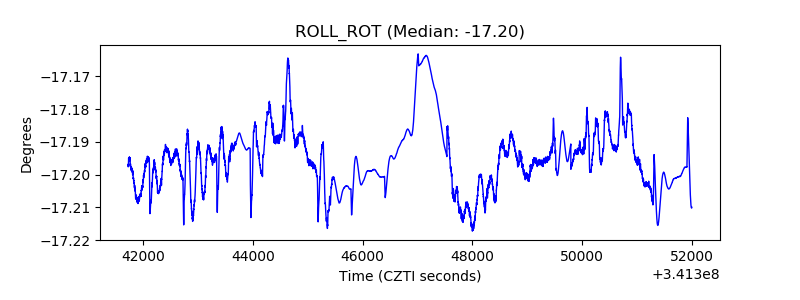 |
| _Roll_DEC | 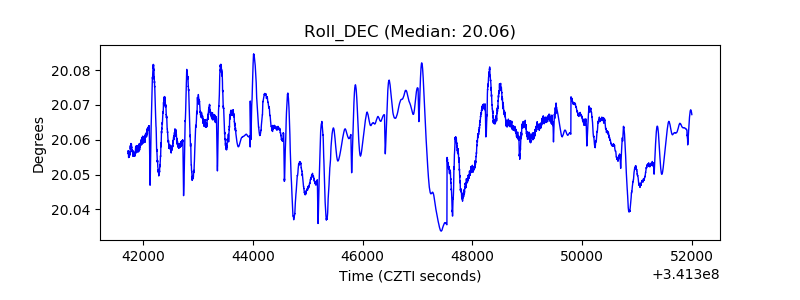 |
| _Roll_RA | 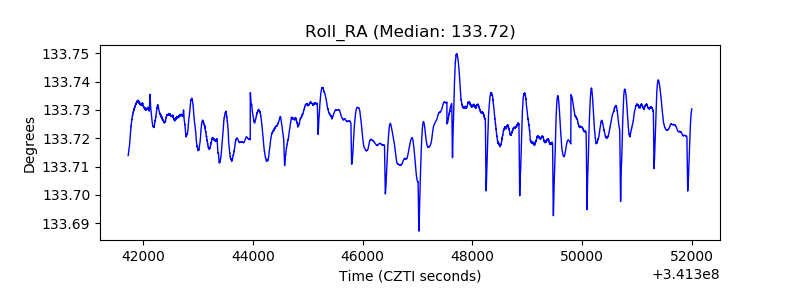 |
| Veto Counter | 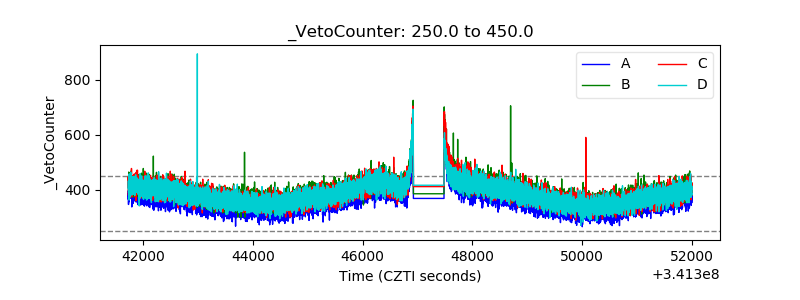 |