| Param | Original file | Final file |
|---|---|---|
| Filename | modeM0/AS1T03_249T01_9000003934_27454cztM0_level2.evt | modeM0/AS1T03_249T01_9000003934_27454cztM0_level2_quad_clean.evt |
| Size (bytes) | 909,748,800 | 191,165,760 |
| Size | 867.6 MB | 182.3 MB |
| Events in quadrant A | 6,496,436 | 1,238,883 |
| Events in quadrant B | 6,937,209 | 1,246,351 |
| Events in quadrant C | 6,639,744 | 1,186,640 |
| Events in quadrant D | 6,555,278 | 1,176,612 |
| Mode M0 | |||
|---|---|---|---|
| Quadrant | BADHDUFLAG | Total packets | Discarded packets |
| A | 0 | 28047 | 0 |
| B | 0 | 29363 | 0 |
| C | 0 | 28459 | 0 |
| D | 0 | 28956 | 0 |
| Mode M9 | |||
|---|---|---|---|
| Quadrant | BADHDUFLAG | Total packets | Discarded packets |
| A | 0 | 28 | 0 |
| B | 0 | 28 | 0 |
| C | 0 | 28 | 0 |
| D | 0 | 28 | 0 |
| Quadrant | Total seconds | Saturated seconds | Saturation percentage |
|---|---|---|---|
| A | 13642 | 73 | 0.535112% |
| B | 13643 | 203 | 1.487943% |
| C | 13643 | 167 | 1.224071% |
| D | 13642 | 104 | 0.762352% |
Noise dominated data is calculated using 1-second bins in cleaned event files. If a bin has >2000 counts, and if more than 50% of those come from <1% of pixels, then it is considered to be noise-dominated and hence unusable.
| Quadrant | # 1 sec bins | Bins with >0 counts | Bins with >2000 counts | High rate bins dominated by noise | Noise dominated (total time) | Noise dominated (detector-on time) | Marked lightcurve |
|---|---|---|---|---|---|---|---|
| A | 16292 | 13643 | 0 | 0 | 0.00% | 0.00% | 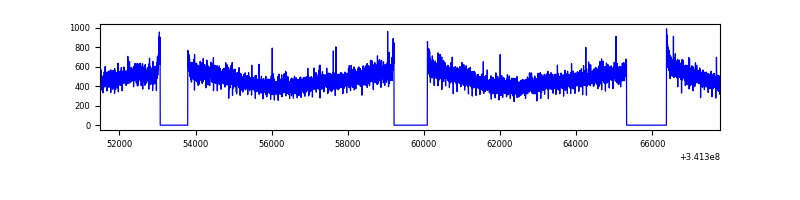 |
| B | 16293 | 13645 | 42 | 42 | 0.26% | 0.31% | 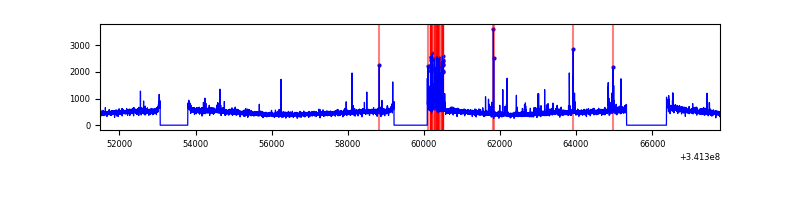 |
| C | 16293 | 13646 | 1 | 1 | 0.01% | 0.01% | 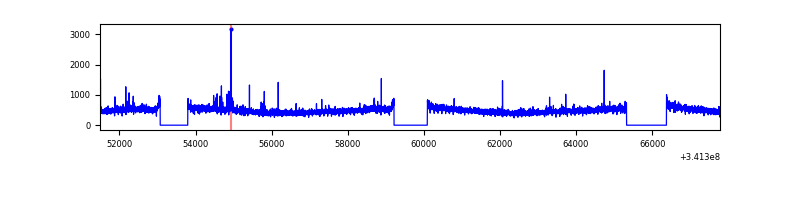 |
| D | 16292 | 13645 | 55 | 55 | 0.34% | 0.40% | 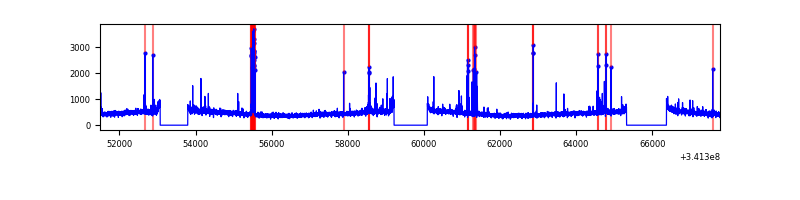 |
Top three noisy pixels from each quadrant. If the there are fewer than three noisy pixels in the level2.evt file, extra rows are filled as -1
| Pixel properties | Quadrant properties | ||||||
|---|---|---|---|---|---|---|---|
| Quadrant | DetID | PixID | Counts | Sigma | Mean | Median | Sigma |
| A | 13 | 254 | 22463 | 61.96 | 1683 | 1645 | 336.0 |
| A | 3 | 137 | 16173 | 43.24 | 1683 | 1645 | 336.0 |
| A | 0 | 226 | 14171 | 37.28 | 1683 | 1645 | 336.0 |
| B | 3 | 64 | 353233 | 1110.65 | 1664 | 1625 | 316.6 |
| B | 12 | 111 | 39472 | 119.55 | 1664 | 1625 | 316.6 |
| B | 11 | 111 | 36187 | 109.17 | 1664 | 1625 | 316.6 |
| C | 14 | 238 | 259542 | 679.02 | 1609 | 1616 | 379.9 |
| C | 2 | 16 | 71887 | 185.0 | 1609 | 1616 | 379.9 |
| C | 10 | 22 | 34861 | 87.52 | 1609 | 1616 | 379.9 |
| D | 2 | 250 | 338377 | 876.47 | 1625 | 1585 | 384.3 |
| D | 2 | 234 | 57615 | 145.81 | 1625 | 1585 | 384.3 |
| D | 2 | 120 | 38513 | 96.1 | 1625 | 1585 | 384.3 |
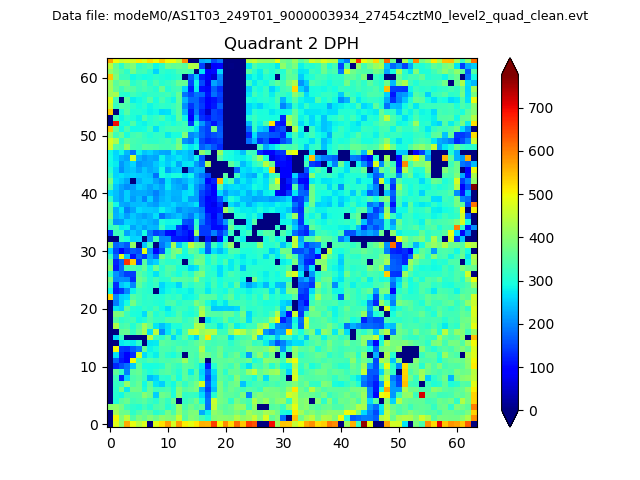
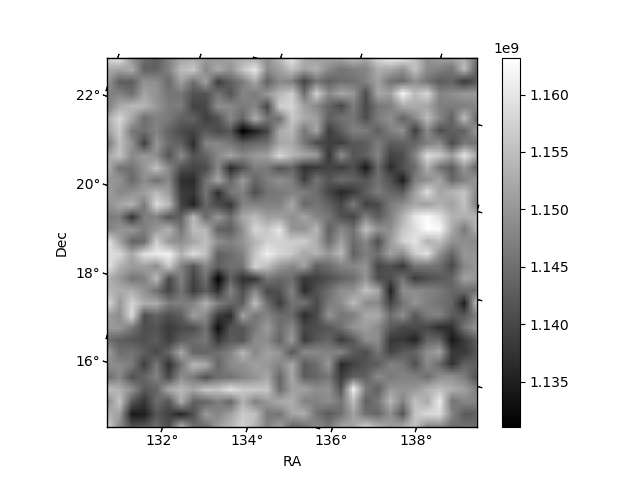
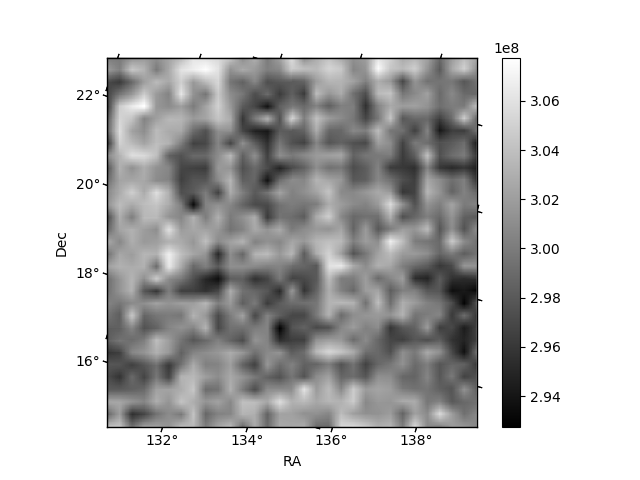
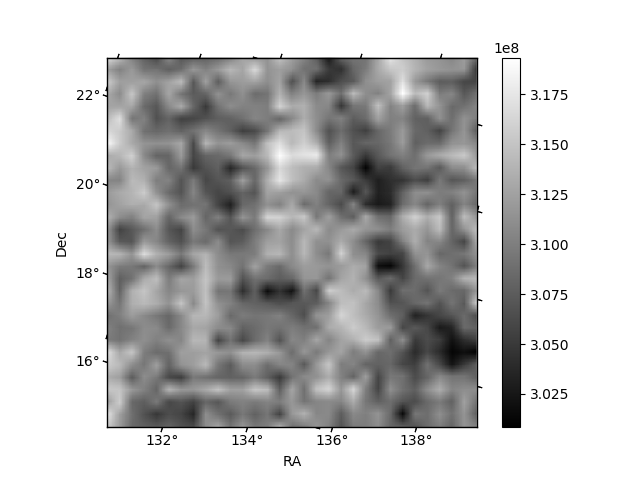
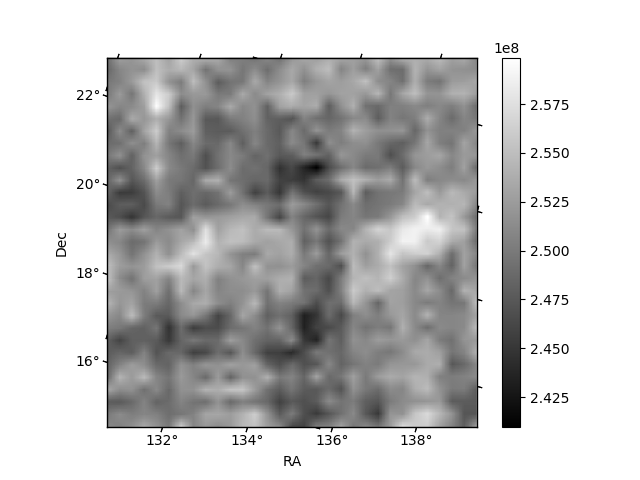
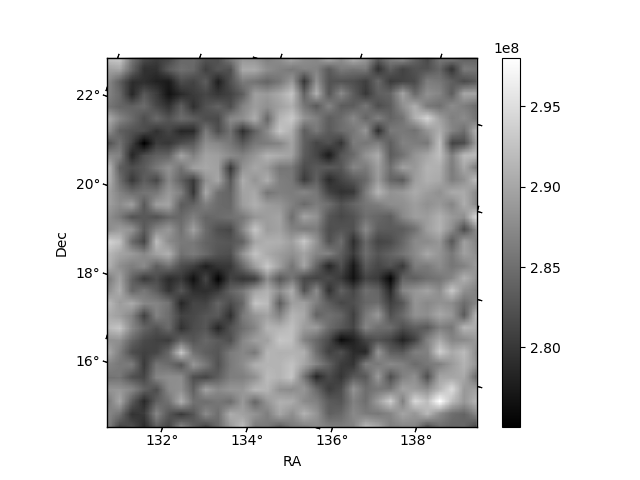
Histogram calculated using DETX and DETY for each event in the final _common_clean file
| Quadrant A | 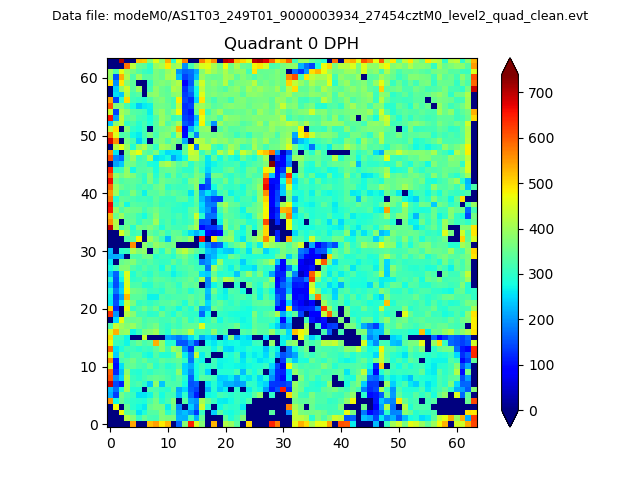 |
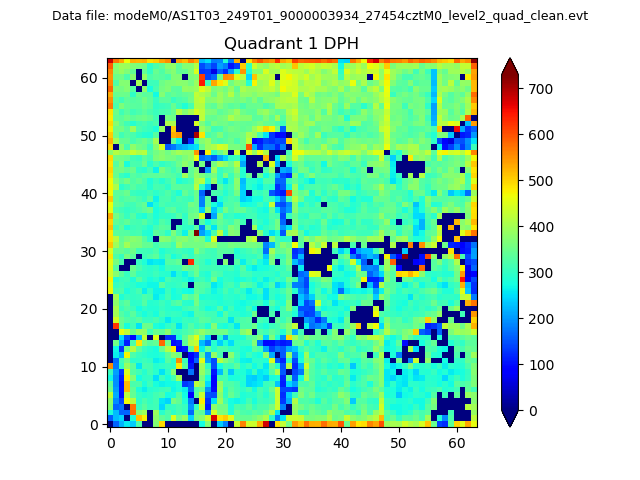 |
Quadrant B |
|---|---|---|---|
| Quadrant D | 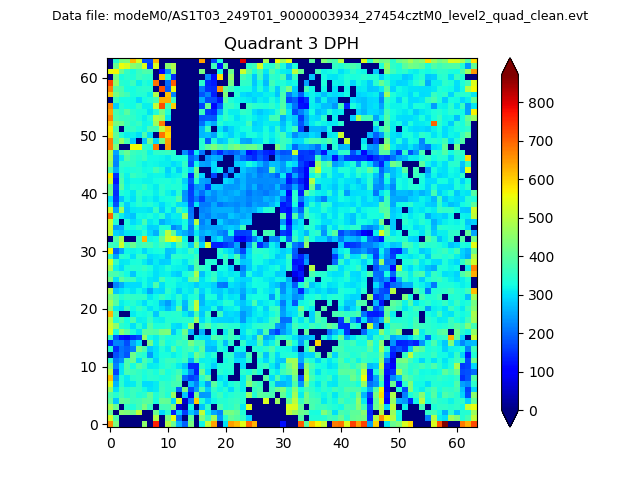 |
 |
Quadrant C |
| Plot type | Count rate plots | Images |
|---|---|---|
| Comparison with Poisson distribution Blue bars denote a histogram of data divided into 1 sec bins. Red curve is a Poisson curve with rate = median count rate of data. |
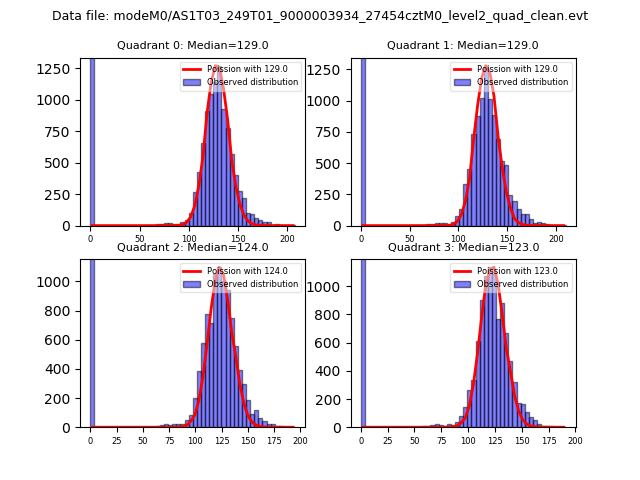 |
 |
| Quadrant-wise count rates Data is divided into 100 sec bins |
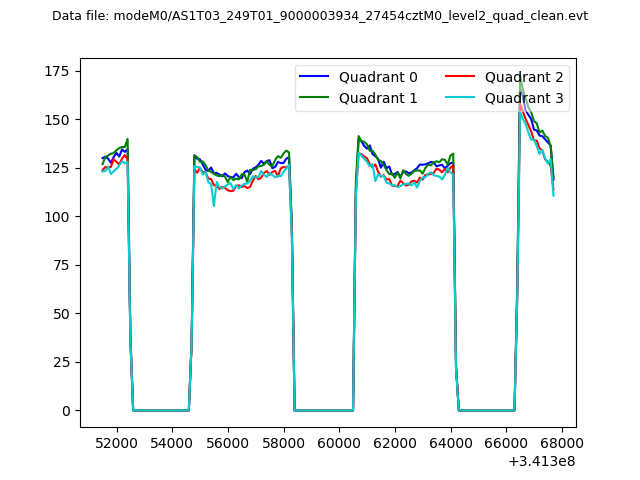 |
|
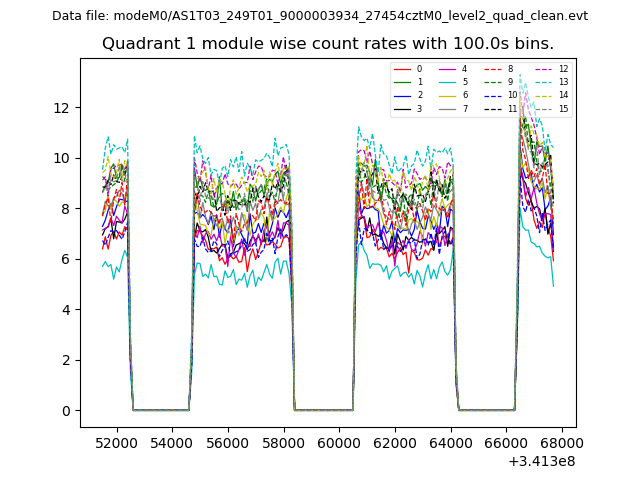
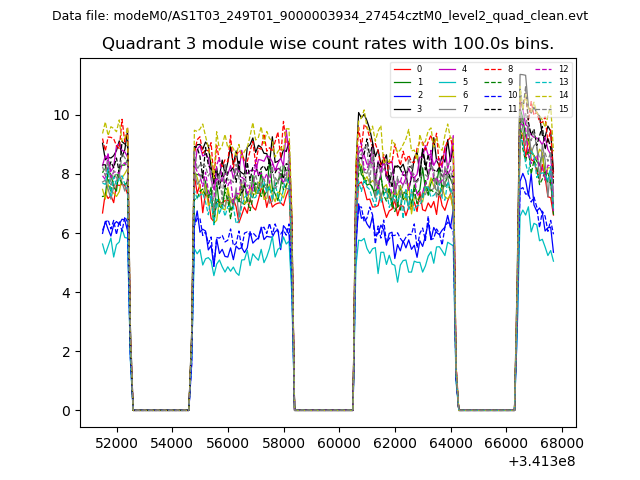
| Module-wise count rates for Quadrant A Data is divided into 100 sec bins |
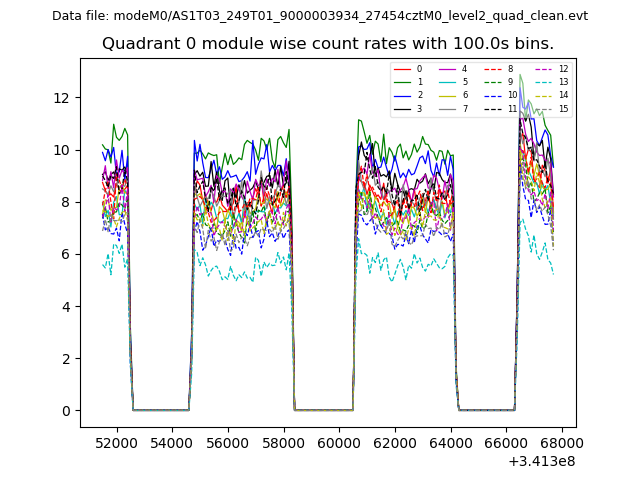 |
 |
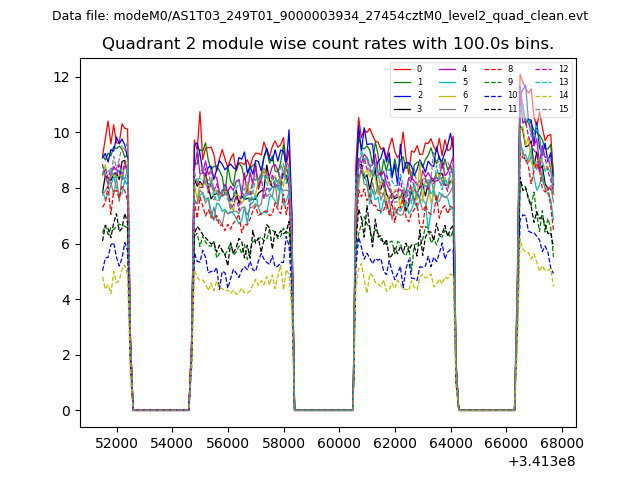
| Module-wise count rates for Quadrant B Data is divided into 100 sec bins |
 |
 |
| Module-wise count rates for Quadrant C Data is divided into 100 sec bins |
 |
 |
| Module-wise count rates for Quadrant D Data is divided into 100 sec bins |
 |
 |
| Parameter | Plot |
|---|---|
| CZT HV Monitor | 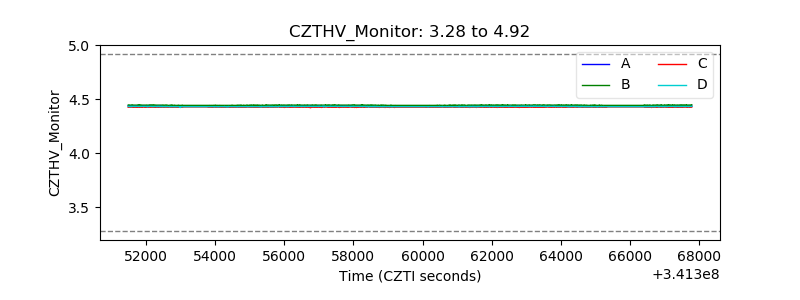 |
| D_VDD | 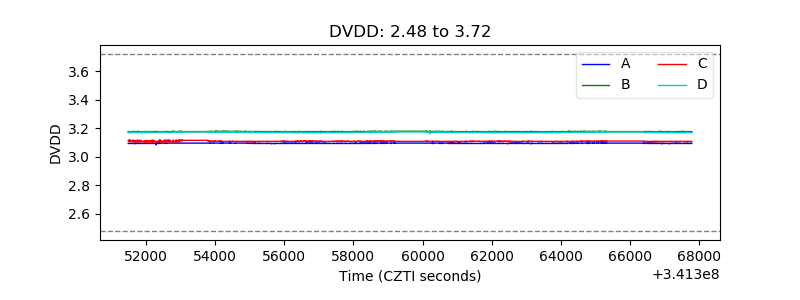 |
| Temperature 1 | 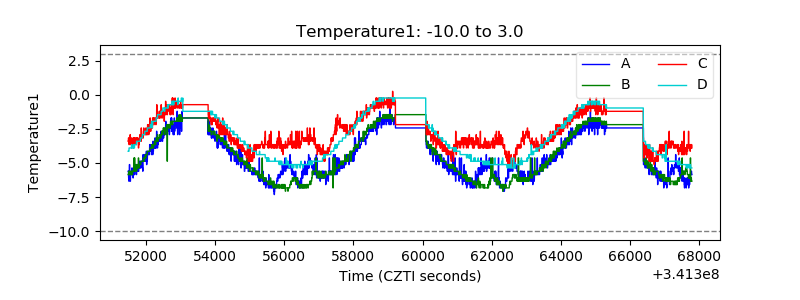 |
| Veto HV Monitor |  |
| Veto LLD | 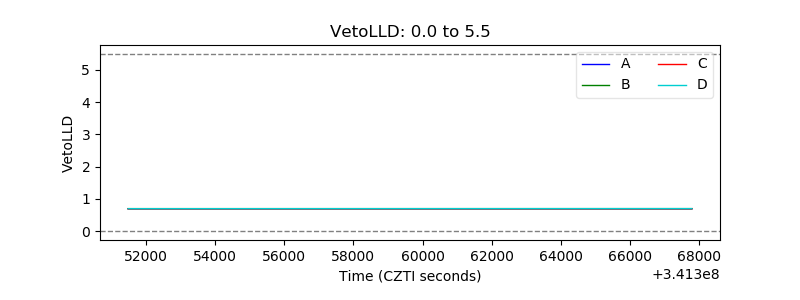 |
| Alpha Counter | 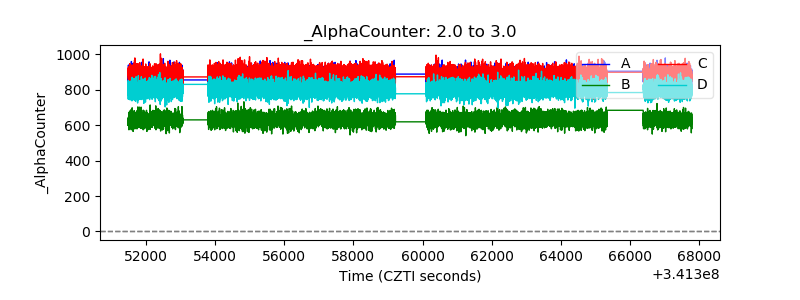 |
| _CPM_Rate | 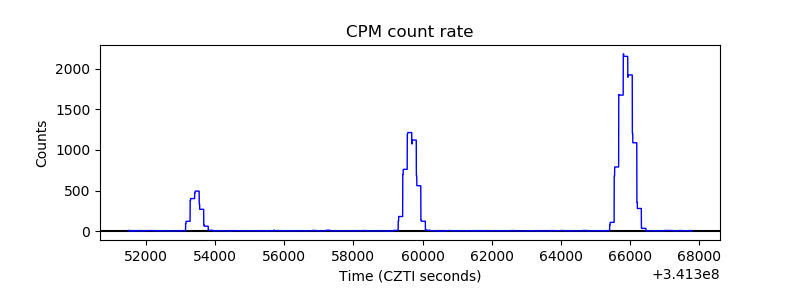 |
| CZT Counter | 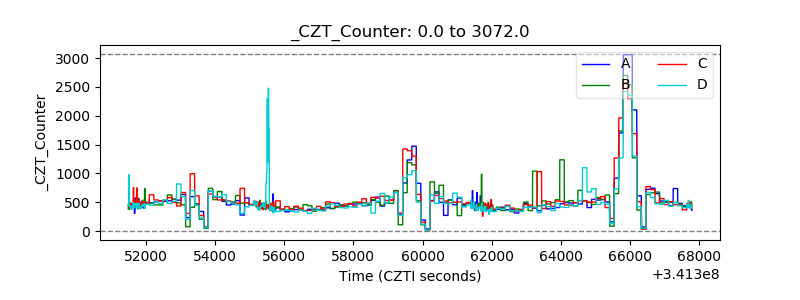 |
| +2.5 Volts monitor | 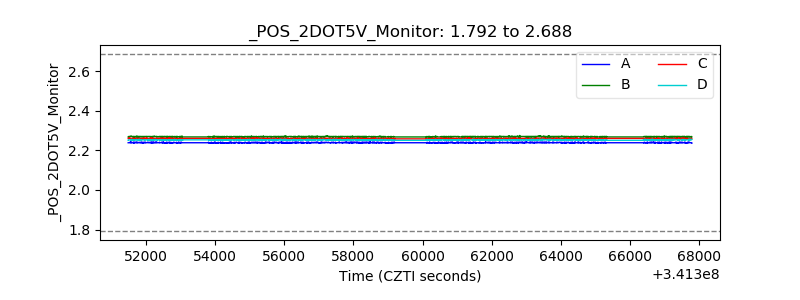 |
| +5 Volts monitor | 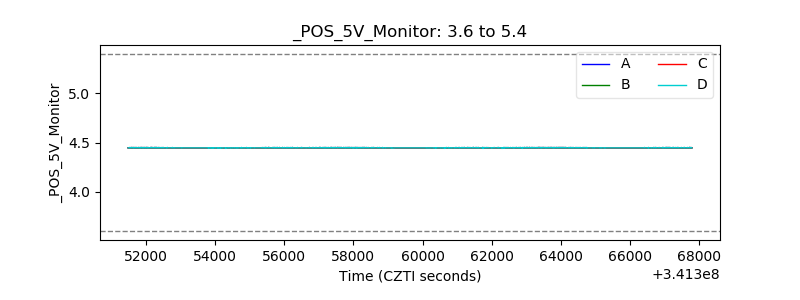 |
| _ROLL_ROT |  |
| _Roll_DEC | 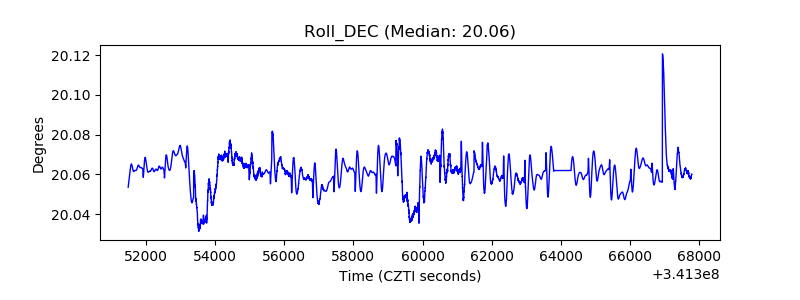 |
| _Roll_RA | 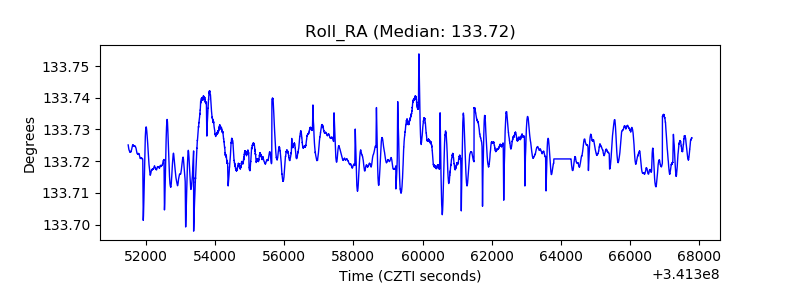 |
| Veto Counter |  |