| Param | Original file | Final file |
|---|---|---|
| Filename | modeM0/AS1T03_249T01_9000003934_27458cztM0_level2.evt | modeM0/AS1T03_249T01_9000003934_27458cztM0_level2_quad_clean.evt |
| Size (bytes) | 450,106,560 | 104,083,200 |
| Size | 429.3 MB | 99.3 MB |
| Events in quadrant A | 3,296,829 | 689,835 |
| Events in quadrant B | 3,440,123 | 706,310 |
| Events in quadrant C | 3,317,692 | 661,908 |
| Events in quadrant D | 3,138,586 | 644,170 |
| Mode M0 | |||
|---|---|---|---|
| Quadrant | BADHDUFLAG | Total packets | Discarded packets |
| A | 0 | 13569 | 0 |
| B | 0 | 14054 | 0 |
| C | 0 | 13696 | 0 |
| D | 0 | 13417 | 0 |
| Mode M9 | |||
|---|---|---|---|
| Quadrant | BADHDUFLAG | Total packets | Discarded packets |
| A | 0 | 18 | 0 |
| B | 0 | 19 | 0 |
| C | 0 | 19 | 0 |
| D | 0 | 19 | 0 |
| Quadrant | Total seconds | Saturated seconds | Saturation percentage |
|---|---|---|---|
| A | 6447 | 13 | 0.201644% |
| B | 6447 | 41 | 0.635955% |
| C | 6447 | 54 | 0.837599% |
| D | 6446 | 9 | 0.139621% |
Noise dominated data is calculated using 1-second bins in cleaned event files. If a bin has >2000 counts, and if more than 50% of those come from <1% of pixels, then it is considered to be noise-dominated and hence unusable.
| Quadrant | # 1 sec bins | Bins with >0 counts | Bins with >2000 counts | High rate bins dominated by noise | Noise dominated (total time) | Noise dominated (detector-on time) | Marked lightcurve |
|---|---|---|---|---|---|---|---|
| A | 7782 | 6448 | 0 | 0 | 0.00% | 0.00% | 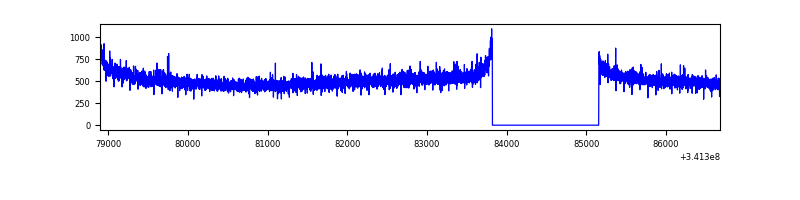 |
| B | 7782 | 6447 | 5 | 5 | 0.06% | 0.08% | 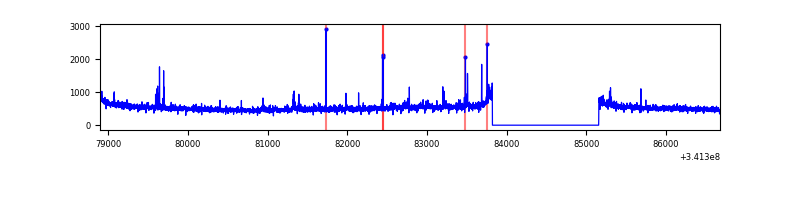 |
| C | 7782 | 6448 | 0 | 0 | 0.00% | 0.00% | 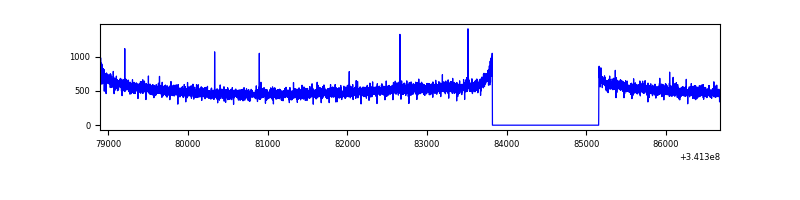 |
| D | 7781 | 6447 | 4 | 4 | 0.05% | 0.06% | 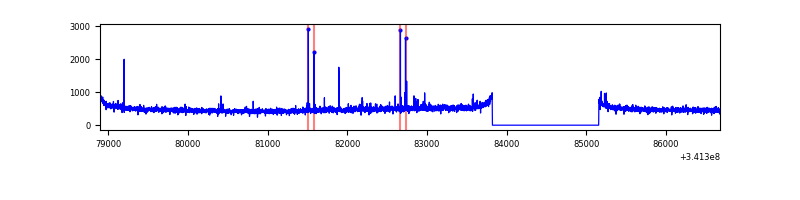 |
Top three noisy pixels from each quadrant. If the there are fewer than three noisy pixels in the level2.evt file, extra rows are filled as -1
| Pixel properties | Quadrant properties | ||||||
|---|---|---|---|---|---|---|---|
| Quadrant | DetID | PixID | Counts | Sigma | Mean | Median | Sigma |
| A | 13 | 254 | 9891 | 53.39 | 855 | 839 | 169.5 |
| A | 3 | 137 | 7503 | 39.31 | 855 | 839 | 169.5 |
| A | 0 | 226 | 7398 | 38.69 | 855 | 839 | 169.5 |
| B | 3 | 64 | 64433 | 401.94 | 851 | 832 | 158.2 |
| B | 15 | 32 | 22831 | 139.03 | 851 | 832 | 158.2 |
| B | 12 | 111 | 18625 | 112.45 | 851 | 832 | 158.2 |
| C | 14 | 238 | 134193 | 703.09 | 814 | 821 | 189.7 |
| C | 13 | 61 | 5563 | 25.0 | 814 | 821 | 189.7 |
| C | 2 | 16 | 5536 | 24.86 | 814 | 821 | 189.7 |
| D | 2 | 234 | 24944 | 125.12 | 818 | 798 | 193.0 |
| D | 2 | 250 | 19277 | 95.76 | 818 | 798 | 193.0 |
| D | 2 | 120 | 13754 | 67.14 | 818 | 798 | 193.0 |
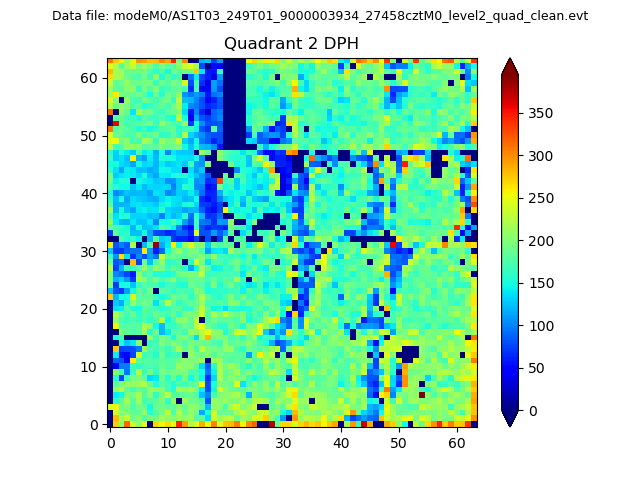
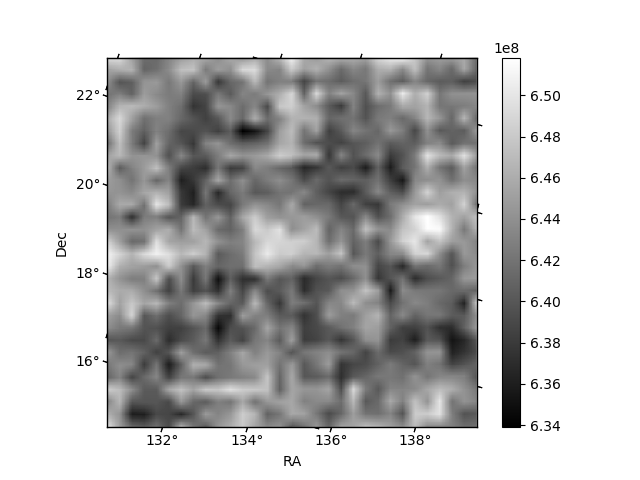
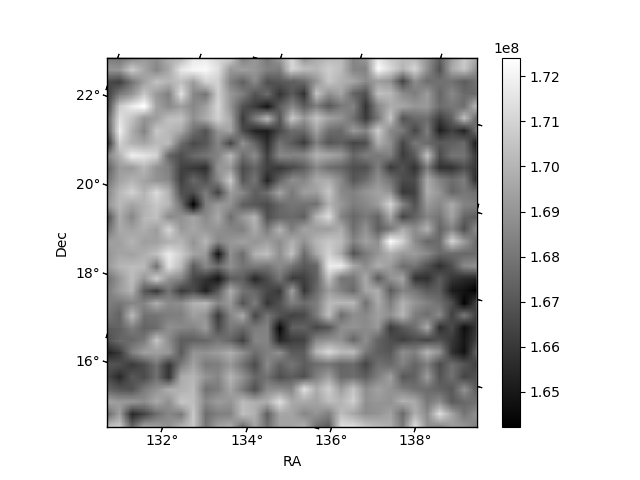
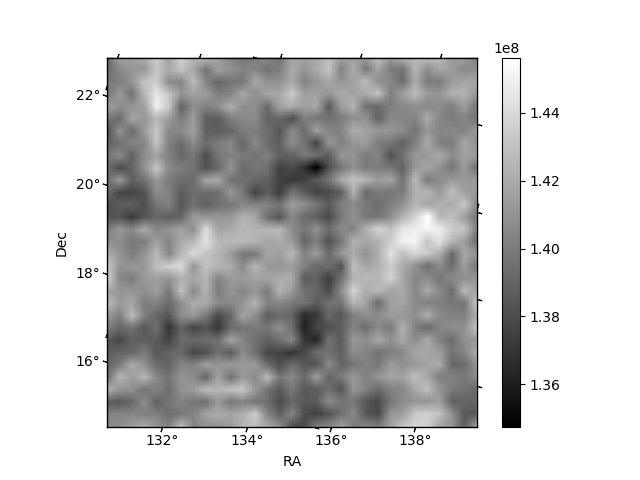
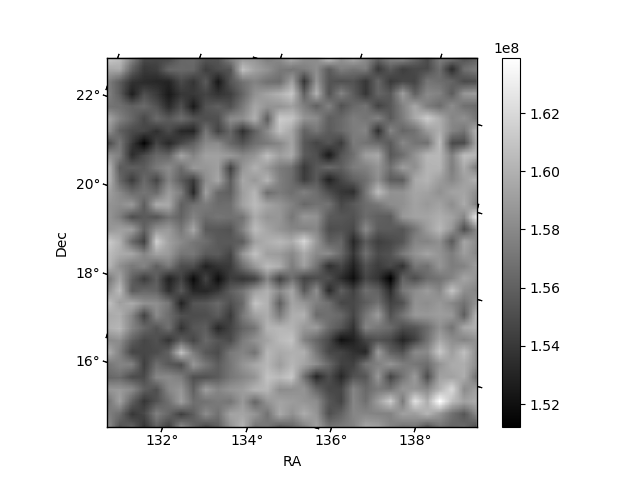
Histogram calculated using DETX and DETY for each event in the final _common_clean file
| Quadrant A | 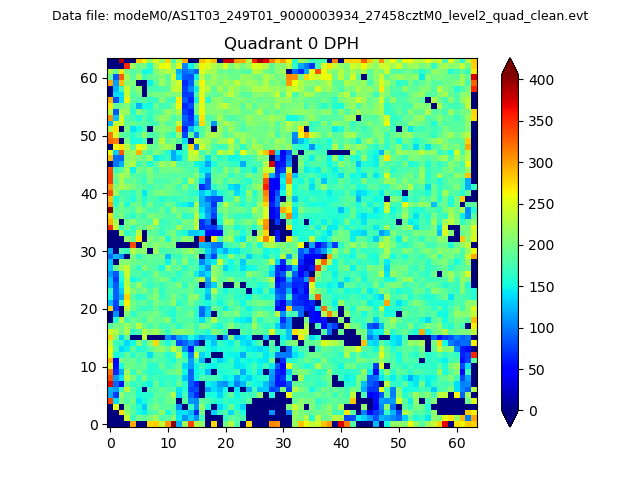 |
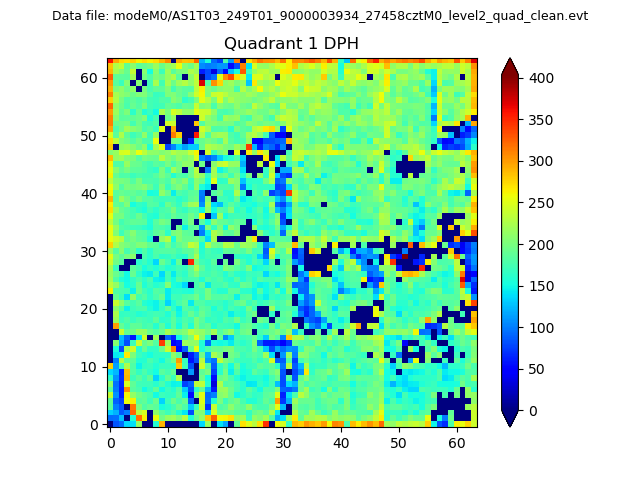 |
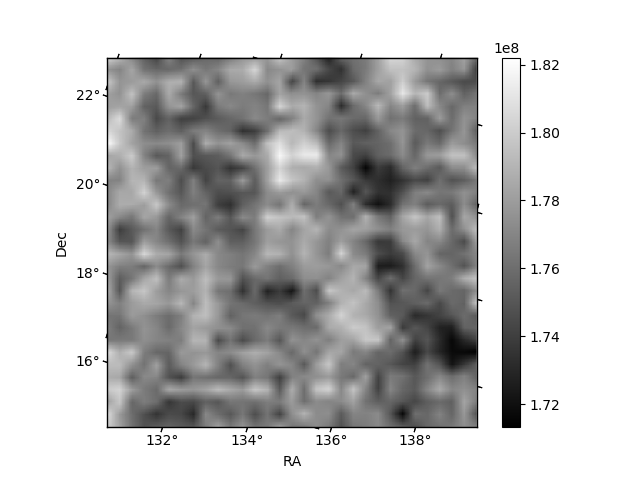
Quadrant B |
|---|---|---|---|
| Quadrant D | 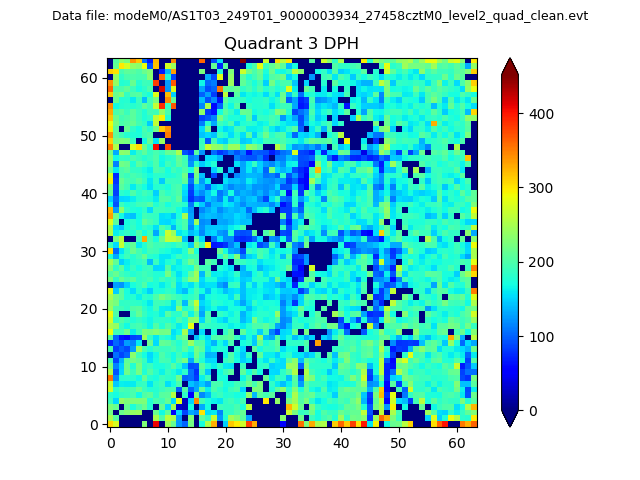 |
 |
Quadrant C |
| Plot type | Count rate plots | Images |
|---|---|---|
| Comparison with Poisson distribution Blue bars denote a histogram of data divided into 1 sec bins. Red curve is a Poisson curve with rate = median count rate of data. |
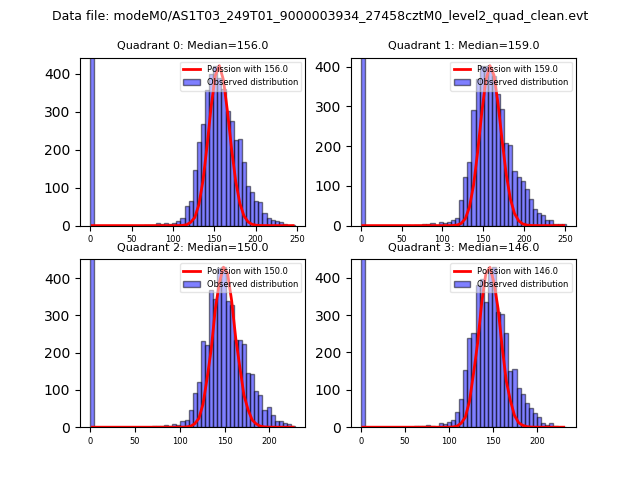 |
 |
| Quadrant-wise count rates Data is divided into 100 sec bins |
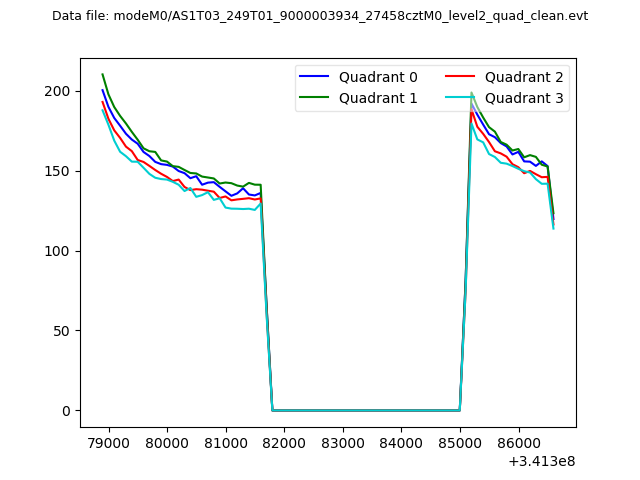 |
|
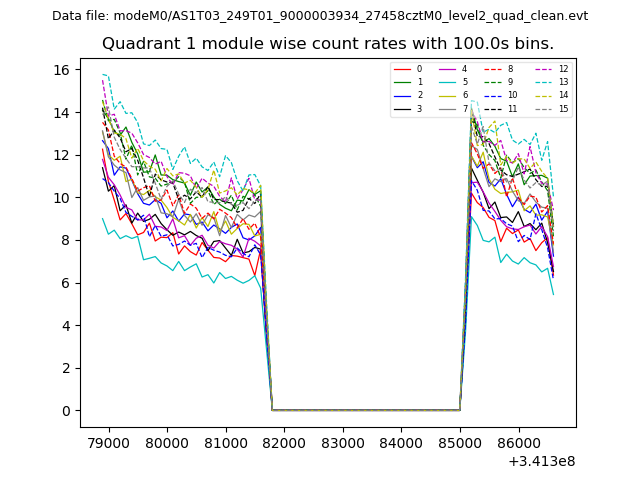
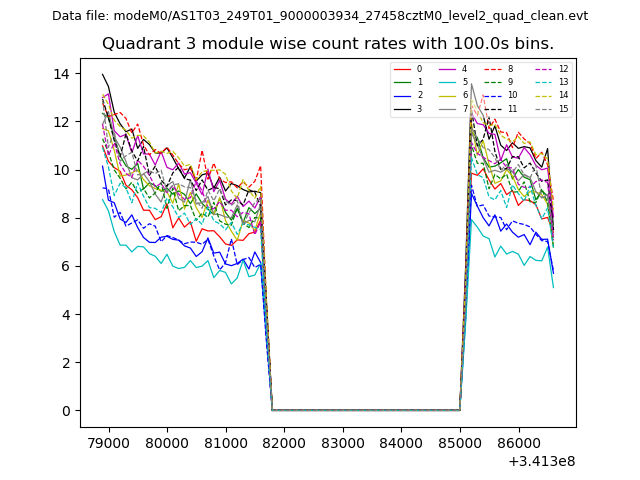
| Module-wise count rates for Quadrant A Data is divided into 100 sec bins |
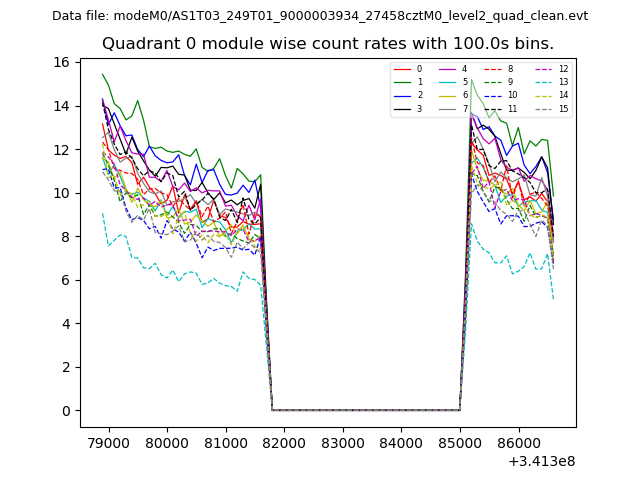 |
 |
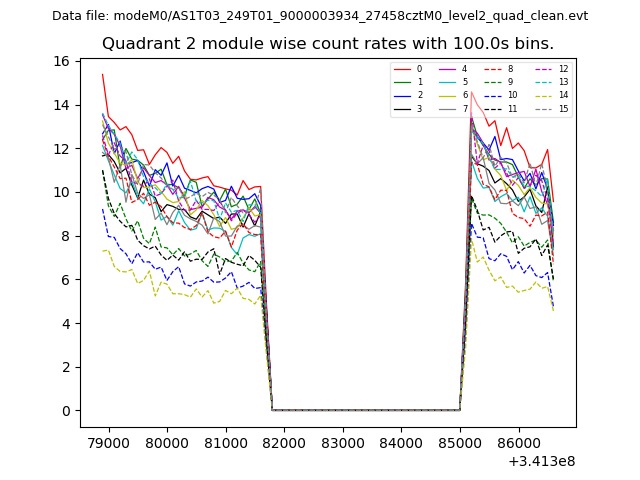
| Module-wise count rates for Quadrant B Data is divided into 100 sec bins |
 |
 |
| Module-wise count rates for Quadrant C Data is divided into 100 sec bins |
 |
 |
| Module-wise count rates for Quadrant D Data is divided into 100 sec bins |
 |
 |
| Parameter | Plot |
|---|---|
| CZT HV Monitor | 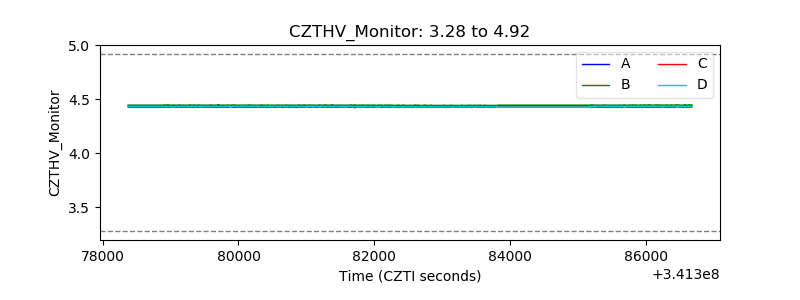 |
| D_VDD | 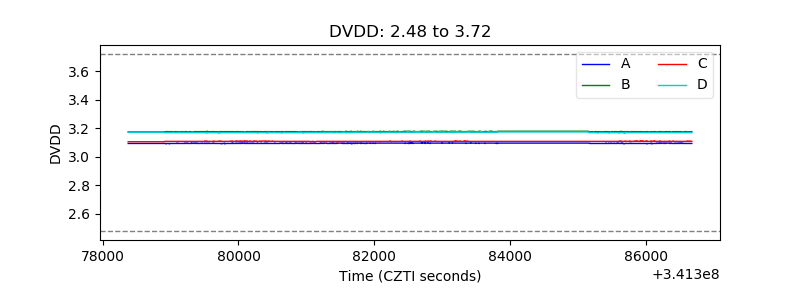 |
| Temperature 1 | 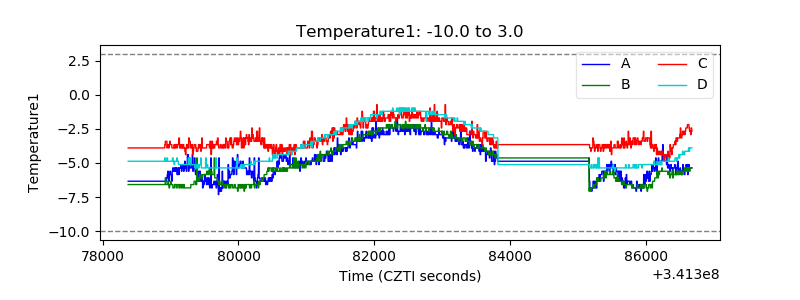 |
| Veto HV Monitor | 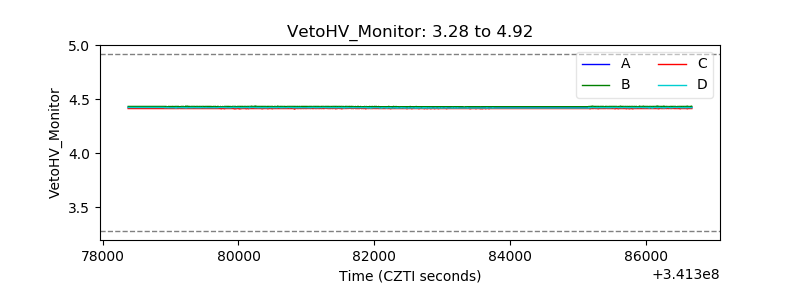 |
| Veto LLD | 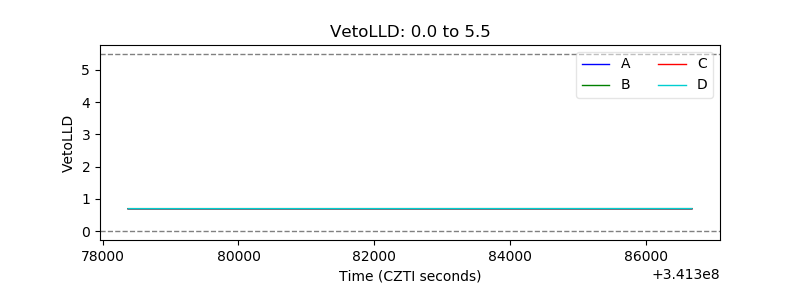 |
| Alpha Counter | 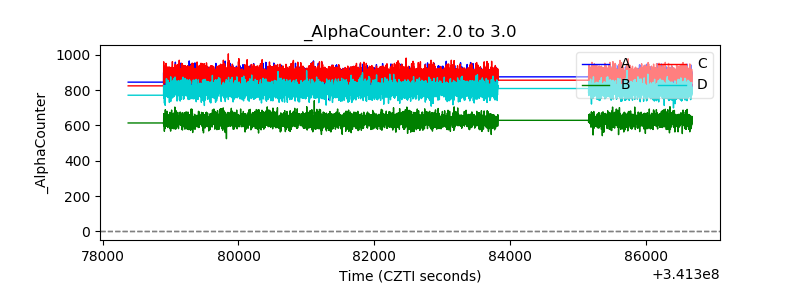 |
| _CPM_Rate | 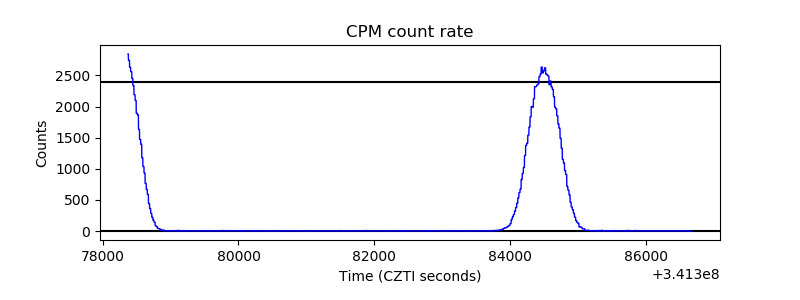 |
| CZT Counter | 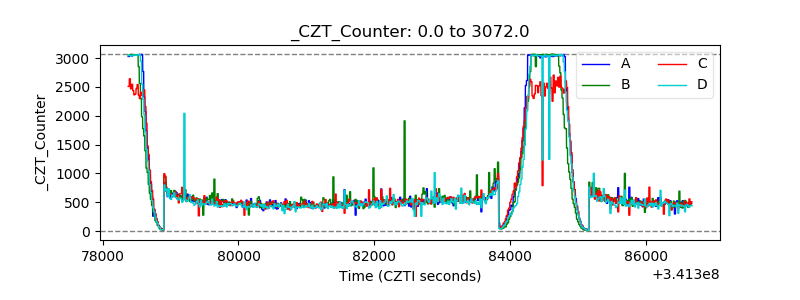 |
| +2.5 Volts monitor |  |
| +5 Volts monitor |  |
| _ROLL_ROT | 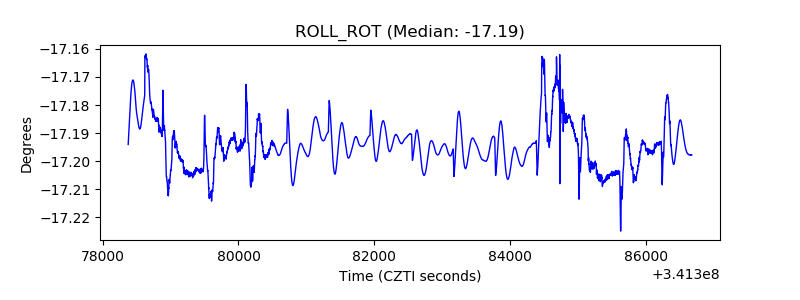 |
| _Roll_DEC | 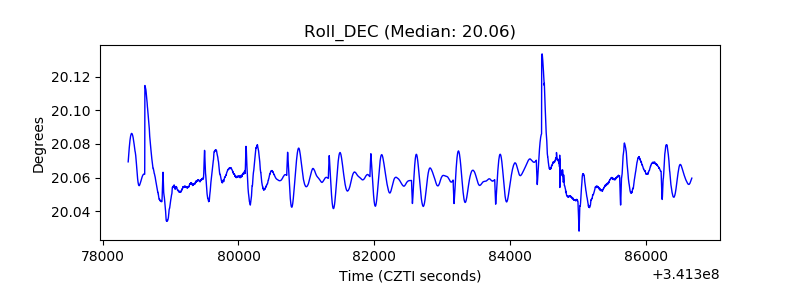 |
| _Roll_RA |  |
| Veto Counter | 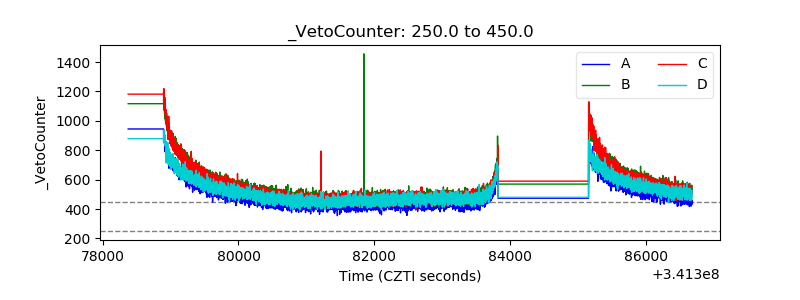 |