| Param | Original file | Final file |
|---|---|---|
| Filename | modeM0/AS1T03_249T01_9000003934_27459cztM0_level2.evt | modeM0/AS1T03_249T01_9000003934_27459cztM0_level2_quad_clean.evt |
| Size (bytes) | 436,475,520 | 94,680,000 |
| Size | 416.3 MB | 90.3 MB |
| Events in quadrant A | 3,200,517 | 621,253 |
| Events in quadrant B | 3,265,672 | 630,534 |
| Events in quadrant C | 3,211,671 | 597,356 |
| Events in quadrant D | 3,117,534 | 583,590 |
| Mode M0 | |||
|---|---|---|---|
| Quadrant | BADHDUFLAG | Total packets | Discarded packets |
| A | 0 | 13027 | 0 |
| B | 0 | 13250 | 0 |
| C | 0 | 13080 | 0 |
| D | 0 | 13184 | 0 |
| Mode M9 | |||
|---|---|---|---|
| Quadrant | BADHDUFLAG | Total packets | Discarded packets |
| A | 0 | 12 | 0 |
| B | 0 | 12 | 0 |
| C | 0 | 12 | 0 |
| D | 0 | 12 | 0 |
| Quadrant | Total seconds | Saturated seconds | Saturation percentage |
|---|---|---|---|
| A | 6221 | 70 | 1.125221% |
| B | 6222 | 102 | 1.639344% |
| C | 6222 | 104 | 1.671488% |
| D | 6222 | 39 | 0.626808% |
Noise dominated data is calculated using 1-second bins in cleaned event files. If a bin has >2000 counts, and if more than 50% of those come from <1% of pixels, then it is considered to be noise-dominated and hence unusable.
| Quadrant | # 1 sec bins | Bins with >0 counts | Bins with >2000 counts | High rate bins dominated by noise | Noise dominated (total time) | Noise dominated (detector-on time) | Marked lightcurve |
|---|---|---|---|---|---|---|---|
| A | 7481 | 6221 | 0 | 0 | 0.00% | 0.00% | 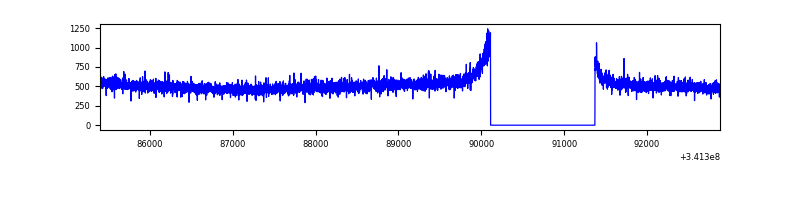 |
| B | 7482 | 6222 | 1 | 1 | 0.01% | 0.02% | 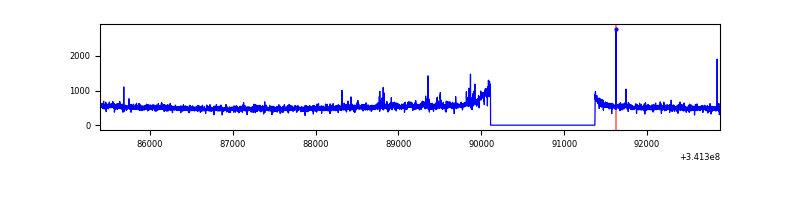 |
| C | 7482 | 6222 | 1 | 1 | 0.01% | 0.02% | 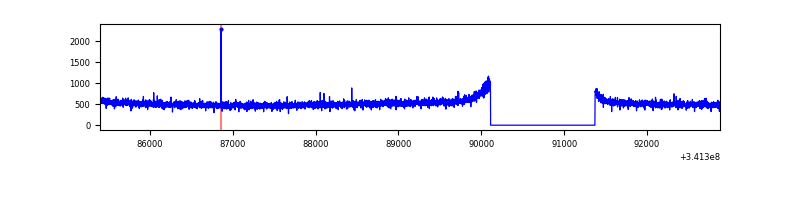 |
| D | 7482 | 6223 | 3 | 3 | 0.04% | 0.05% | 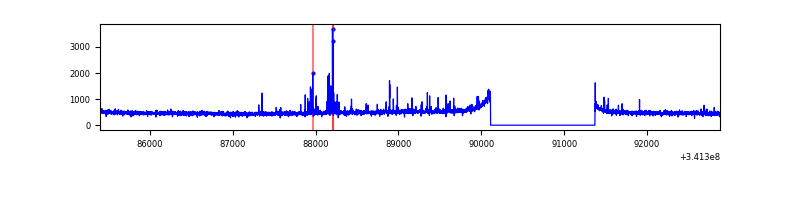 |
Top three noisy pixels from each quadrant. If the there are fewer than three noisy pixels in the level2.evt file, extra rows are filled as -1
| Pixel properties | Quadrant properties | ||||||
|---|---|---|---|---|---|---|---|
| Quadrant | DetID | PixID | Counts | Sigma | Mean | Median | Sigma |
| A | 13 | 254 | 10077 | 56.25 | 829 | 816 | 164.6 |
| A | 3 | 137 | 7166 | 38.57 | 829 | 816 | 164.6 |
| A | 0 | 226 | 7096 | 38.15 | 829 | 816 | 164.6 |
| B | 3 | 64 | 19053 | 118.56 | 819 | 800 | 154.0 |
| B | 12 | 111 | 18213 | 113.11 | 819 | 800 | 154.0 |
| B | 11 | 111 | 16469 | 101.78 | 819 | 800 | 154.0 |
| C | 14 | 238 | 128976 | 693.79 | 789 | 794 | 184.8 |
| C | 2 | 16 | 6631 | 31.59 | 789 | 794 | 184.8 |
| C | 13 | 61 | 5460 | 25.26 | 789 | 794 | 184.8 |
| D | 2 | 250 | 61732 | 325.15 | 797 | 778 | 187.5 |
| D | 2 | 234 | 24942 | 128.9 | 797 | 778 | 187.5 |
| D | 1 | 52 | 16302 | 82.81 | 797 | 778 | 187.5 |
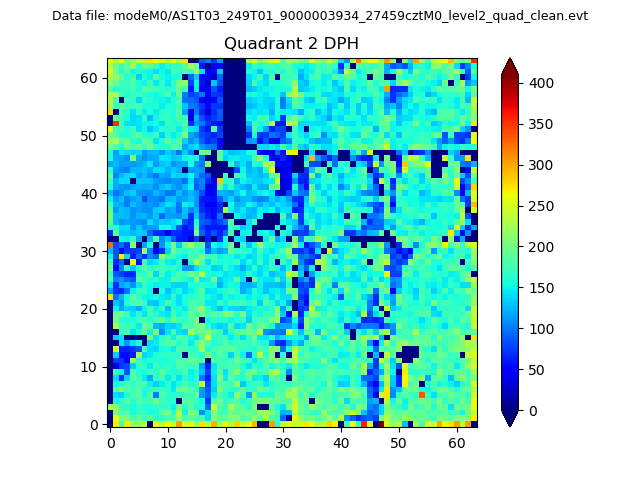
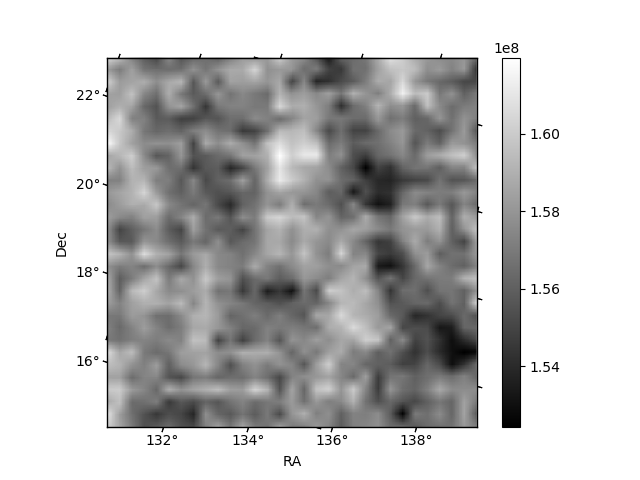
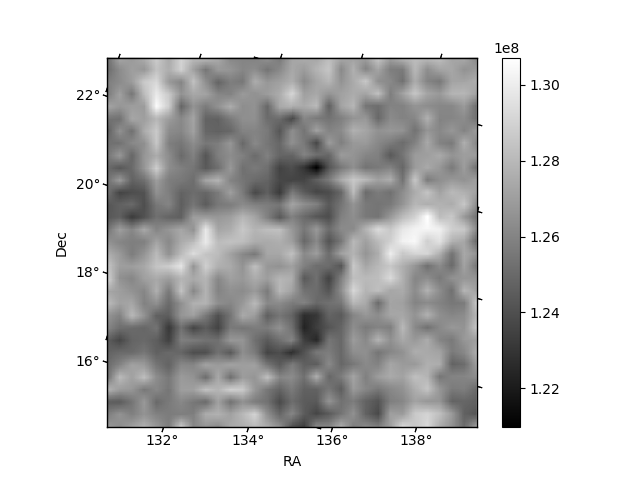
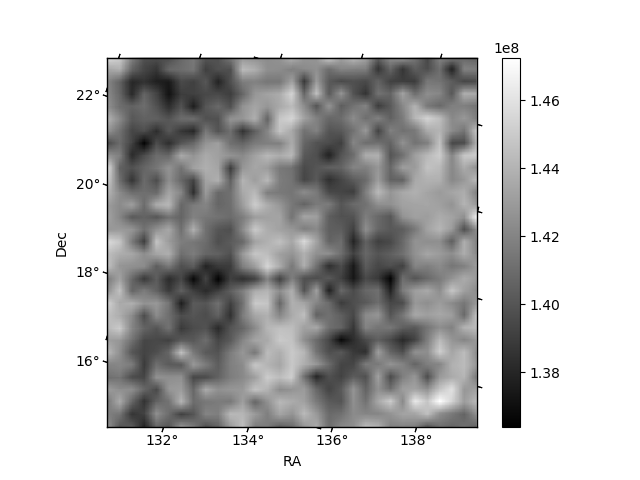
Histogram calculated using DETX and DETY for each event in the final _common_clean file
| Quadrant A | 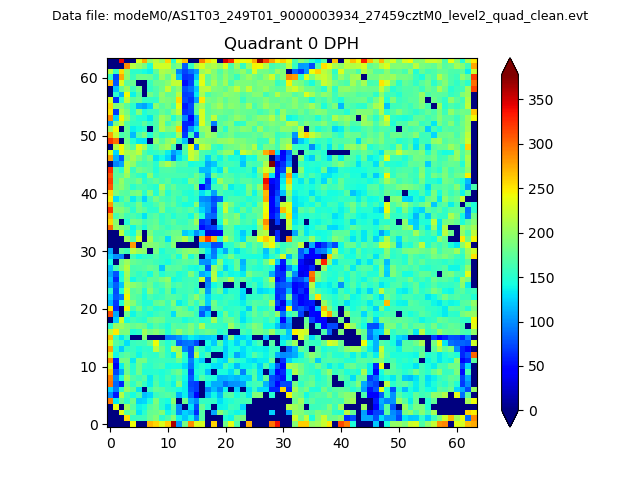 |
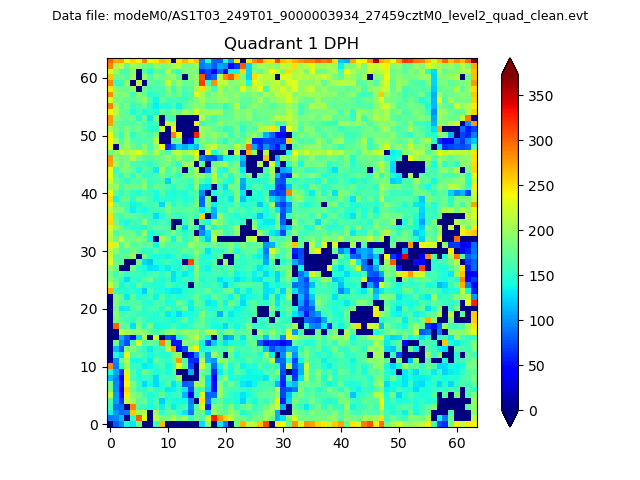 |
Quadrant B |
|---|---|---|---|
| Quadrant D | 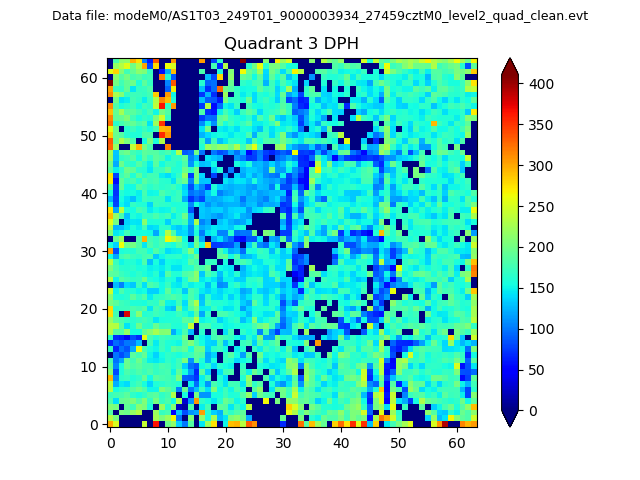 |
 |
Quadrant C |
| Plot type | Count rate plots | Images |
|---|---|---|
| Comparison with Poisson distribution Blue bars denote a histogram of data divided into 1 sec bins. Red curve is a Poisson curve with rate = median count rate of data. |
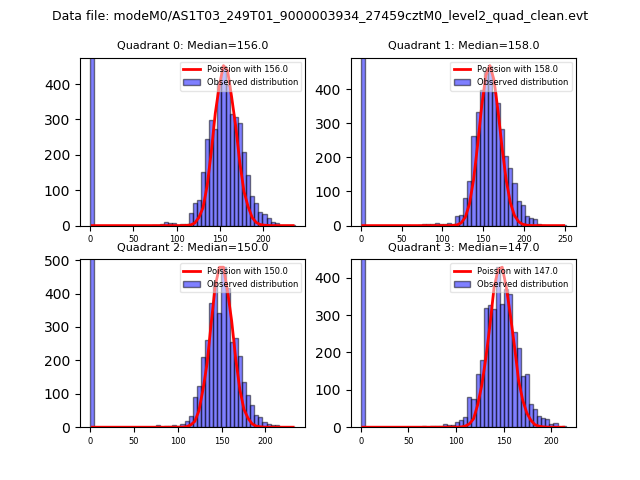 |
 |
| Quadrant-wise count rates Data is divided into 100 sec bins |
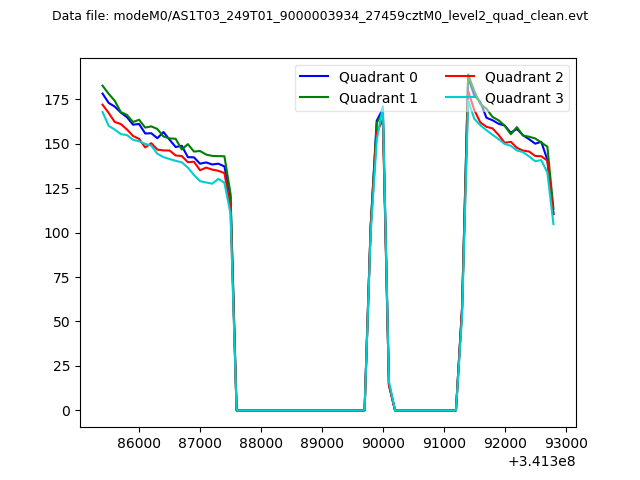 |
|
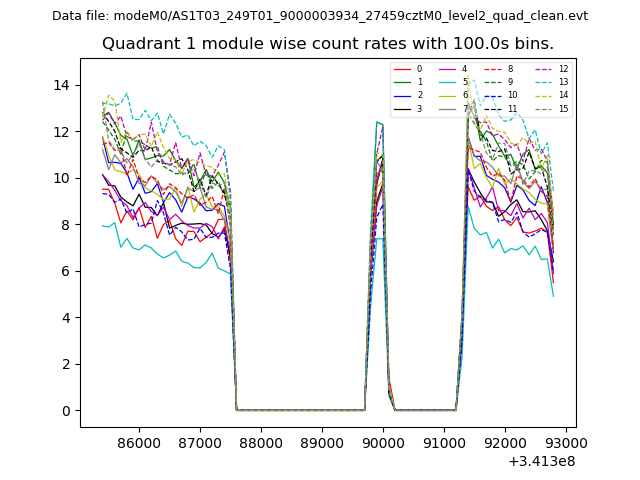
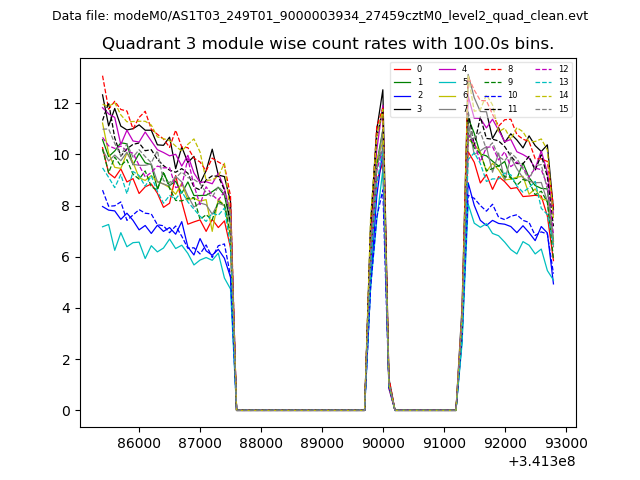
| Module-wise count rates for Quadrant A Data is divided into 100 sec bins |
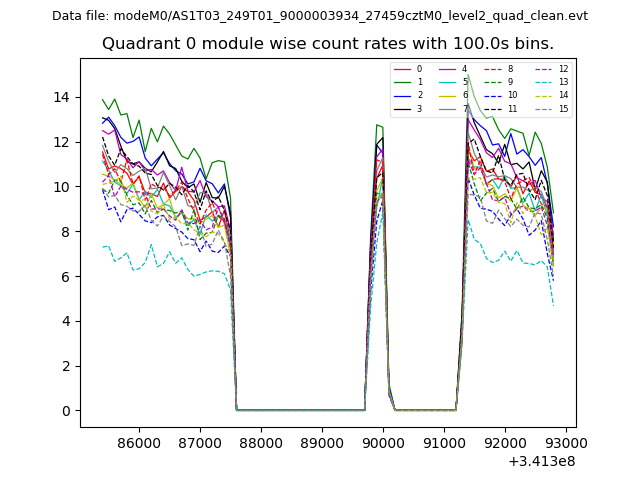 |
 |
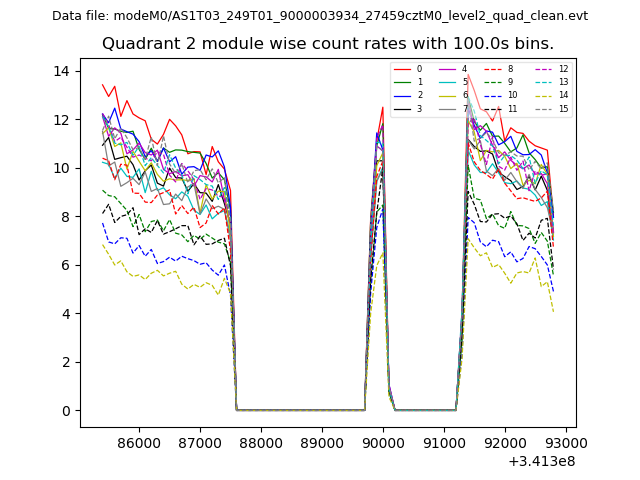
| Module-wise count rates for Quadrant B Data is divided into 100 sec bins |
 |
 |
| Module-wise count rates for Quadrant C Data is divided into 100 sec bins |
 |
 |
| Module-wise count rates for Quadrant D Data is divided into 100 sec bins |
 |
 |
| Parameter | Plot |
|---|---|
| CZT HV Monitor | 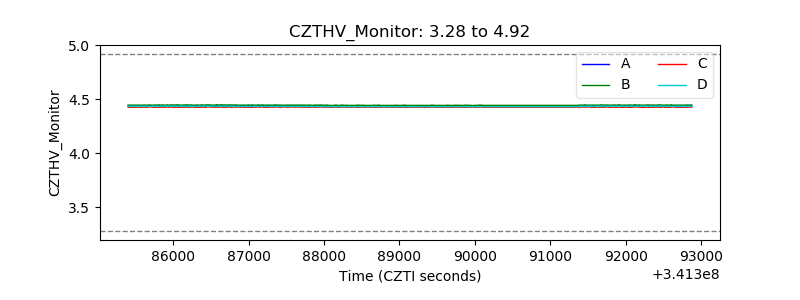 |
| D_VDD | 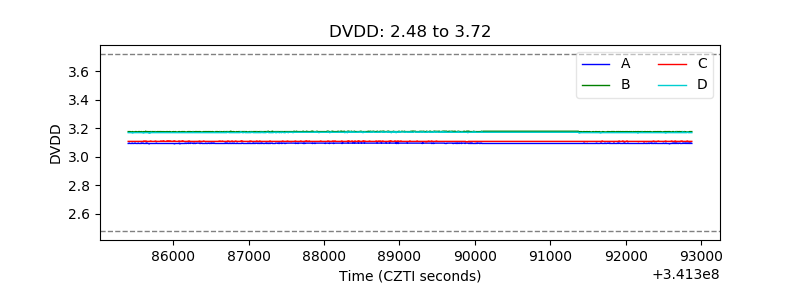 |
| Temperature 1 | 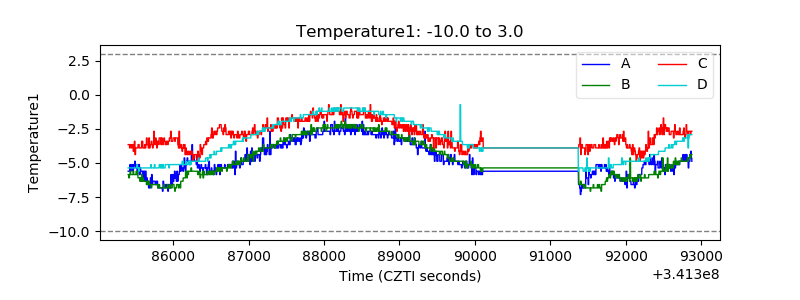 |
| Veto HV Monitor | 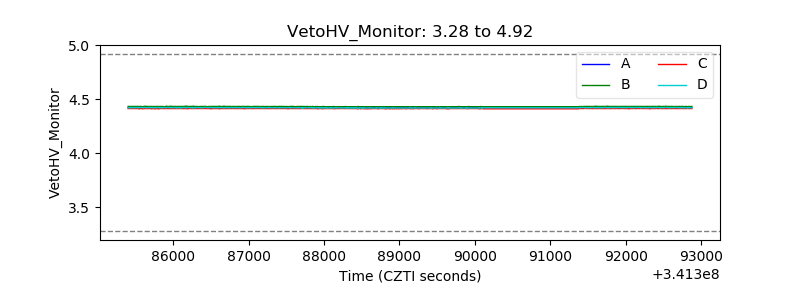 |
| Veto LLD | 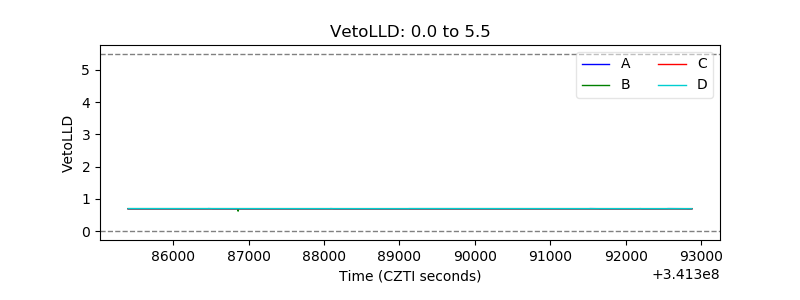 |
| Alpha Counter | 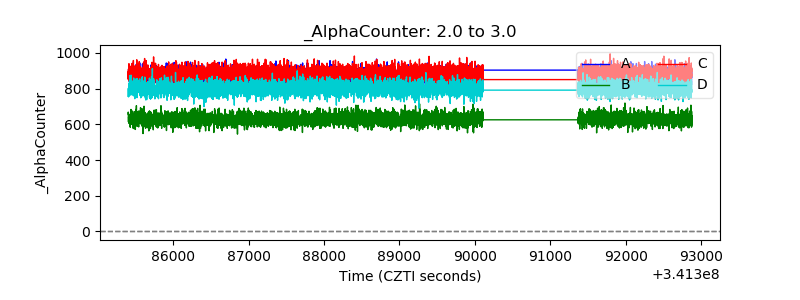 |
| _CPM_Rate | 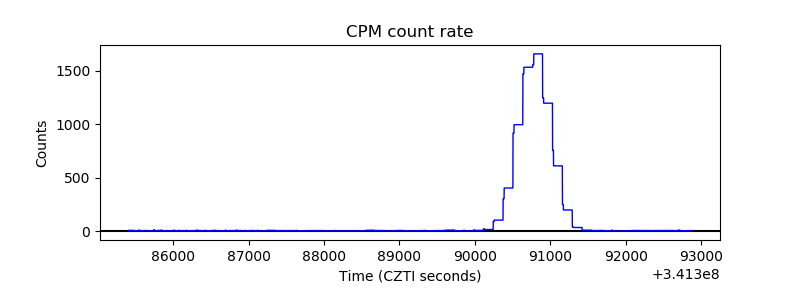 |
| CZT Counter |  |
| +2.5 Volts monitor | 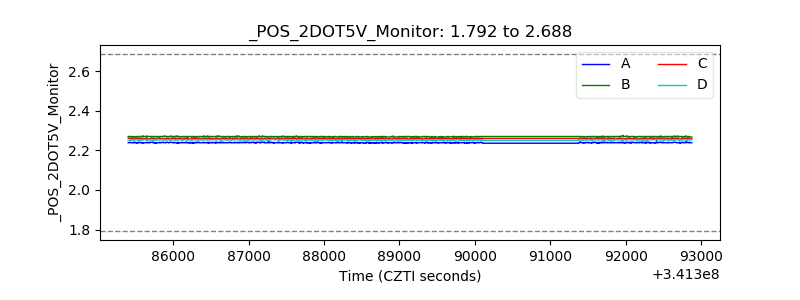 |
| +5 Volts monitor |  |
| _ROLL_ROT |  |
| _Roll_DEC |  |
| _Roll_RA | 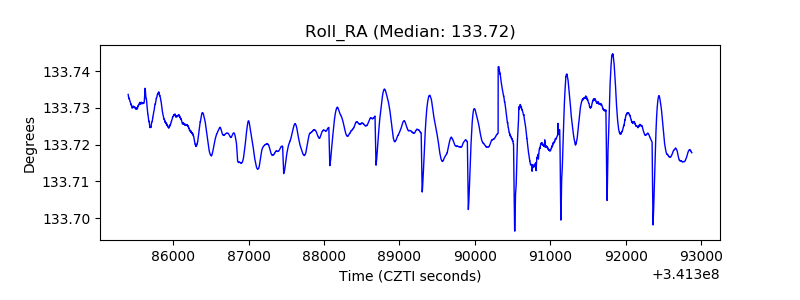 |
| Veto Counter | 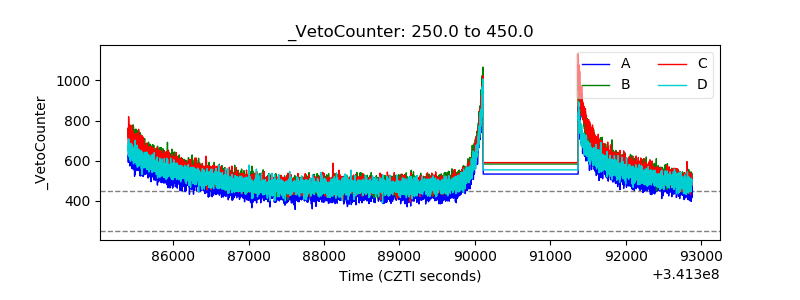 |