| Param | Original file | Final file |
|---|---|---|
| Filename | modeM0/AS1T03_249T01_9000003934_27460cztM0_level2.evt | modeM0/AS1T03_249T01_9000003934_27460cztM0_level2_quad_clean.evt |
| Size (bytes) | 443,828,160 | 93,049,920 |
| Size | 423.3 MB | 88.7 MB |
| Events in quadrant A | 3,238,138 | 606,683 |
| Events in quadrant B | 3,445,034 | 613,485 |
| Events in quadrant C | 3,209,833 | 583,688 |
| Events in quadrant D | 3,121,507 | 575,792 |
| Mode M0 | |||
|---|---|---|---|
| Quadrant | BADHDUFLAG | Total packets | Discarded packets |
| A | 0 | 13209 | 0 |
| B | 0 | 13853 | 0 |
| C | 0 | 13114 | 0 |
| D | 0 | 13199 | 0 |
| Mode M9 | |||
|---|---|---|---|
| Quadrant | BADHDUFLAG | Total packets | Discarded packets |
| A | 0 | 12 | 0 |
| B | 0 | 12 | 0 |
| C | 0 | 12 | 0 |
| D | 0 | 12 | 0 |
| Quadrant | Total seconds | Saturated seconds | Saturation percentage |
|---|---|---|---|
| A | 6277 | 98 | 1.561255% |
| B | 6278 | 146 | 2.325581% |
| C | 6278 | 114 | 1.815865% |
| D | 6278 | 61 | 0.971647% |
Noise dominated data is calculated using 1-second bins in cleaned event files. If a bin has >2000 counts, and if more than 50% of those come from <1% of pixels, then it is considered to be noise-dominated and hence unusable.
| Quadrant | # 1 sec bins | Bins with >0 counts | Bins with >2000 counts | High rate bins dominated by noise | Noise dominated (total time) | Noise dominated (detector-on time) | Marked lightcurve |
|---|---|---|---|---|---|---|---|
| A | 7432 | 6278 | 1 | 1 | 0.01% | 0.02% | 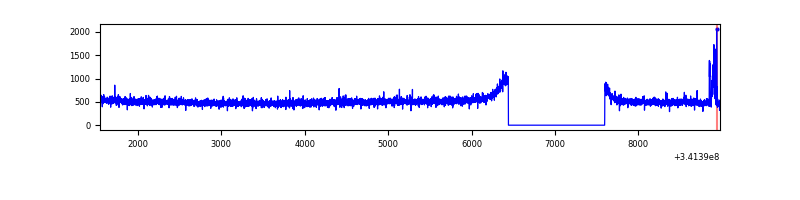 |
| B | 7433 | 6278 | 16 | 16 | 0.22% | 0.25% | 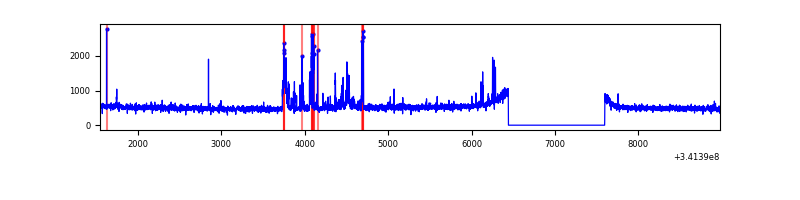 |
| C | 7433 | 6279 | 0 | 0 | 0.00% | 0.00% | 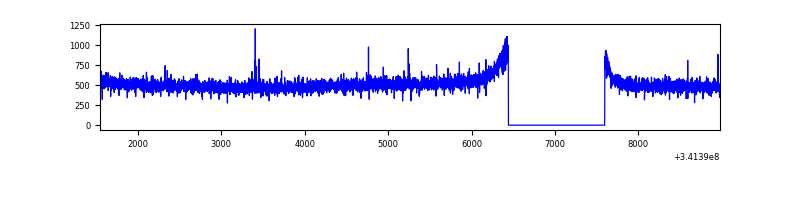 |
| D | 7433 | 6279 | 4 | 4 | 0.05% | 0.06% | 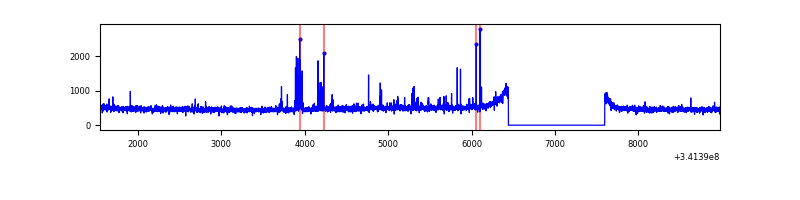 |
Top three noisy pixels from each quadrant. If the there are fewer than three noisy pixels in the level2.evt file, extra rows are filled as -1
| Pixel properties | Quadrant properties | ||||||
|---|---|---|---|---|---|---|---|
| Quadrant | DetID | PixID | Counts | Sigma | Mean | Median | Sigma |
| A | 6 | 16 | 43949 | 260.29 | 828 | 811 | 165.7 |
| A | 13 | 254 | 9788 | 54.17 | 828 | 811 | 165.7 |
| A | 3 | 137 | 7456 | 40.09 | 828 | 811 | 165.7 |
| B | 3 | 64 | 235667 | 1513.33 | 815 | 796 | 155.2 |
| B | 12 | 111 | 18765 | 115.78 | 815 | 796 | 155.2 |
| B | 11 | 111 | 16618 | 101.95 | 815 | 796 | 155.2 |
| C | 14 | 238 | 127195 | 688.94 | 788 | 794 | 183.5 |
| C | 2 | 16 | 7892 | 38.69 | 788 | 794 | 183.5 |
| C | 10 | 22 | 6372 | 30.4 | 788 | 794 | 183.5 |
| D | 2 | 250 | 75684 | 396.41 | 800 | 779 | 189.0 |
| D | 2 | 234 | 25889 | 132.89 | 800 | 779 | 189.0 |
| D | 1 | 52 | 9735 | 47.4 | 800 | 779 | 189.0 |
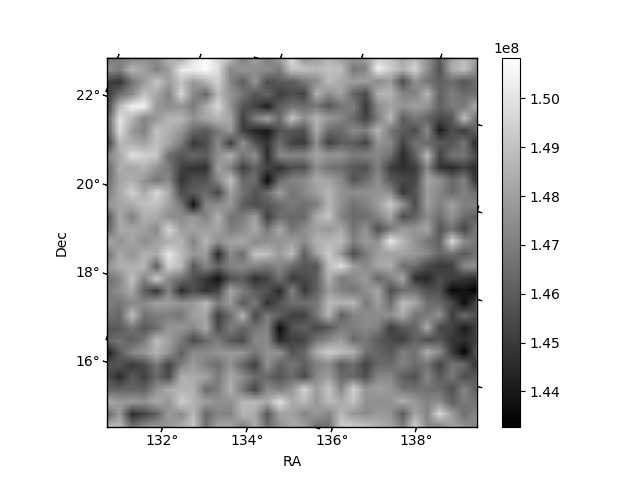
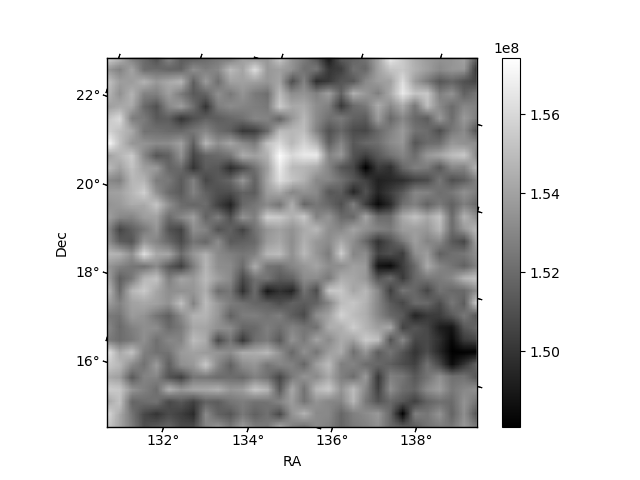
Histogram calculated using DETX and DETY for each event in the final _common_clean file
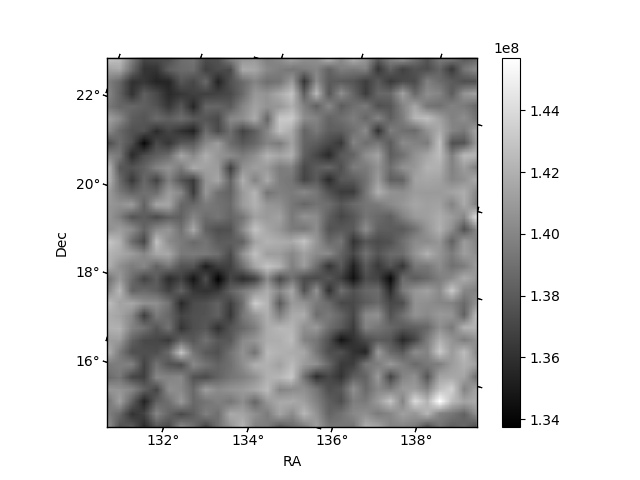
| Quadrant A | 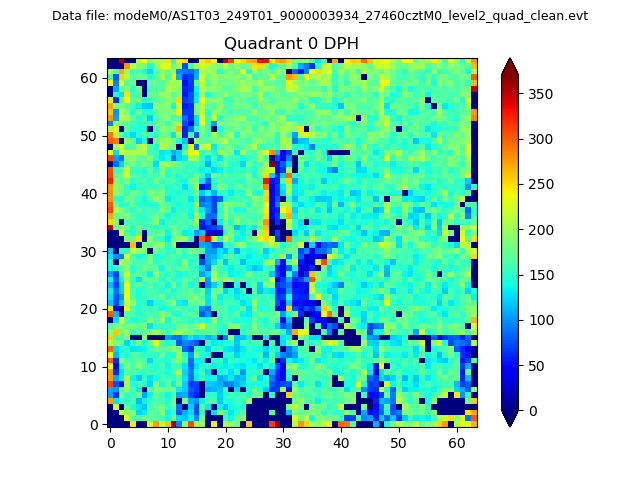 |
 |
Quadrant B |
|---|---|---|---|
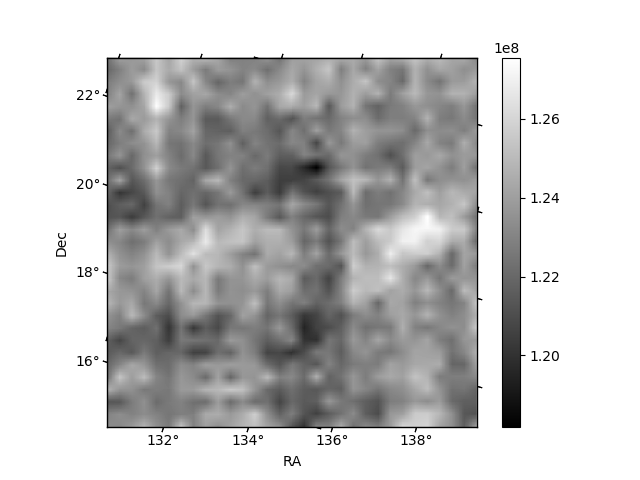
| Quadrant D | 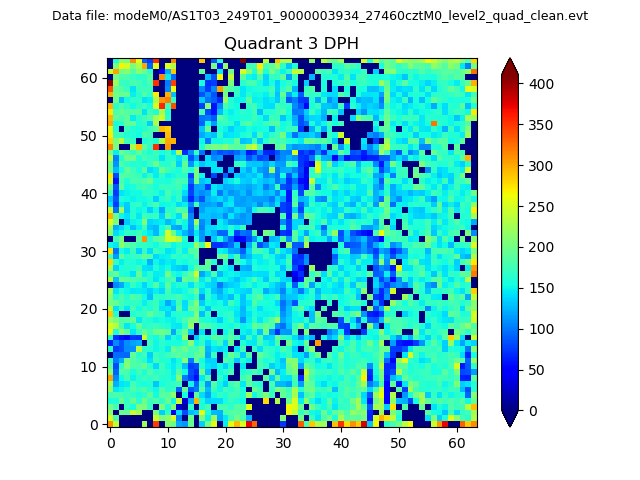 |
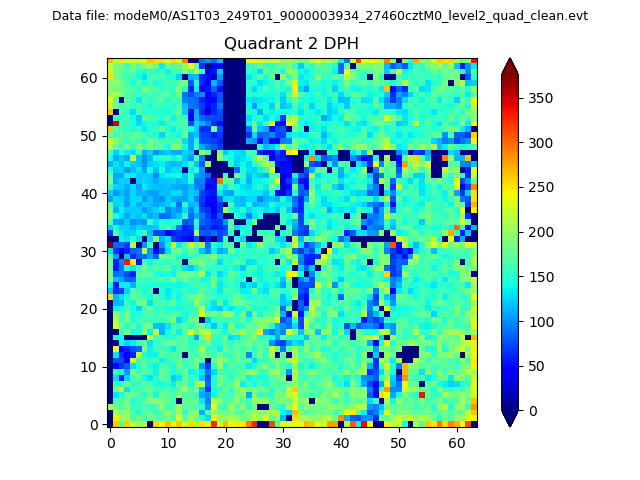 |
Quadrant C |
| Plot type | Count rate plots | Images |
|---|---|---|
| Comparison with Poisson distribution Blue bars denote a histogram of data divided into 1 sec bins. Red curve is a Poisson curve with rate = median count rate of data. |
 |
 |
| Quadrant-wise count rates Data is divided into 100 sec bins |
 |
|
| Module-wise count rates for Quadrant A Data is divided into 100 sec bins |
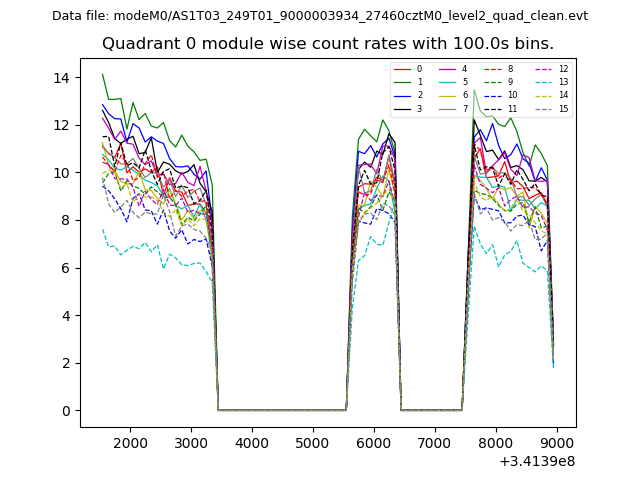 |
 |
| Module-wise count rates for Quadrant B Data is divided into 100 sec bins |
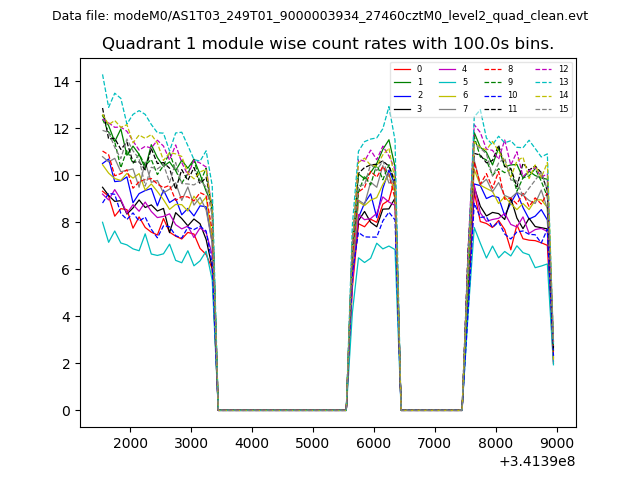 |
 |
| Module-wise count rates for Quadrant C Data is divided into 100 sec bins |
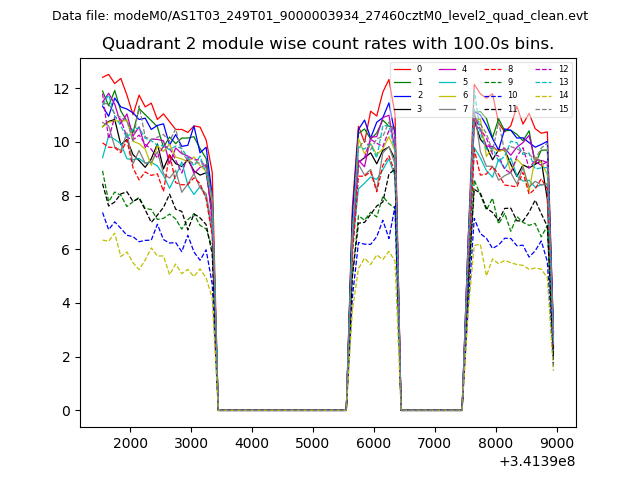 |
 |
| Module-wise count rates for Quadrant D Data is divided into 100 sec bins |
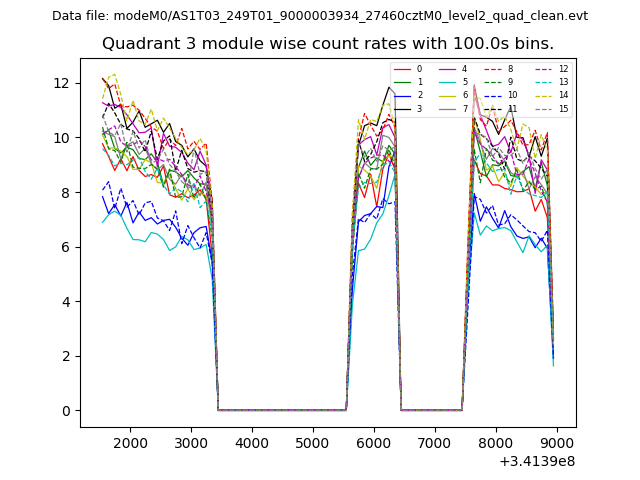 |
 |
| Parameter | Plot |
|---|---|
| CZT HV Monitor | 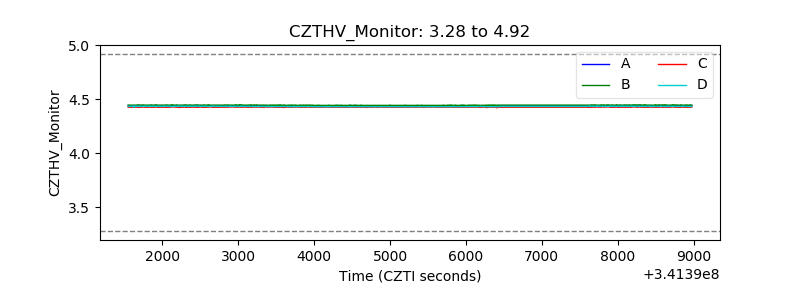 |
| D_VDD | 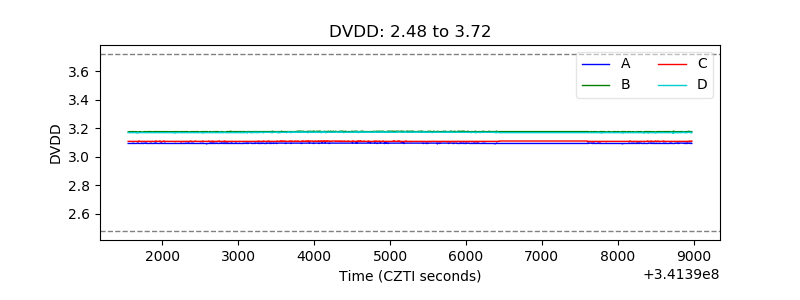 |
| Temperature 1 | 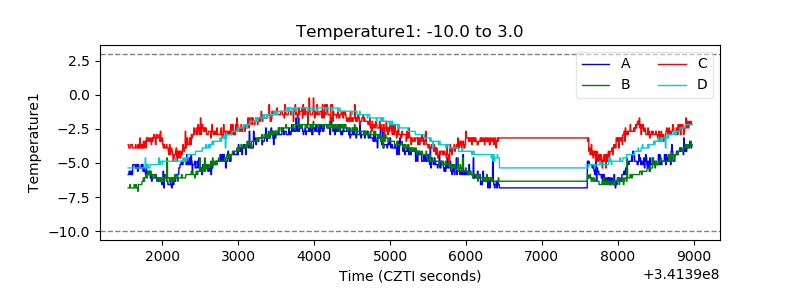 |
| Veto HV Monitor | 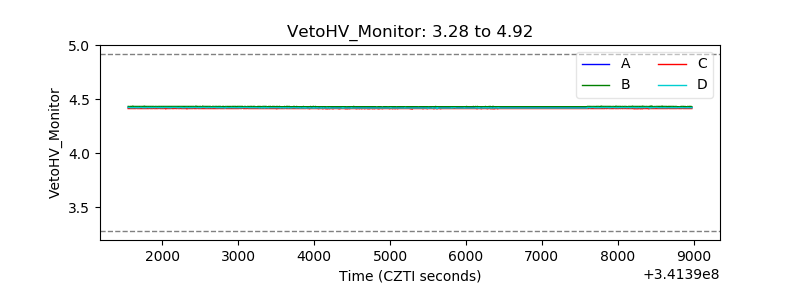 |
| Veto LLD | 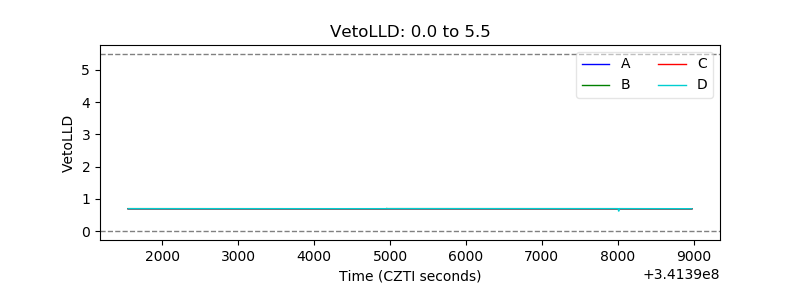 |
| Alpha Counter | 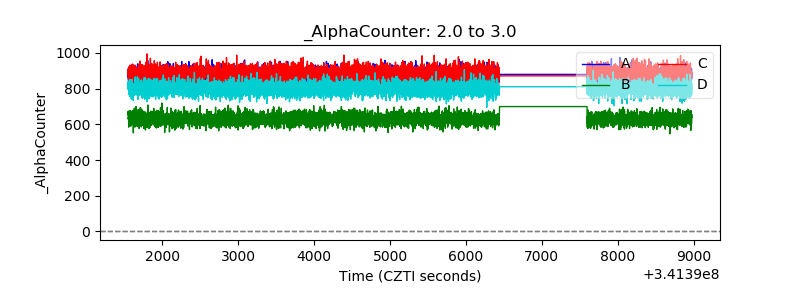 |
| _CPM_Rate |  |
| CZT Counter | 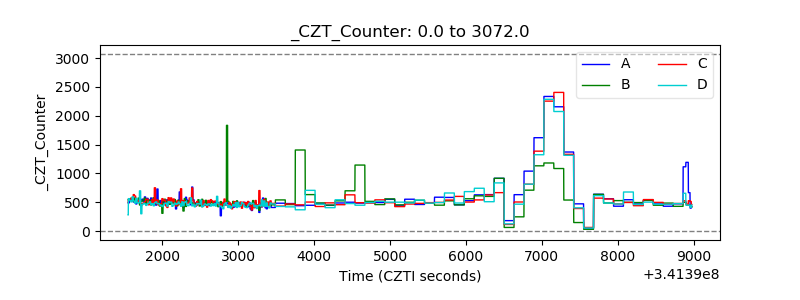 |
| +2.5 Volts monitor | 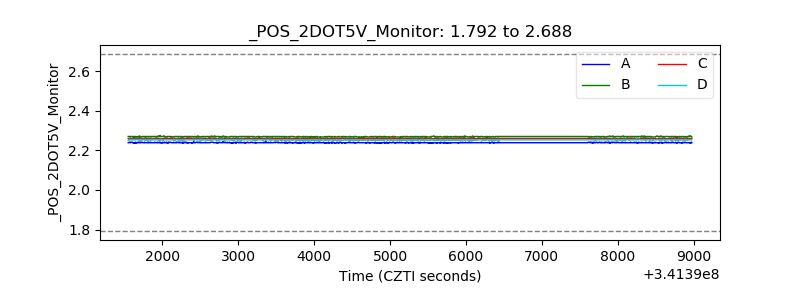 |
| +5 Volts monitor | 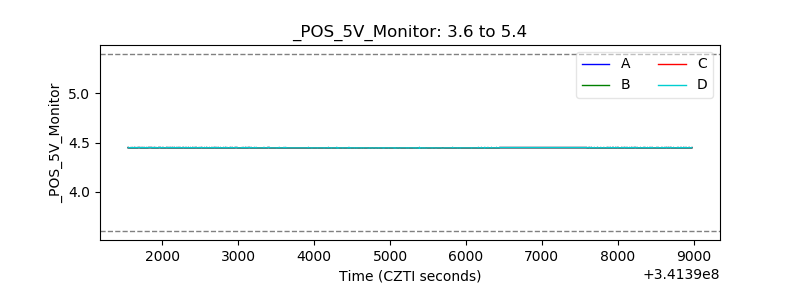 |
| _ROLL_ROT | 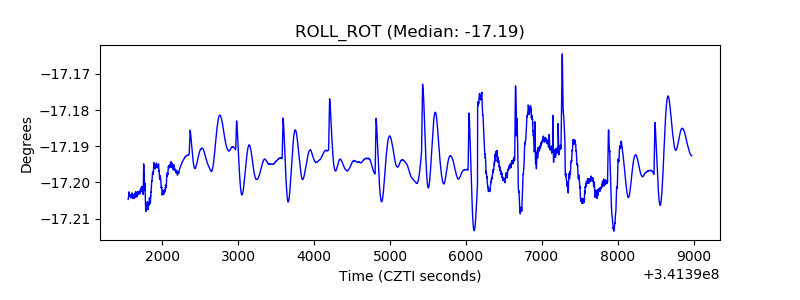 |
| _Roll_DEC |  |
| _Roll_RA | 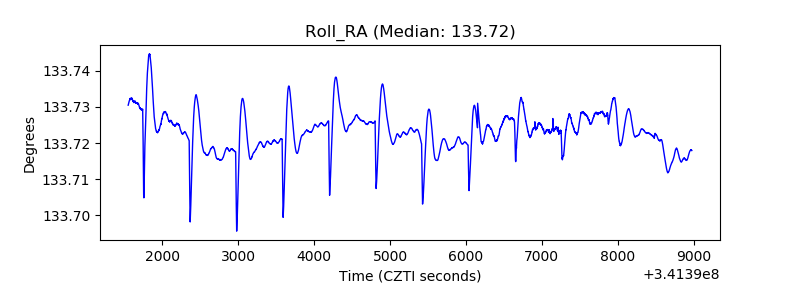 |
| Veto Counter | 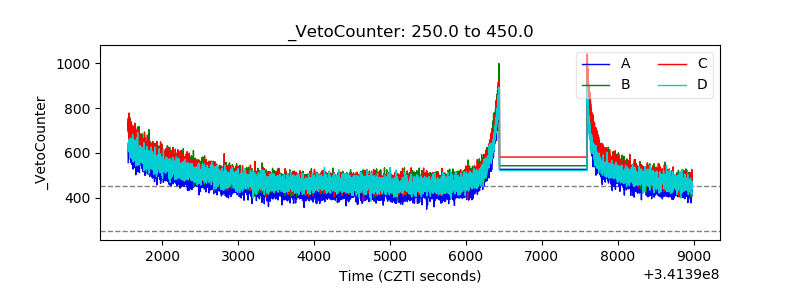 |