| Param | Original file | Final file |
|---|---|---|
| Filename | modeM0/AS1T03_249T01_9000003934_27461cztM0_level2.evt | modeM0/AS1T03_249T01_9000003934_27461cztM0_level2_quad_clean.evt |
| Size (bytes) | 421,358,400 | 85,777,920 |
| Size | 401.8 MB | 81.8 MB |
| Events in quadrant A | 3,108,541 | 552,982 |
| Events in quadrant B | 3,077,725 | 556,854 |
| Events in quadrant C | 3,064,248 | 528,827 |
| Events in quadrant D | 3,088,052 | 525,467 |
| Mode M0 | |||
|---|---|---|---|
| Quadrant | BADHDUFLAG | Total packets | Discarded packets |
| A | 0 | 12893 | 0 |
| B | 0 | 12781 | 0 |
| C | 0 | 12734 | 0 |
| D | 0 | 13217 | 0 |
| Mode M9 | |||
|---|---|---|---|
| Quadrant | BADHDUFLAG | Total packets | Discarded packets |
| A | 0 | 10 | 0 |
| B | 0 | 10 | 0 |
| C | 0 | 10 | 0 |
| D | 0 | 10 | 0 |
| Quadrant | Total seconds | Saturated seconds | Saturation percentage |
|---|---|---|---|
| A | 6210 | 69 | 1.111111% |
| B | 6211 | 67 | 1.078731% |
| C | 6211 | 69 | 1.110932% |
| D | 6211 | 57 | 0.917727% |
Noise dominated data is calculated using 1-second bins in cleaned event files. If a bin has >2000 counts, and if more than 50% of those come from <1% of pixels, then it is considered to be noise-dominated and hence unusable.
| Quadrant | # 1 sec bins | Bins with >0 counts | Bins with >2000 counts | High rate bins dominated by noise | Noise dominated (total time) | Noise dominated (detector-on time) | Marked lightcurve |
|---|---|---|---|---|---|---|---|
| A | 7165 | 6210 | 1 | 1 | 0.01% | 0.02% | 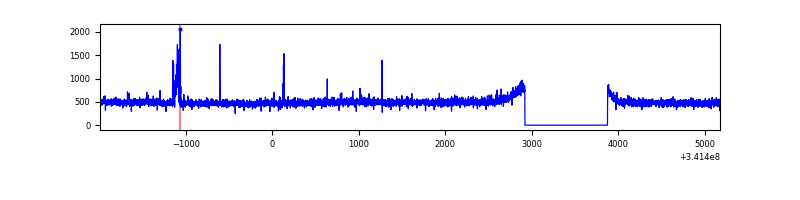 |
| B | 7166 | 6211 | 1 | 1 | 0.01% | 0.02% | 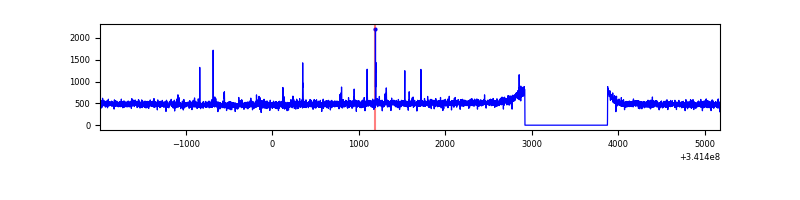 |
| C | 7166 | 6211 | 0 | 0 | 0.00% | 0.00% | 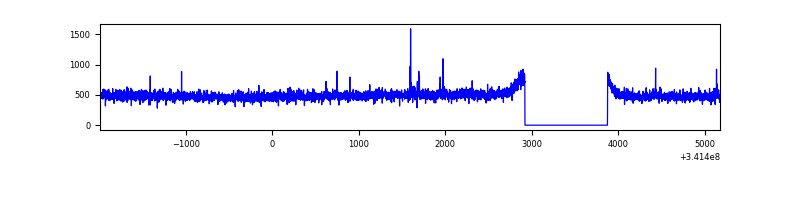 |
| D | 7166 | 6211 | 15 | 15 | 0.21% | 0.24% | 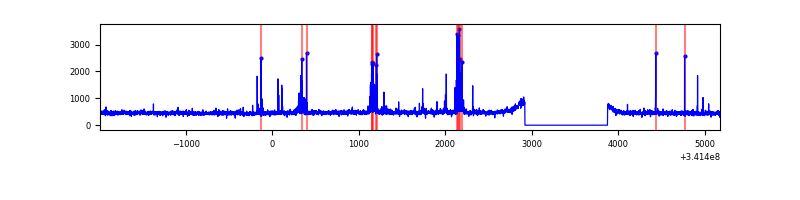 |
Top three noisy pixels from each quadrant. If the there are fewer than three noisy pixels in the level2.evt file, extra rows are filled as -1
| Pixel properties | Quadrant properties | ||||||
|---|---|---|---|---|---|---|---|
| Quadrant | DetID | PixID | Counts | Sigma | Mean | Median | Sigma |
| A | 6 | 16 | 59132 | 366.12 | 791 | 776 | 159.4 |
| A | 13 | 254 | 10263 | 59.52 | 791 | 776 | 159.4 |
| A | 3 | 137 | 7349 | 41.24 | 791 | 776 | 159.4 |
| B | 12 | 111 | 18095 | 116.24 | 777 | 758 | 149.1 |
| B | 11 | 111 | 16271 | 104.01 | 777 | 758 | 149.1 |
| B | 14 | 111 | 14709 | 93.54 | 777 | 758 | 149.1 |
| C | 14 | 238 | 120616 | 680.36 | 750 | 754 | 176.2 |
| C | 10 | 22 | 17098 | 92.77 | 750 | 754 | 176.2 |
| C | 13 | 61 | 5066 | 24.48 | 750 | 754 | 176.2 |
| D | 2 | 250 | 179957 | 975.46 | 766 | 747 | 183.7 |
| D | 2 | 234 | 26280 | 138.98 | 766 | 747 | 183.7 |
| D | 2 | 120 | 10648 | 53.89 | 766 | 747 | 183.7 |
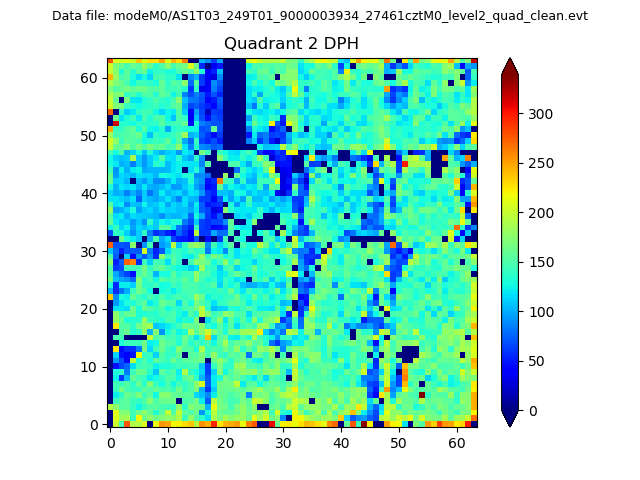
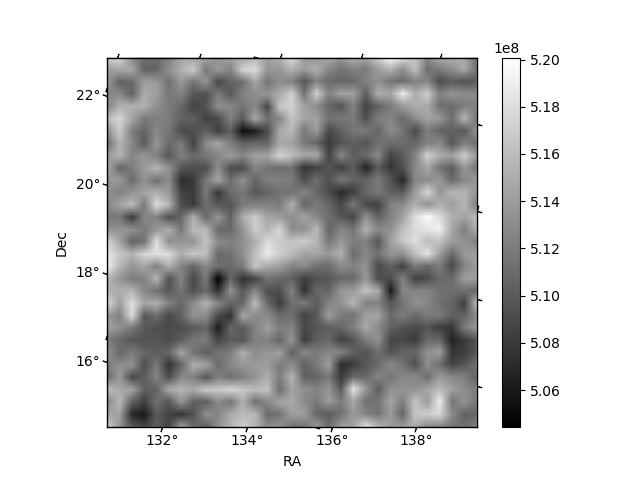
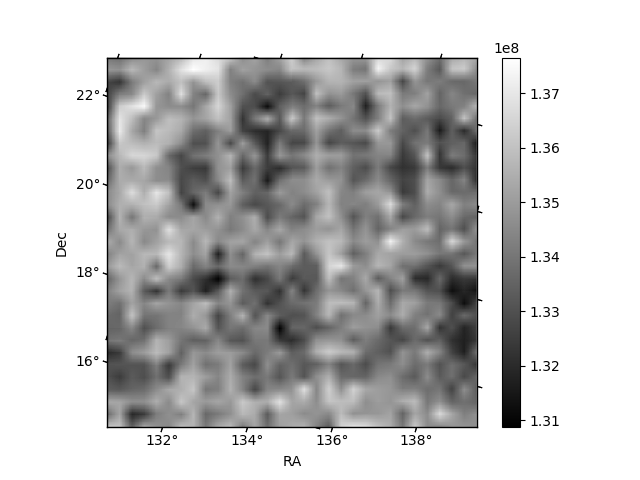
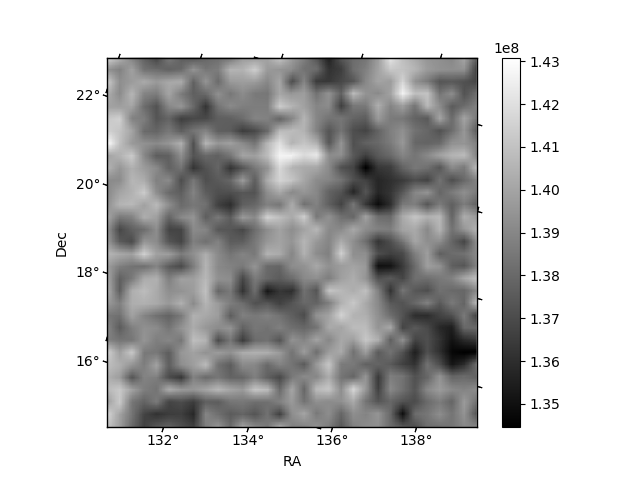
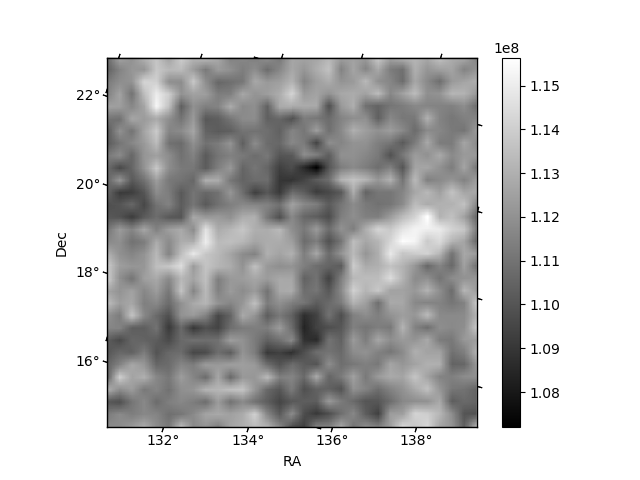
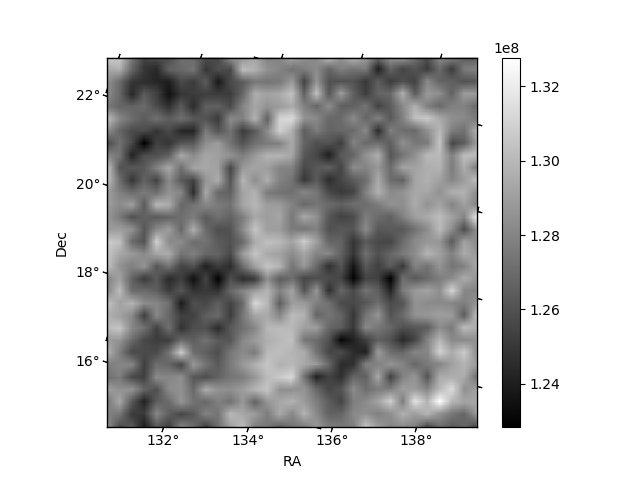
Histogram calculated using DETX and DETY for each event in the final _common_clean file
| Quadrant A | 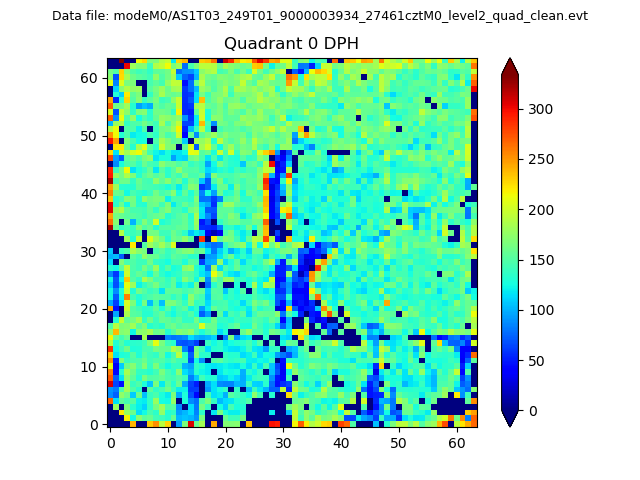 |
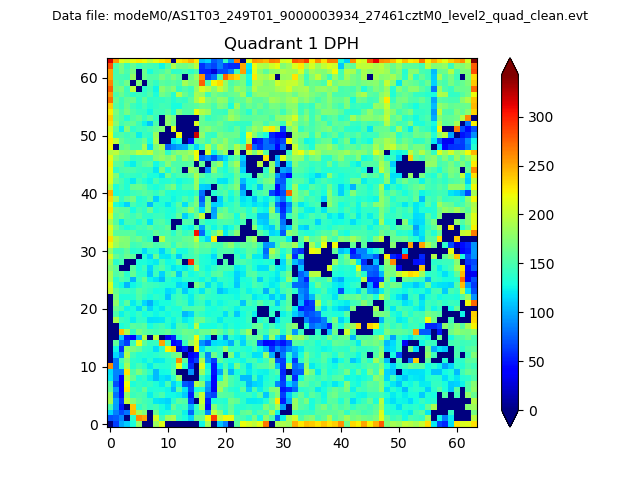 |
Quadrant B |
|---|---|---|---|
| Quadrant D | 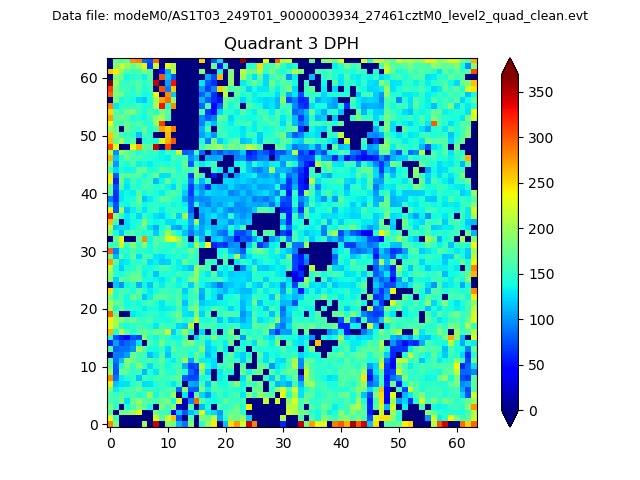 |
 |
Quadrant C |
| Plot type | Count rate plots | Images |
|---|---|---|
| Comparison with Poisson distribution Blue bars denote a histogram of data divided into 1 sec bins. Red curve is a Poisson curve with rate = median count rate of data. |
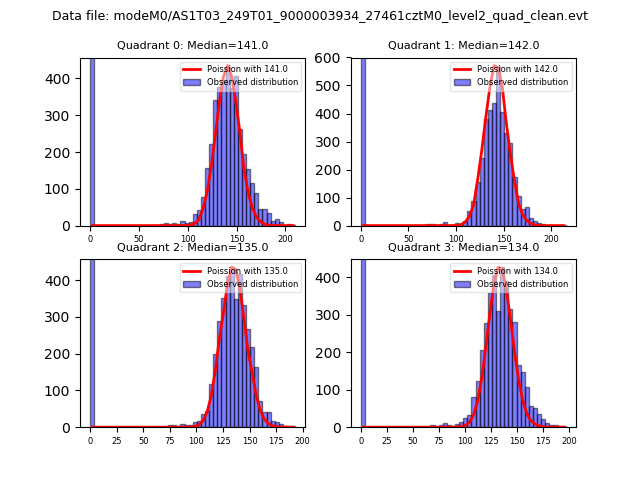 |
 |
| Quadrant-wise count rates Data is divided into 100 sec bins |
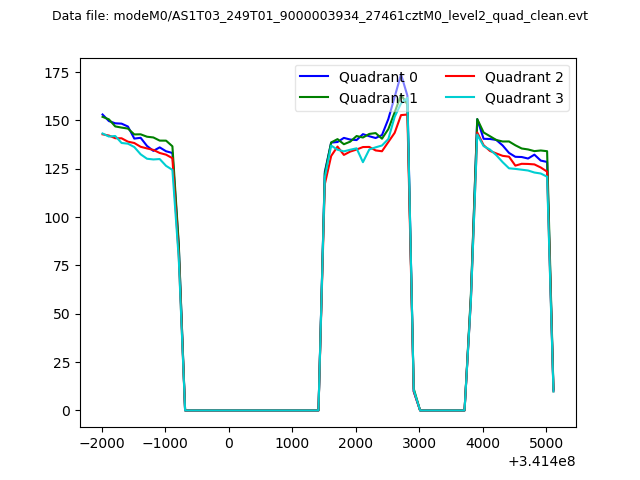 |
|
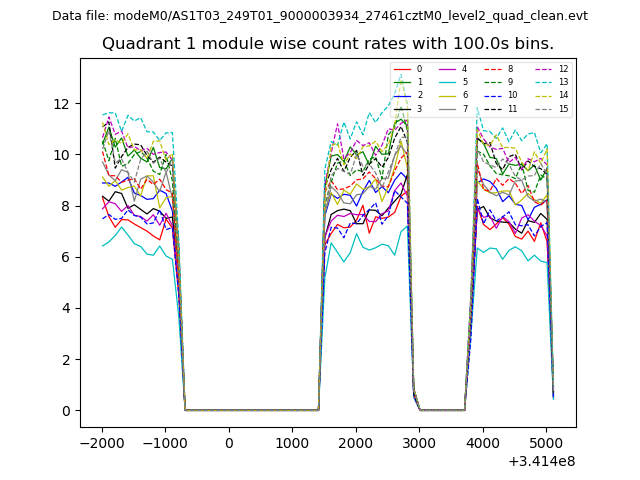
| Module-wise count rates for Quadrant A Data is divided into 100 sec bins |
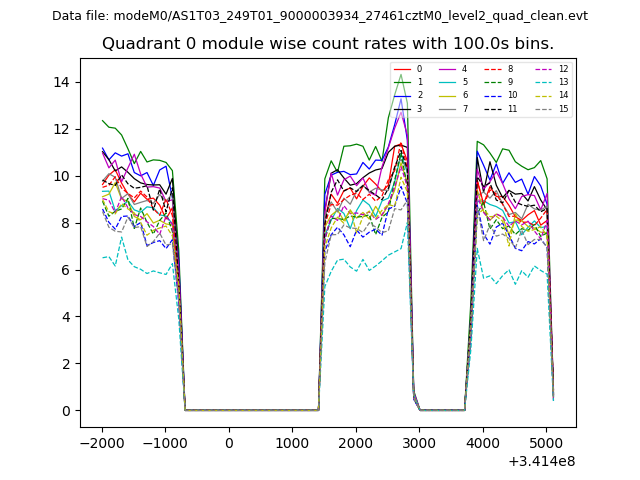 |
 |
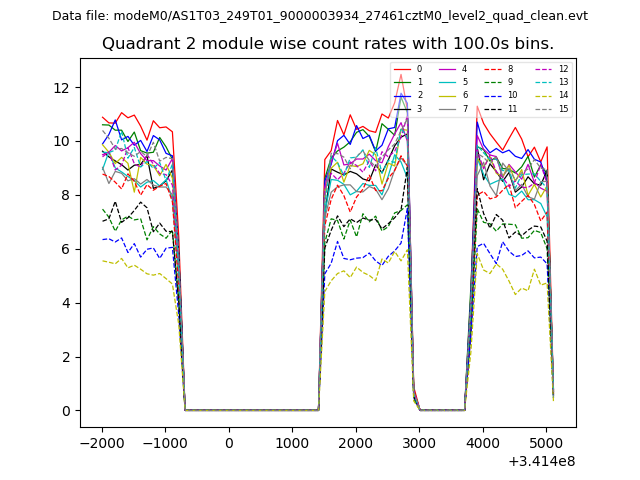
| Module-wise count rates for Quadrant B Data is divided into 100 sec bins |
 |
 |
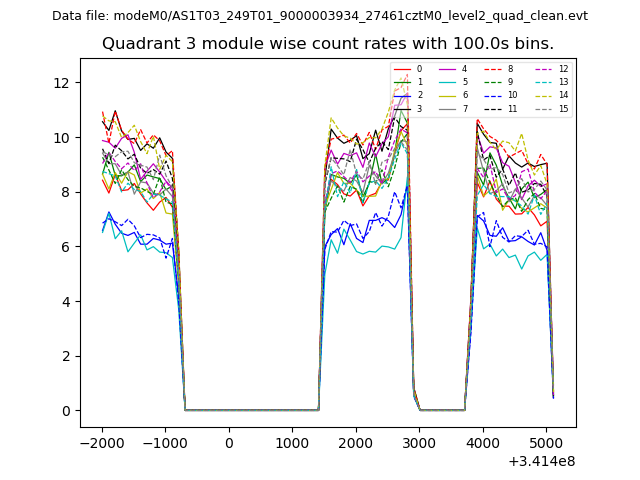
| Module-wise count rates for Quadrant C Data is divided into 100 sec bins |
 |
 |
| Module-wise count rates for Quadrant D Data is divided into 100 sec bins |
 |
 |
| Parameter | Plot |
|---|---|
| CZT HV Monitor | 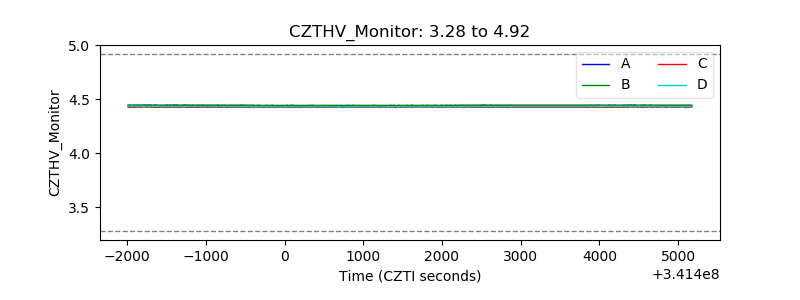 |
| D_VDD | 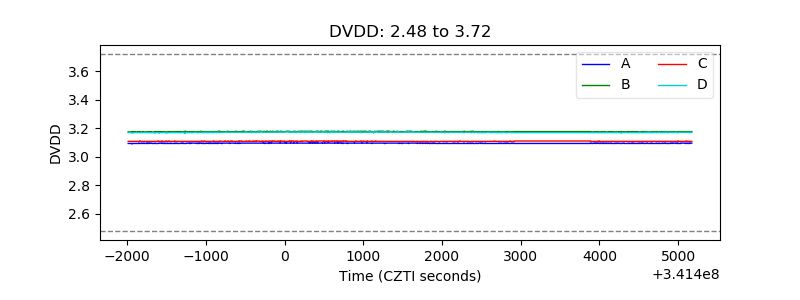 |
| Temperature 1 | 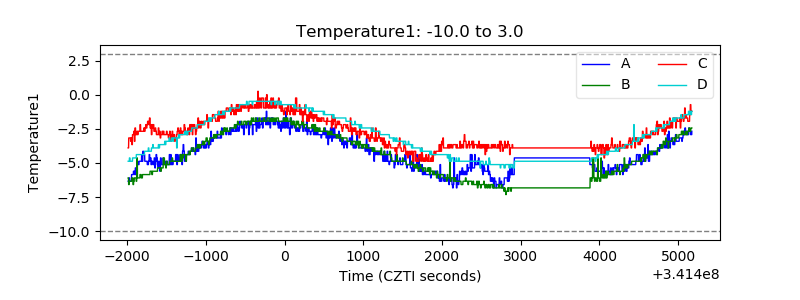 |
| Veto HV Monitor |  |
| Veto LLD | 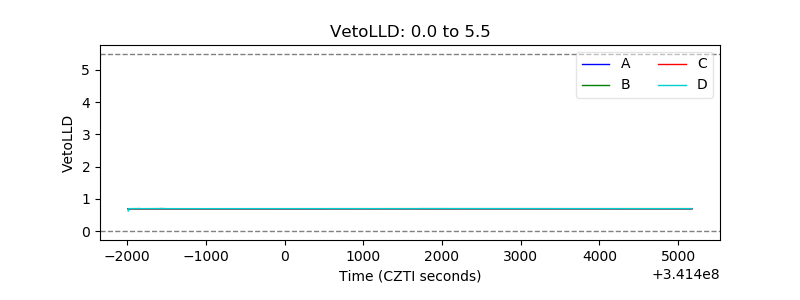 |
| Alpha Counter | 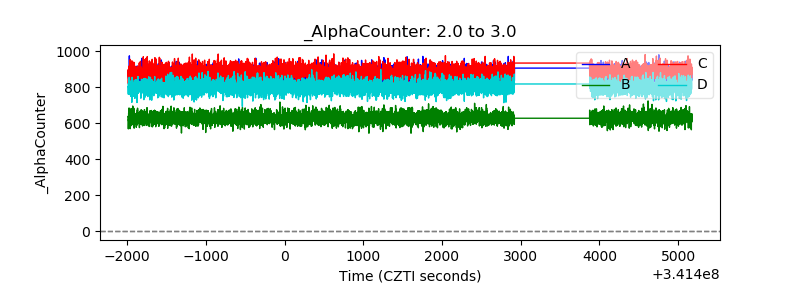 |
| _CPM_Rate | 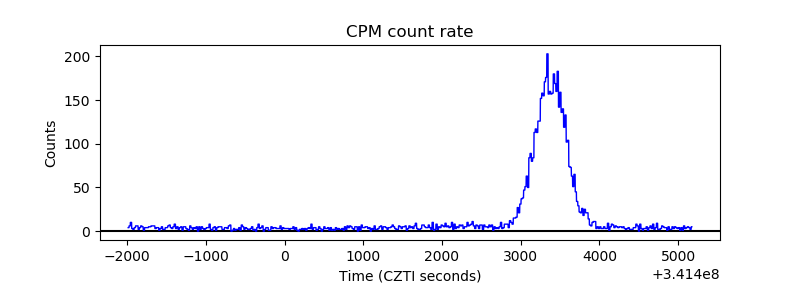 |
| CZT Counter | 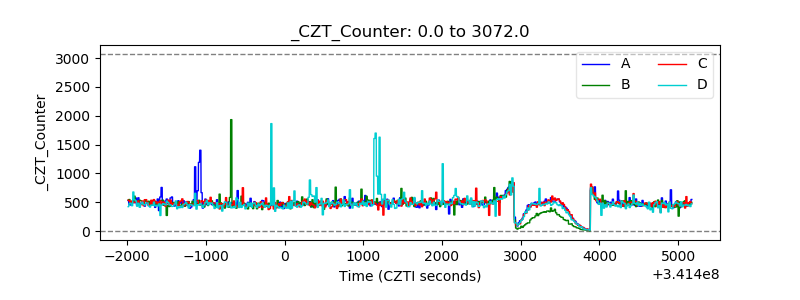 |
| +2.5 Volts monitor | 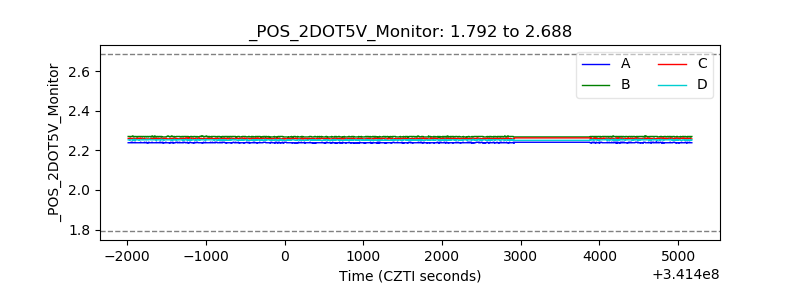 |
| +5 Volts monitor |  |
| _ROLL_ROT | 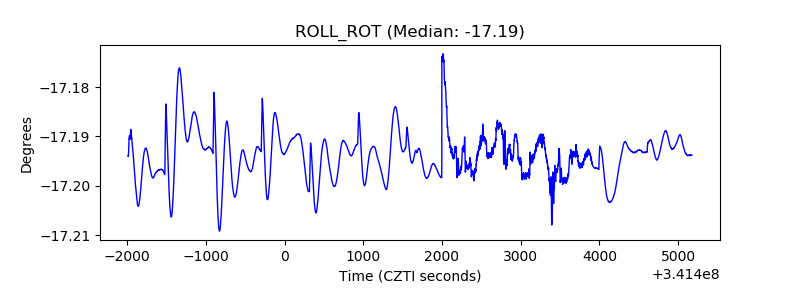 |
| _Roll_DEC | 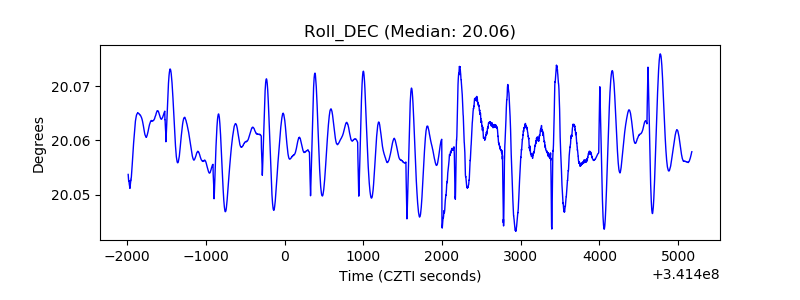 |
| _Roll_RA | 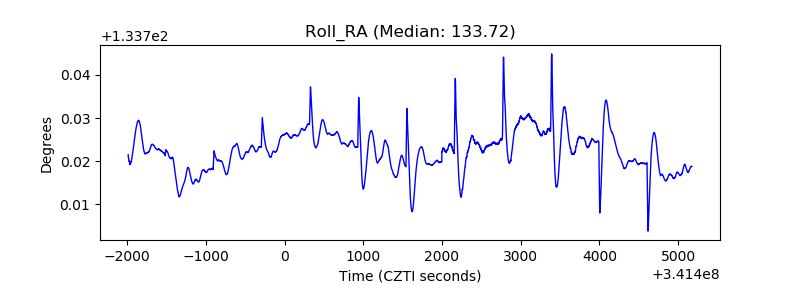 |
| Veto Counter |  |