| Param | Original file | Final file |
|---|---|---|
| Filename | modeM0/AS1T03_249T01_9000003934_27462cztM0_level2.evt | modeM0/AS1T03_249T01_9000003934_27462cztM0_level2_quad_clean.evt |
| Size (bytes) | 436,898,880 | 80,709,120 |
| Size | 416.7 MB | 77.0 MB |
| Events in quadrant A | 3,163,690 | 505,932 |
| Events in quadrant B | 3,240,095 | 512,223 |
| Events in quadrant C | 3,199,483 | 485,394 |
| Events in quadrant D | 3,181,189 | 482,026 |
| Mode M0 | |||
|---|---|---|---|
| Quadrant | BADHDUFLAG | Total packets | Discarded packets |
| A | 0 | 13430 | 0 |
| B | 0 | 13620 | 0 |
| C | 0 | 13517 | 0 |
| D | 0 | 13847 | 0 |
| Mode M9 | |||
|---|---|---|---|
| Quadrant | BADHDUFLAG | Total packets | Discarded packets |
| A | 0 | 5 | 0 |
| B | 0 | 5 | 0 |
| C | 0 | 5 | 0 |
| D | 0 | 5 | 0 |
| Quadrant | Total seconds | Saturated seconds | Saturation percentage |
|---|---|---|---|
| A | 6570 | 88 | 1.339422% |
| B | 6570 | 99 | 1.506849% |
| C | 6570 | 118 | 1.796043% |
| D | 6570 | 80 | 1.217656% |
Noise dominated data is calculated using 1-second bins in cleaned event files. If a bin has >2000 counts, and if more than 50% of those come from <1% of pixels, then it is considered to be noise-dominated and hence unusable.
| Quadrant | # 1 sec bins | Bins with >0 counts | Bins with >2000 counts | High rate bins dominated by noise | Noise dominated (total time) | Noise dominated (detector-on time) | Marked lightcurve |
|---|---|---|---|---|---|---|---|
| A | 7120 | 6570 | 0 | 0 | 0.00% | 0.00% | 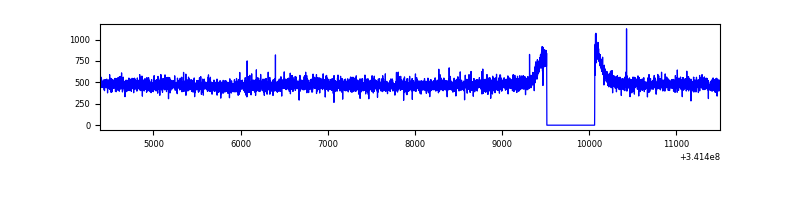 |
| B | 7120 | 6570 | 4 | 4 | 0.06% | 0.06% | 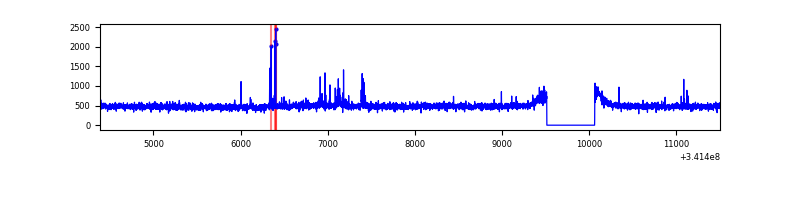 |
| C | 7120 | 6570 | 1 | 1 | 0.01% | 0.02% | 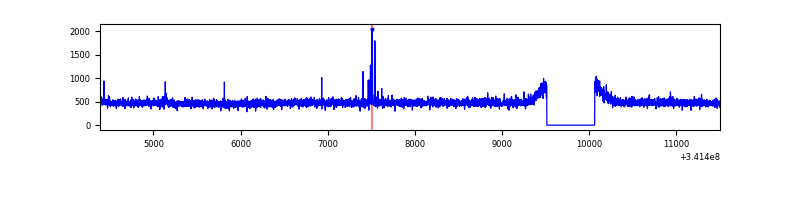 |
| D | 7120 | 6570 | 13 | 13 | 0.18% | 0.20% | 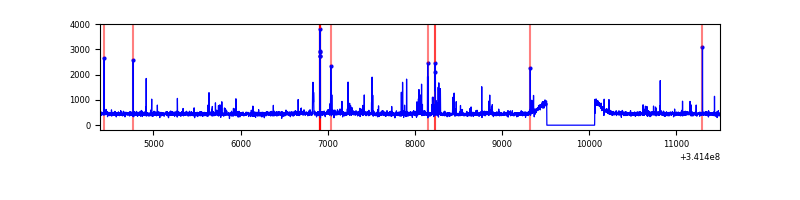 |
Top three noisy pixels from each quadrant. If the there are fewer than three noisy pixels in the level2.evt file, extra rows are filled as -1
| Pixel properties | Quadrant properties | ||||||
|---|---|---|---|---|---|---|---|
| Quadrant | DetID | PixID | Counts | Sigma | Mean | Median | Sigma |
| A | 13 | 254 | 10132 | 56.66 | 819 | 802 | 164.7 |
| A | 3 | 137 | 8074 | 44.16 | 819 | 802 | 164.7 |
| A | 0 | 226 | 6891 | 36.98 | 819 | 802 | 164.7 |
| B | 3 | 64 | 29621 | 182.93 | 809 | 789 | 157.6 |
| B | 12 | 111 | 19090 | 116.11 | 809 | 789 | 157.6 |
| B | 11 | 111 | 17321 | 104.89 | 809 | 789 | 157.6 |
| C | 14 | 238 | 122671 | 659.15 | 780 | 785 | 184.9 |
| C | 10 | 22 | 30181 | 158.97 | 780 | 785 | 184.9 |
| C | 13 | 61 | 5321 | 24.53 | 780 | 785 | 184.9 |
| D | 2 | 250 | 104984 | 547.33 | 793 | 773 | 190.4 |
| D | 2 | 120 | 59737 | 309.68 | 793 | 773 | 190.4 |
| D | 2 | 234 | 28318 | 144.67 | 793 | 773 | 190.4 |
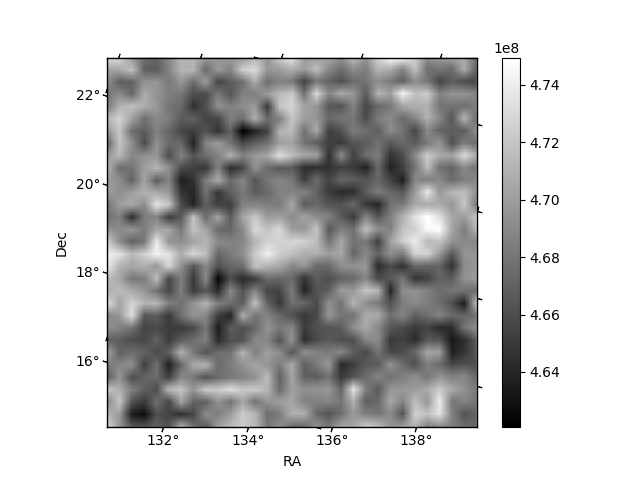
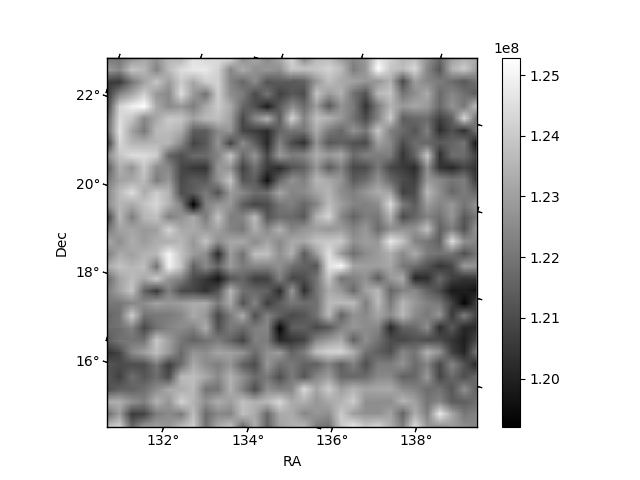
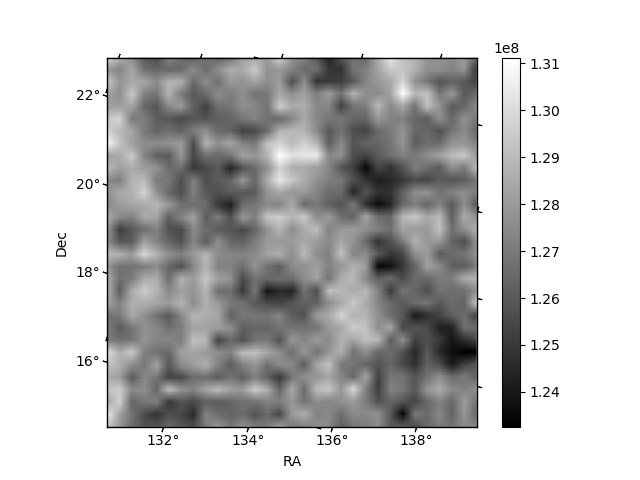
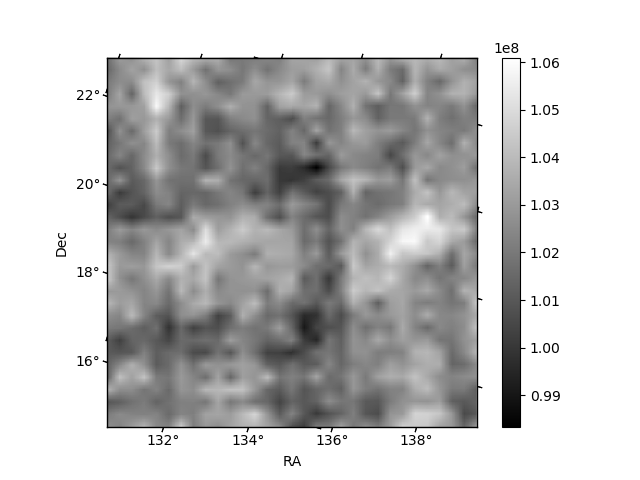
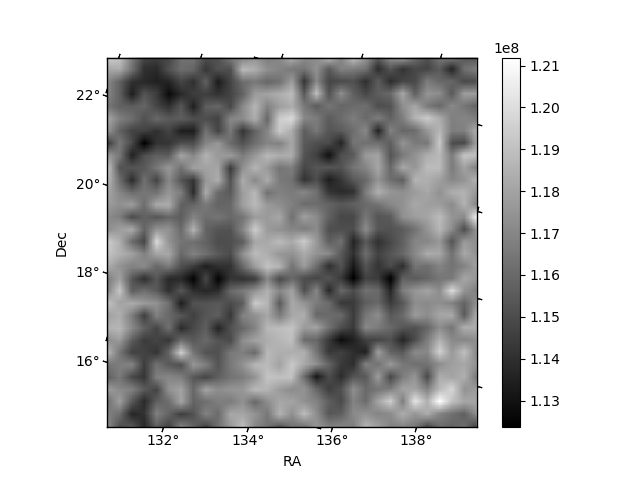
Histogram calculated using DETX and DETY for each event in the final _common_clean file
| Quadrant A | 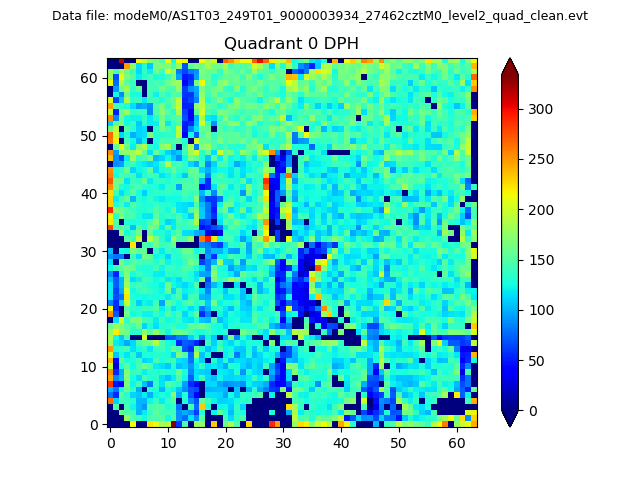 |
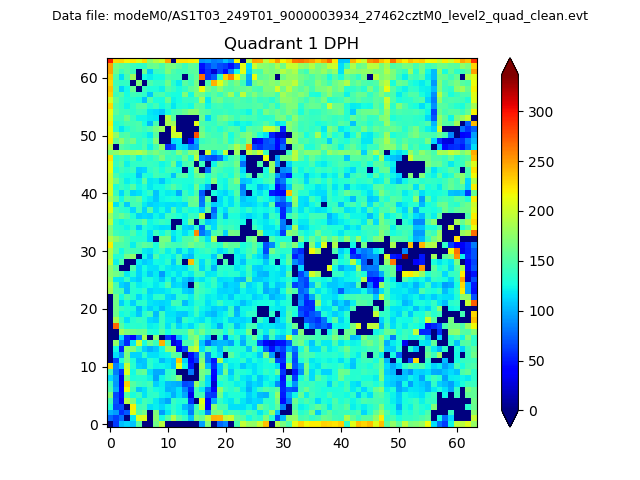 |
Quadrant B |
|---|---|---|---|
| Quadrant D | 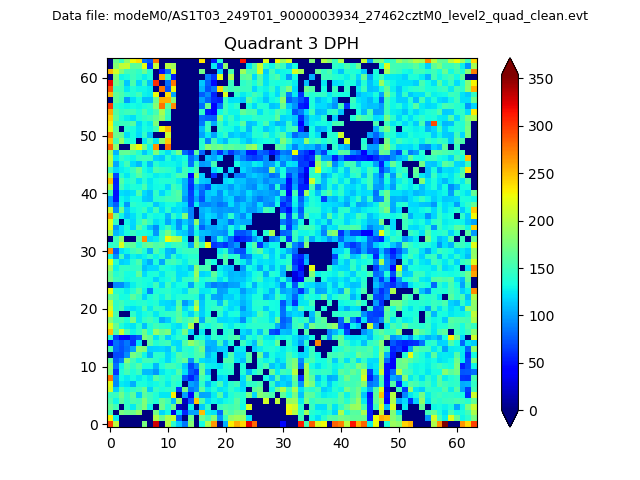 |
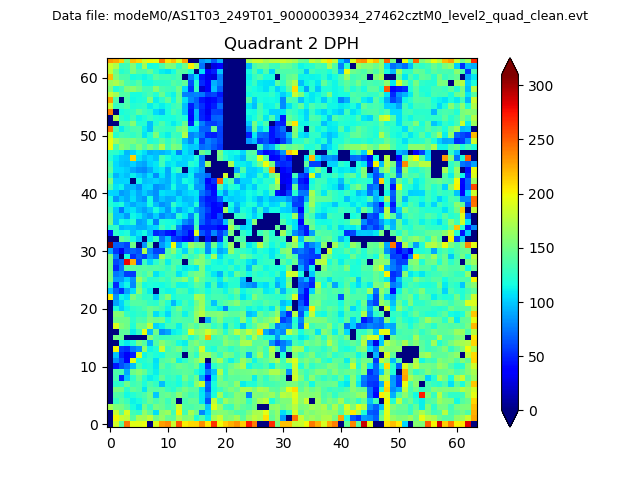 |
Quadrant C |
| Plot type | Count rate plots | Images |
|---|---|---|
| Comparison with Poisson distribution Blue bars denote a histogram of data divided into 1 sec bins. Red curve is a Poisson curve with rate = median count rate of data. |
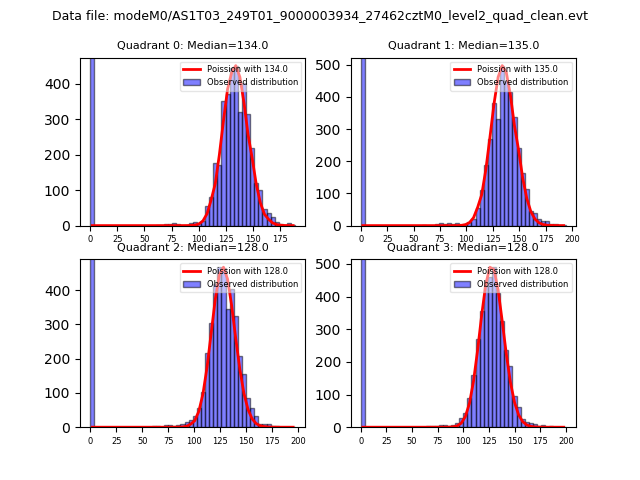 |
 |
| Quadrant-wise count rates Data is divided into 100 sec bins |
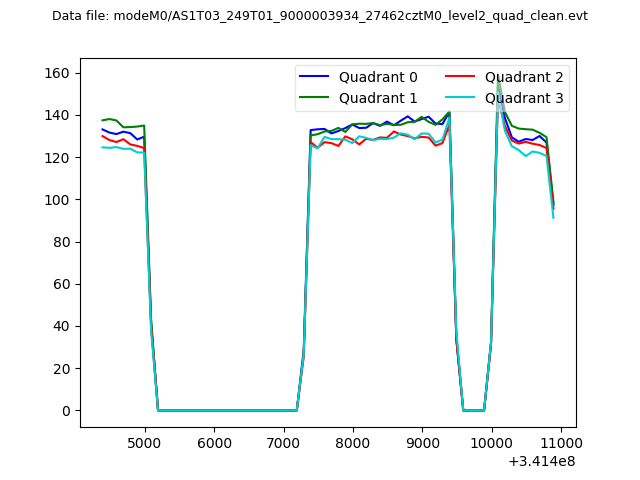 |
|
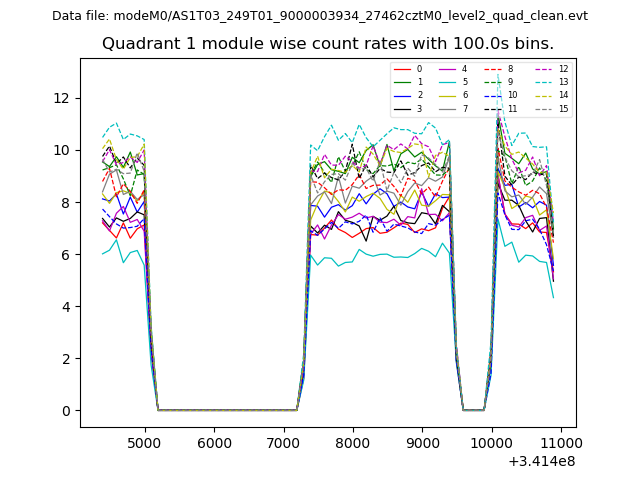
| Module-wise count rates for Quadrant A Data is divided into 100 sec bins |
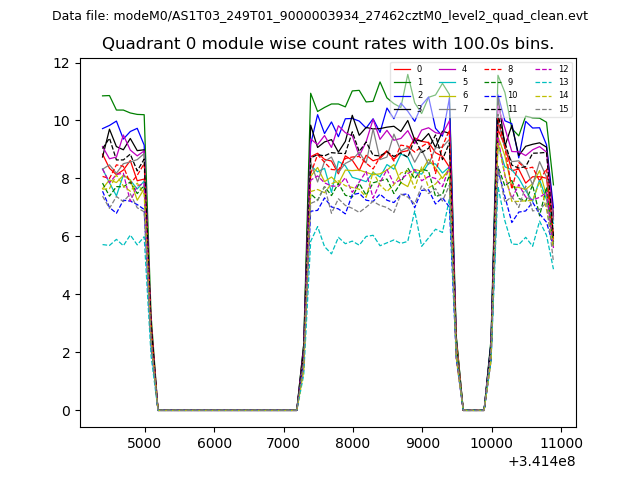 |
 |
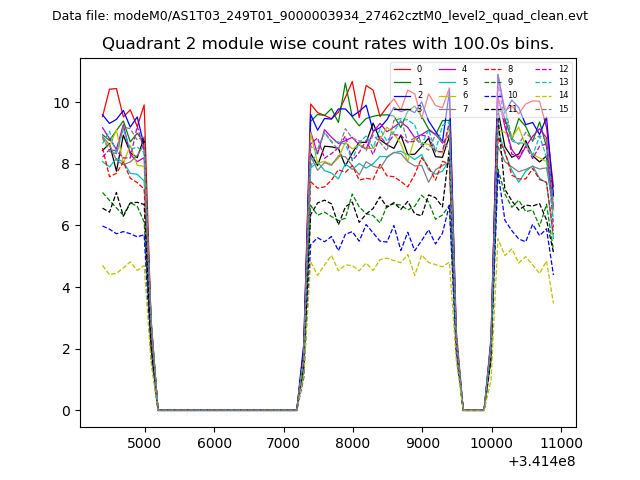
| Module-wise count rates for Quadrant B Data is divided into 100 sec bins |
 |
 |
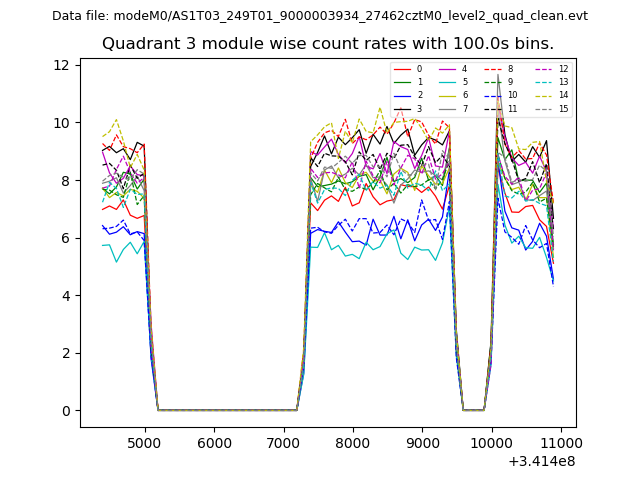
| Module-wise count rates for Quadrant C Data is divided into 100 sec bins |
 |
 |
| Module-wise count rates for Quadrant D Data is divided into 100 sec bins |
 |
 |
| Parameter | Plot |
|---|---|
| CZT HV Monitor | 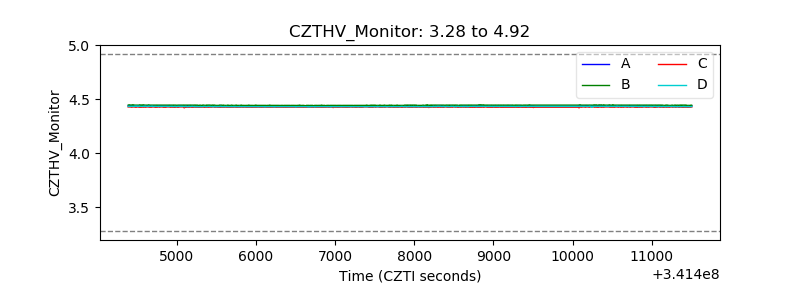 |
| D_VDD | 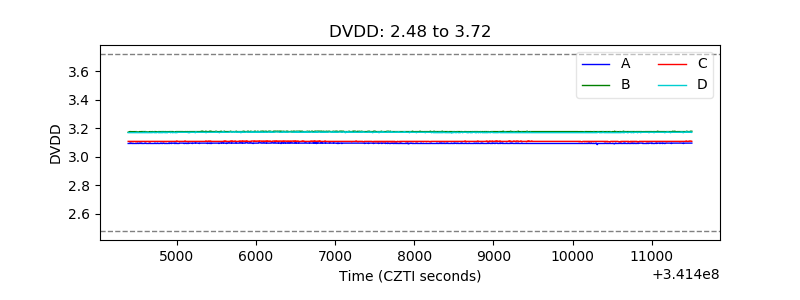 |
| Temperature 1 | 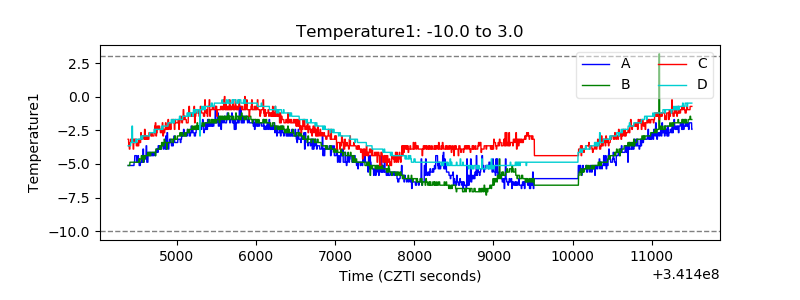 |
| Veto HV Monitor | 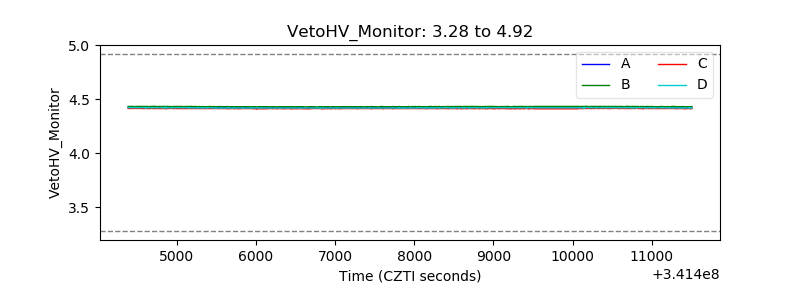 |
| Veto LLD | 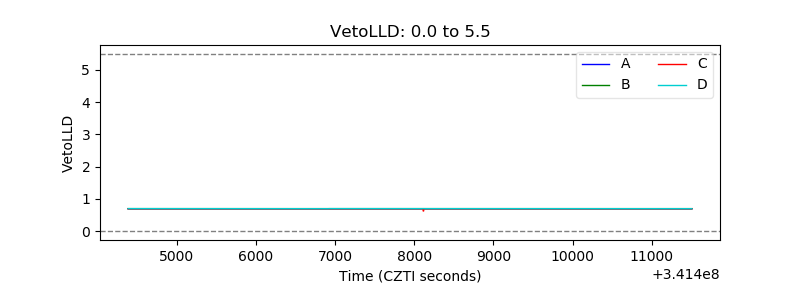 |
| Alpha Counter | 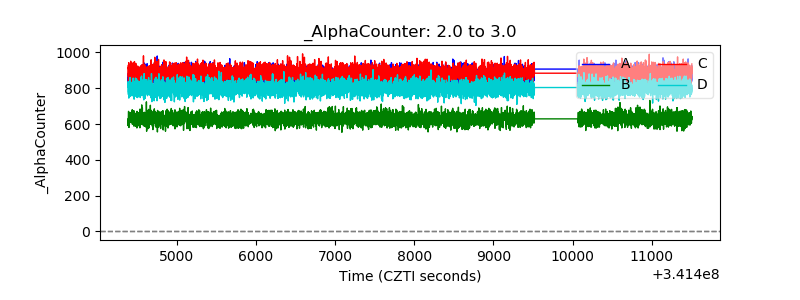 |
| _CPM_Rate | 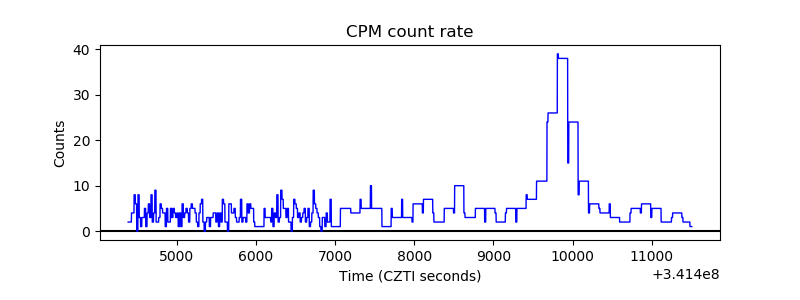 |
| CZT Counter | 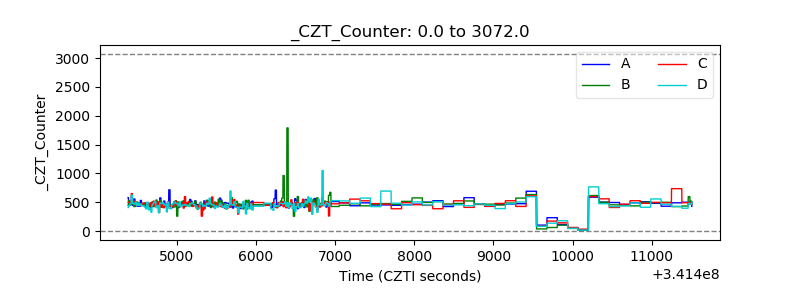 |
| +2.5 Volts monitor |  |
| +5 Volts monitor |  |
| _ROLL_ROT | 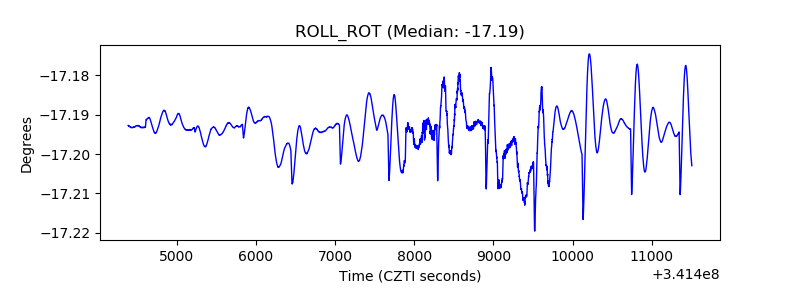 |
| _Roll_DEC | 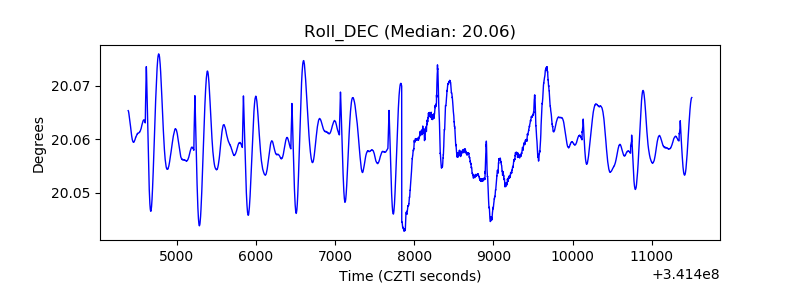 |
| _Roll_RA |  |
| Veto Counter |  |