| Param | Original file | Final file |
|---|---|---|
| Filename | modeM0/AS1T03_249T01_9000003934_27463cztM0_level2.evt | modeM0/AS1T03_249T01_9000003934_27463cztM0_level2_quad_clean.evt |
| Size (bytes) | 514,131,840 | 90,656,640 |
| Size | 490.3 MB | 86.5 MB |
| Events in quadrant A | 3,710,452 | 564,512 |
| Events in quadrant B | 3,766,821 | 569,037 |
| Events in quadrant C | 3,913,088 | 542,765 |
| Events in quadrant D | 3,664,672 | 540,977 |
| Mode M0 | |||
|---|---|---|---|
| Quadrant | BADHDUFLAG | Total packets | Discarded packets |
| A | 0 | 15777 | 0 |
| B | 0 | 15891 | 0 |
| C | 0 | 16379 | 0 |
| D | 0 | 16077 | 0 |
| Mode M9 | |||
|---|---|---|---|
| Quadrant | BADHDUFLAG | Total packets | Discarded packets |
| A | 0 | 3 | 0 |
| B | 0 | 3 | 0 |
| C | 0 | 3 | 0 |
| D | 0 | 3 | 0 |
| Quadrant | Total seconds | Saturated seconds | Saturation percentage |
|---|---|---|---|
| A | 7584 | 150 | 1.977848% |
| B | 7584 | 186 | 2.452532% |
| C | 7584 | 273 | 3.599684% |
| D | 7584 | 128 | 1.687764% |
Noise dominated data is calculated using 1-second bins in cleaned event files. If a bin has >2000 counts, and if more than 50% of those come from <1% of pixels, then it is considered to be noise-dominated and hence unusable.
| Quadrant | # 1 sec bins | Bins with >0 counts | Bins with >2000 counts | High rate bins dominated by noise | Noise dominated (total time) | Noise dominated (detector-on time) | Marked lightcurve |
|---|---|---|---|---|---|---|---|
| A | 7814 | 7584 | 0 | 0 | 0.00% | 0.00% | 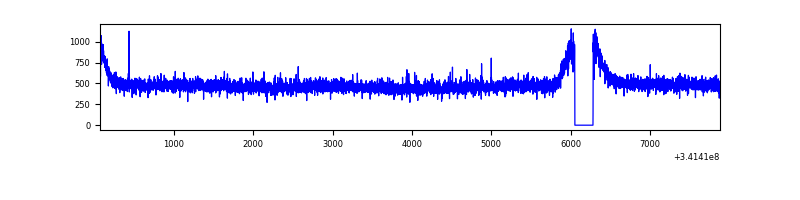 |
| B | 7814 | 7584 | 3 | 3 | 0.04% | 0.04% | 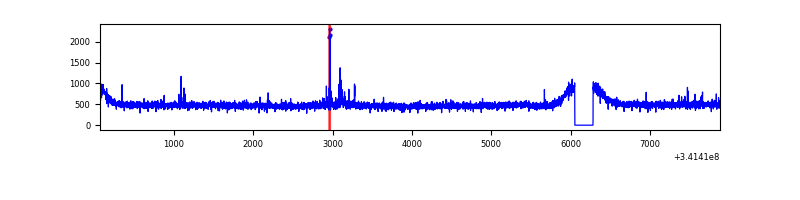 |
| C | 7814 | 7584 | 23 | 23 | 0.29% | 0.30% | 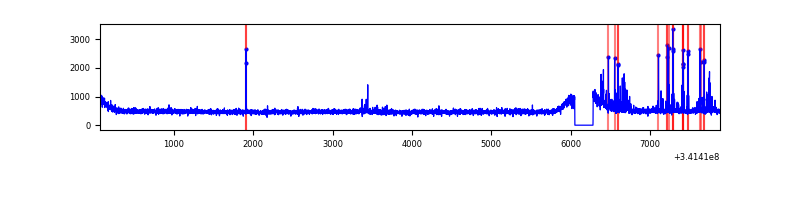 |
| D | 7814 | 7584 | 13 | 13 | 0.17% | 0.17% | 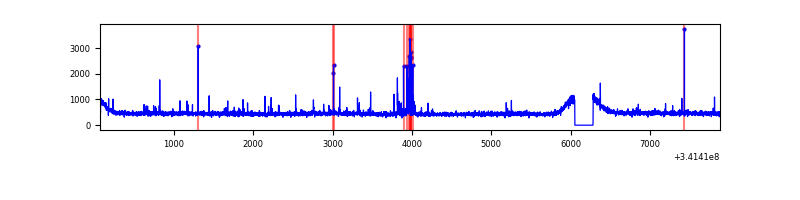 |
Top three noisy pixels from each quadrant. If the there are fewer than three noisy pixels in the level2.evt file, extra rows are filled as -1
| Pixel properties | Quadrant properties | ||||||
|---|---|---|---|---|---|---|---|
| Quadrant | DetID | PixID | Counts | Sigma | Mean | Median | Sigma |
| A | 13 | 254 | 11720 | 55.27 | 961 | 938 | 195.1 |
| A | 3 | 137 | 9393 | 43.34 | 961 | 938 | 195.1 |
| A | 0 | 226 | 7989 | 36.15 | 961 | 938 | 195.1 |
| B | 12 | 111 | 23066 | 118.87 | 947 | 918 | 186.3 |
| B | 4 | 52 | 20938 | 107.45 | 947 | 918 | 186.3 |
| B | 11 | 111 | 20639 | 105.85 | 947 | 918 | 186.3 |
| C | 14 | 238 | 144670 | 663.81 | 914 | 919 | 216.6 |
| C | 15 | 208 | 114168 | 522.96 | 914 | 919 | 216.6 |
| C | 10 | 22 | 86072 | 393.22 | 914 | 919 | 216.6 |
| D | 2 | 250 | 89423 | 399.46 | 933 | 909 | 221.6 |
| D | 2 | 234 | 32705 | 143.49 | 933 | 909 | 221.6 |
| D | 1 | 52 | 22833 | 98.94 | 933 | 909 | 221.6 |
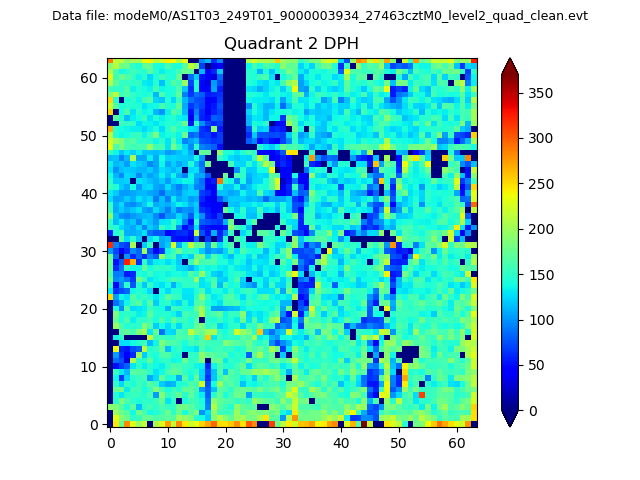
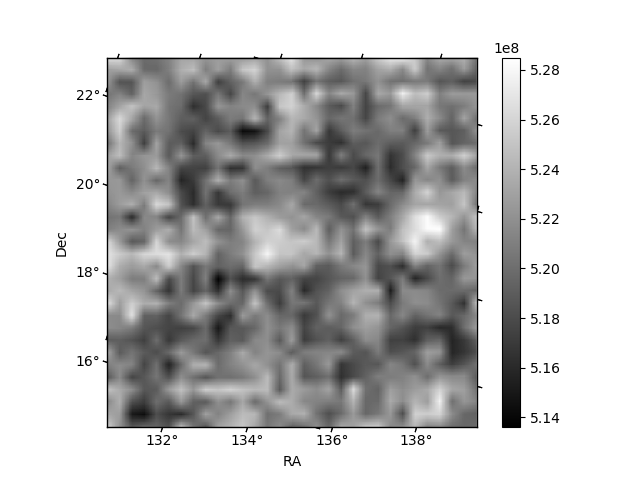
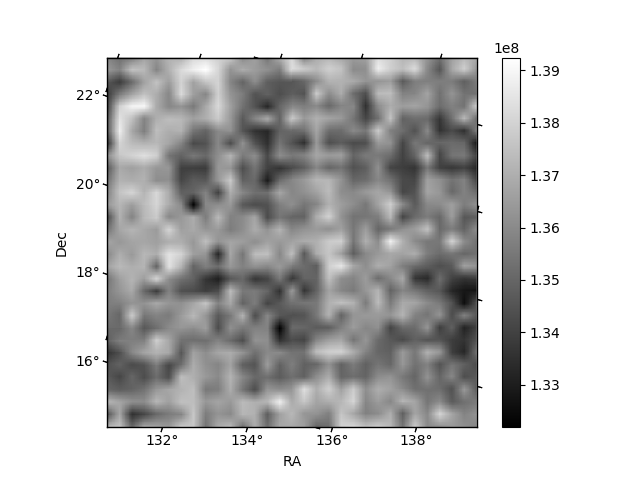
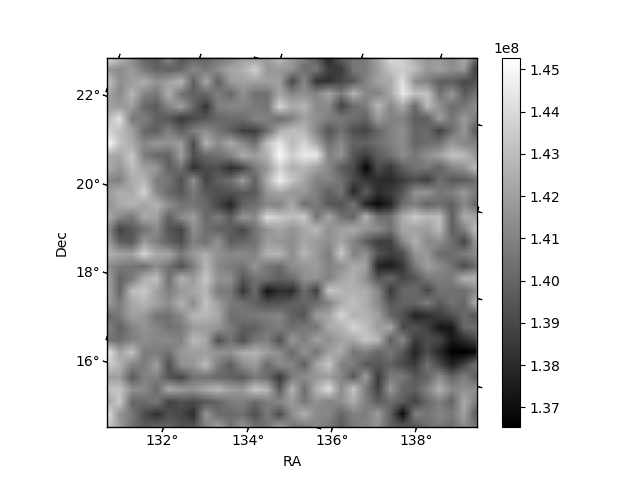
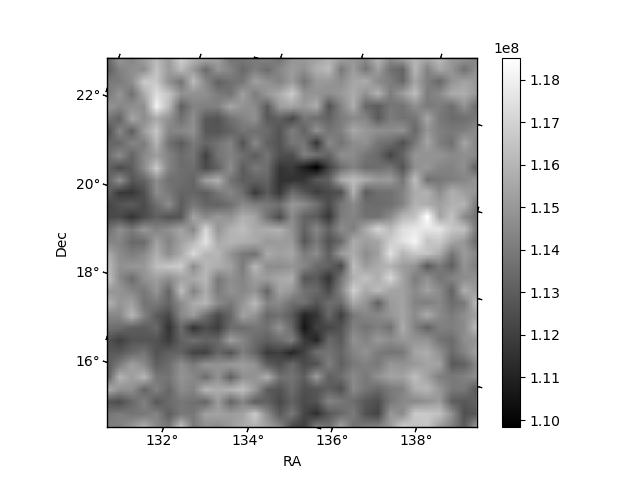
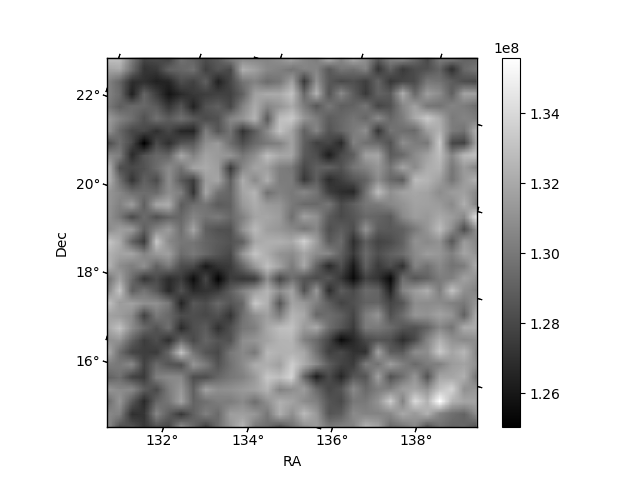
Histogram calculated using DETX and DETY for each event in the final _common_clean file
| Quadrant A | 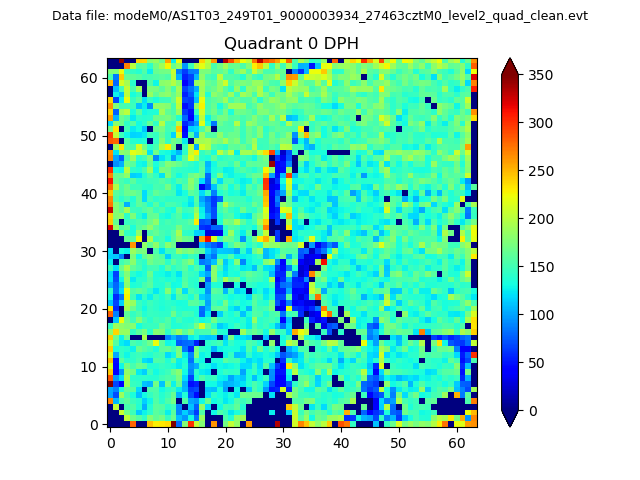 |
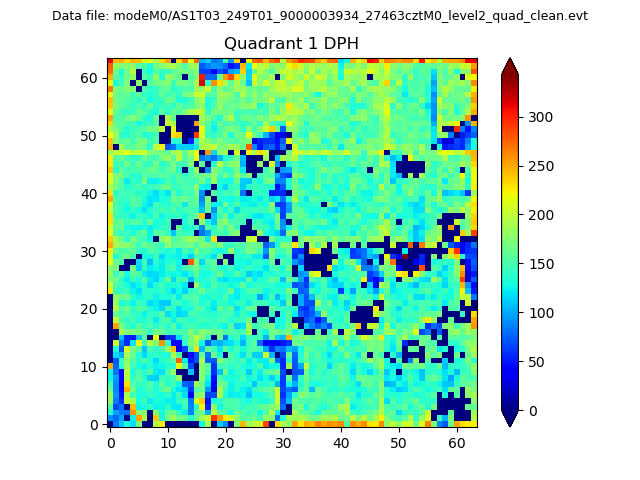 |
Quadrant B |
|---|---|---|---|
| Quadrant D | 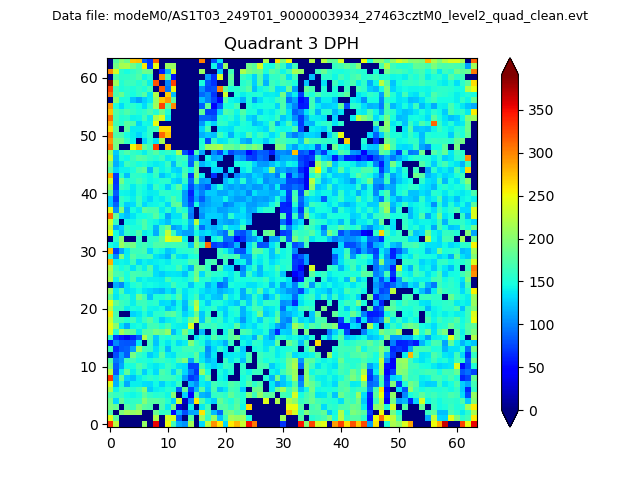 |
 |
Quadrant C |
| Plot type | Count rate plots | Images |
|---|---|---|
| Comparison with Poisson distribution Blue bars denote a histogram of data divided into 1 sec bins. Red curve is a Poisson curve with rate = median count rate of data. |
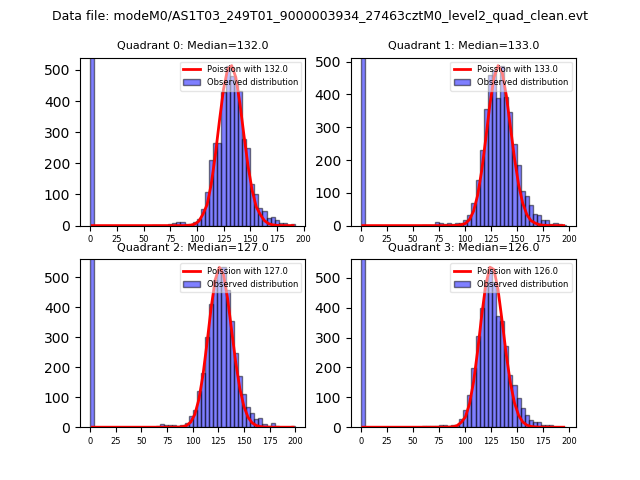 |
 |
| Quadrant-wise count rates Data is divided into 100 sec bins |
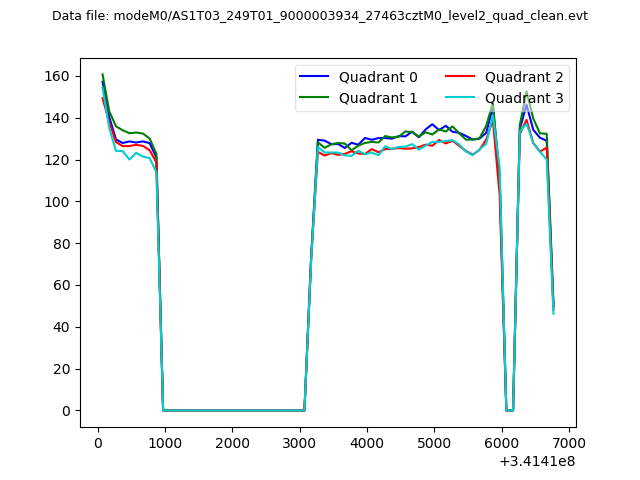 |
|
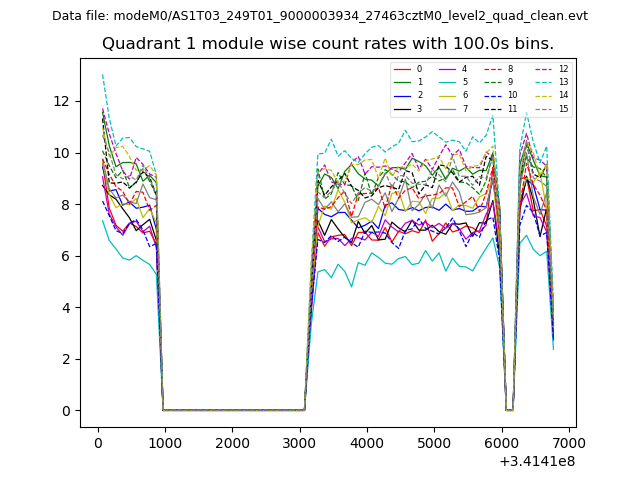
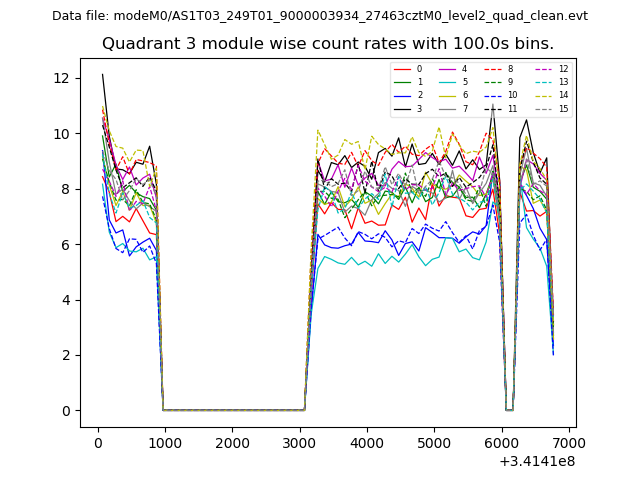
| Module-wise count rates for Quadrant A Data is divided into 100 sec bins |
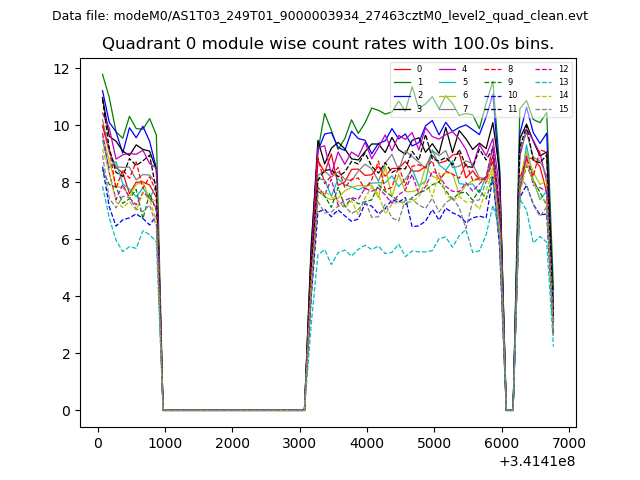 |
 |
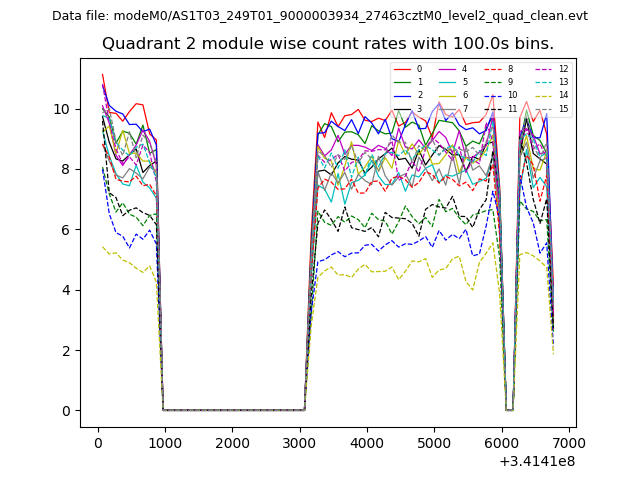
| Module-wise count rates for Quadrant B Data is divided into 100 sec bins |
 |
 |
| Module-wise count rates for Quadrant C Data is divided into 100 sec bins |
 |
 |
| Module-wise count rates for Quadrant D Data is divided into 100 sec bins |
 |
 |
| Parameter | Plot |
|---|---|
| CZT HV Monitor | 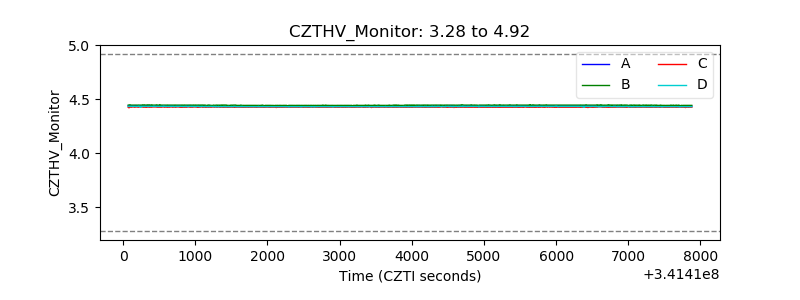 |
| D_VDD |  |
| Temperature 1 | 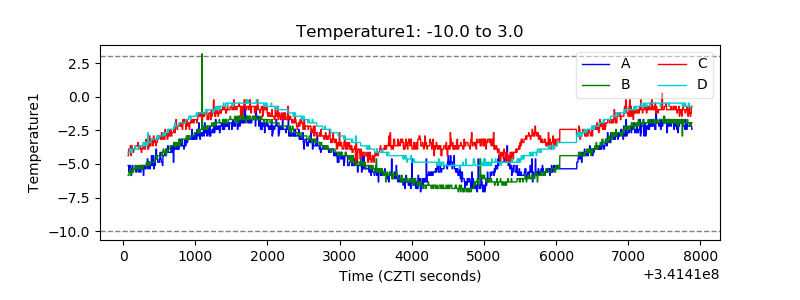 |
| Veto HV Monitor | 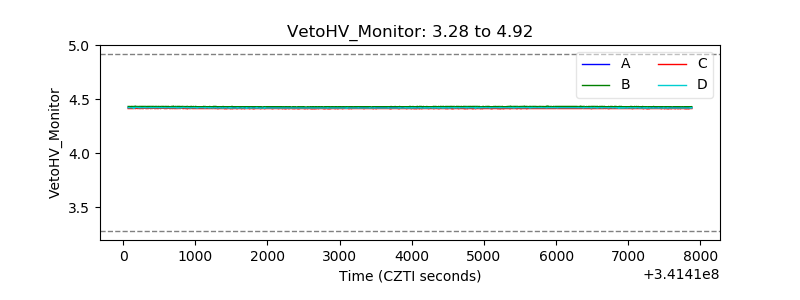 |
| Veto LLD | 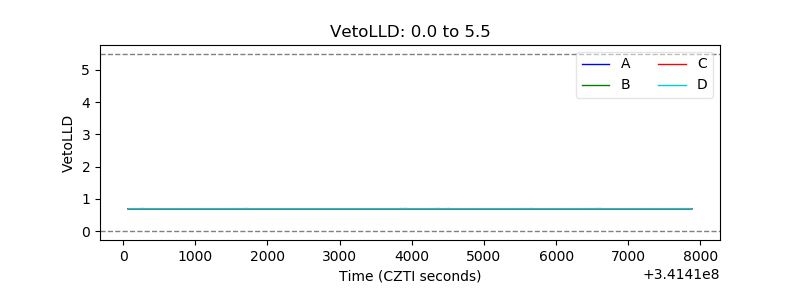 |
| Alpha Counter |  |
| _CPM_Rate | 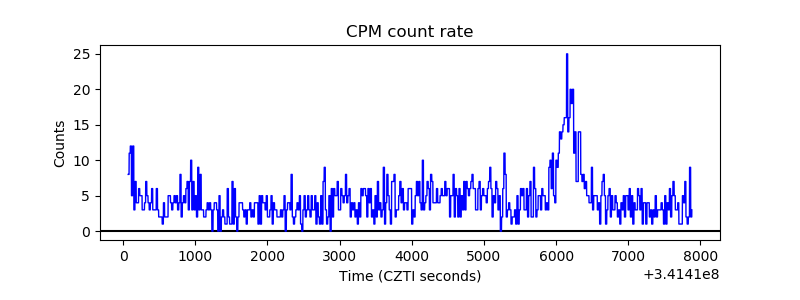 |
| CZT Counter | 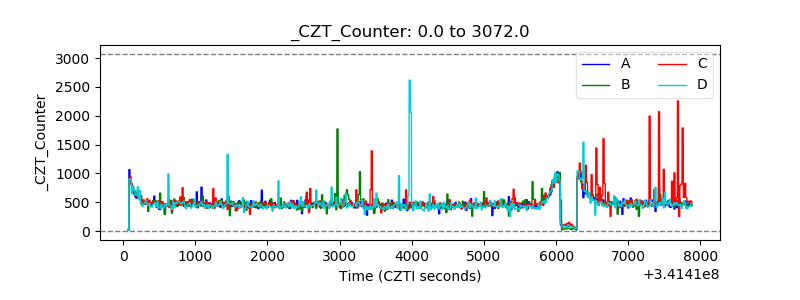 |
| +2.5 Volts monitor | 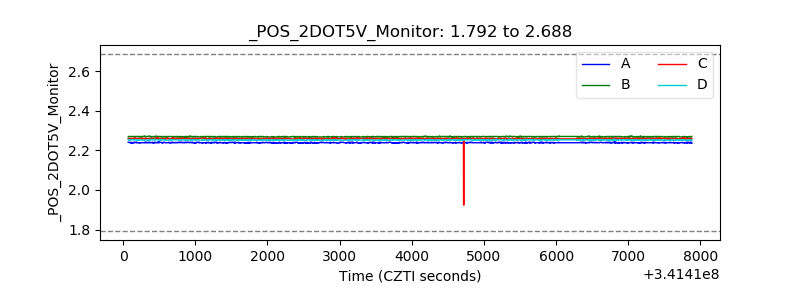 |
| +5 Volts monitor |  |
| _ROLL_ROT | 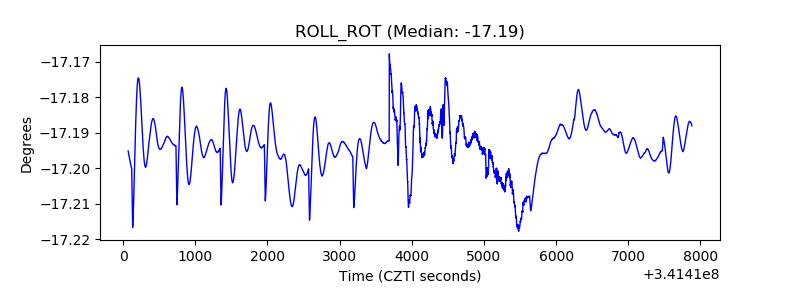 |
| _Roll_DEC | 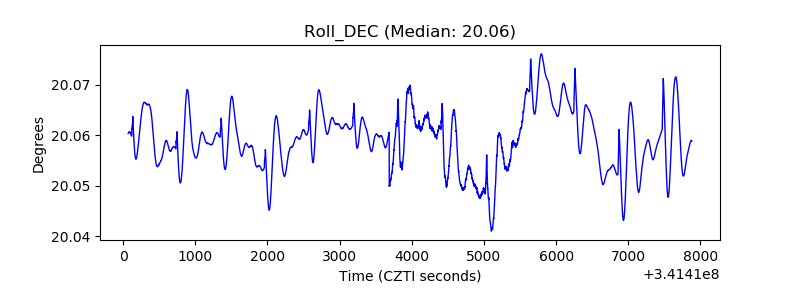 |
| _Roll_RA | 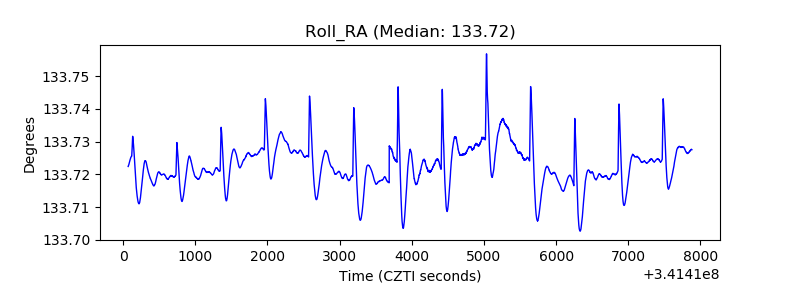 |
| Veto Counter | 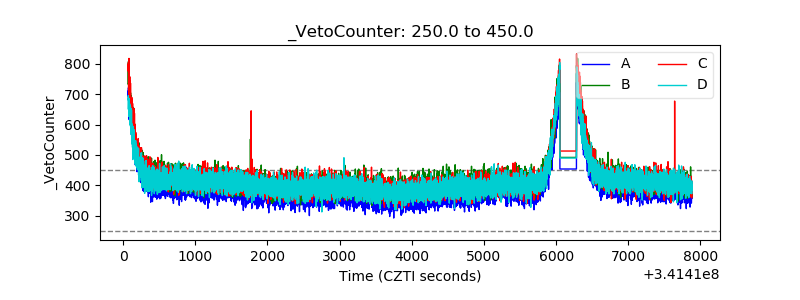 |