| Param | Original file | Final file |
|---|---|---|
| Filename | modeM0/AS1T03_249T01_9000003934_27464cztM0_level2.evt | modeM0/AS1T03_249T01_9000003934_27464cztM0_level2_quad_clean.evt |
| Size (bytes) | 521,844,480 | 81,434,880 |
| Size | 497.7 MB | 77.7 MB |
| Events in quadrant A | 3,685,887 | 495,938 |
| Events in quadrant B | 3,979,151 | 496,386 |
| Events in quadrant C | 3,894,629 | 473,293 |
| Events in quadrant D | 3,731,123 | 474,437 |
| Mode M0 | |||
|---|---|---|---|
| Quadrant | BADHDUFLAG | Total packets | Discarded packets |
| A | 0 | 15683 | 0 |
| B | 0 | 16476 | 0 |
| C | 0 | 16337 | 0 |
| D | 0 | 16161 | 0 |
| Mode M9 | |||
|---|---|---|---|
| Quadrant | BADHDUFLAG | Total packets | Discarded packets |
| A | 0 | 3 | 0 |
| B | 0 | 3 | 0 |
| C | 0 | 3 | 0 |
| D | 0 | 3 | 0 |
| Quadrant | Total seconds | Saturated seconds | Saturation percentage |
|---|---|---|---|
| A | 7559 | 110 | 1.455219% |
| B | 7560 | 172 | 2.275132% |
| C | 7560 | 229 | 3.029101% |
| D | 7560 | 113 | 1.494709% |
Noise dominated data is calculated using 1-second bins in cleaned event files. If a bin has >2000 counts, and if more than 50% of those come from <1% of pixels, then it is considered to be noise-dominated and hence unusable.
| Quadrant | # 1 sec bins | Bins with >0 counts | Bins with >2000 counts | High rate bins dominated by noise | Noise dominated (total time) | Noise dominated (detector-on time) | Marked lightcurve |
|---|---|---|---|---|---|---|---|
| A | 7859 | 7560 | 0 | 0 | 0.00% | 0.00% | 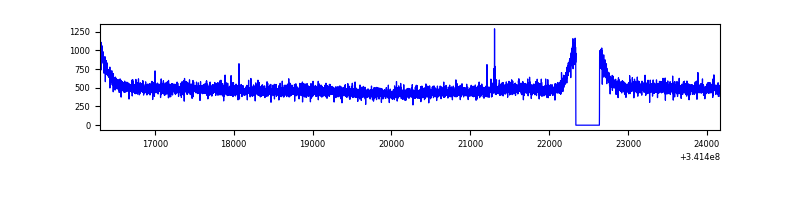 |
| B | 7860 | 7560 | 12 | 12 | 0.15% | 0.16% | 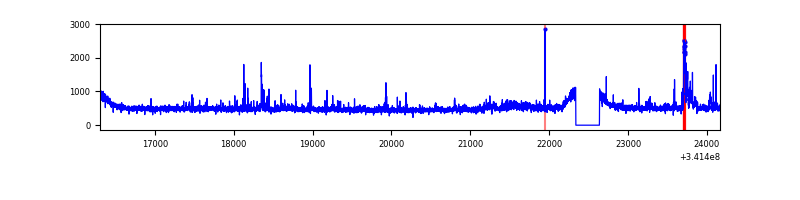 |
| C | 7860 | 7560 | 23 | 23 | 0.29% | 0.30% | 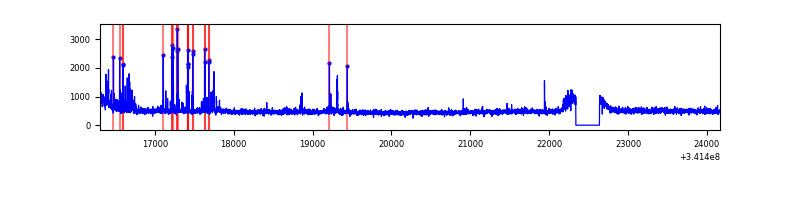 |
| D | 7860 | 7560 | 19 | 19 | 0.24% | 0.25% | 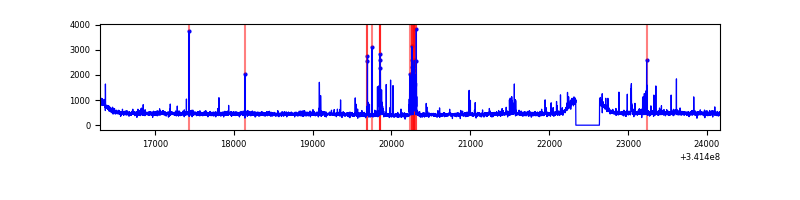 |
Top three noisy pixels from each quadrant. If the there are fewer than three noisy pixels in the level2.evt file, extra rows are filled as -1
| Pixel properties | Quadrant properties | ||||||
|---|---|---|---|---|---|---|---|
| Quadrant | DetID | PixID | Counts | Sigma | Mean | Median | Sigma |
| A | 13 | 254 | 12590 | 60.25 | 953 | 929 | 193.5 |
| A | 3 | 137 | 9563 | 44.61 | 953 | 929 | 193.5 |
| A | 0 | 226 | 8071 | 36.9 | 953 | 929 | 193.5 |
| B | 3 | 64 | 231740 | 1252.43 | 938 | 909 | 184.3 |
| B | 4 | 52 | 29992 | 157.8 | 938 | 909 | 184.3 |
| B | 12 | 111 | 22466 | 116.96 | 938 | 909 | 184.3 |
| C | 14 | 238 | 142277 | 657.9 | 906 | 912 | 214.9 |
| C | 15 | 208 | 115032 | 531.11 | 906 | 912 | 214.9 |
| C | 10 | 22 | 109284 | 504.36 | 906 | 912 | 214.9 |
| D | 1 | 52 | 121794 | 545.49 | 925 | 898 | 221.6 |
| D | 2 | 250 | 71885 | 320.3 | 925 | 898 | 221.6 |
| D | 2 | 234 | 32364 | 141.98 | 925 | 898 | 221.6 |
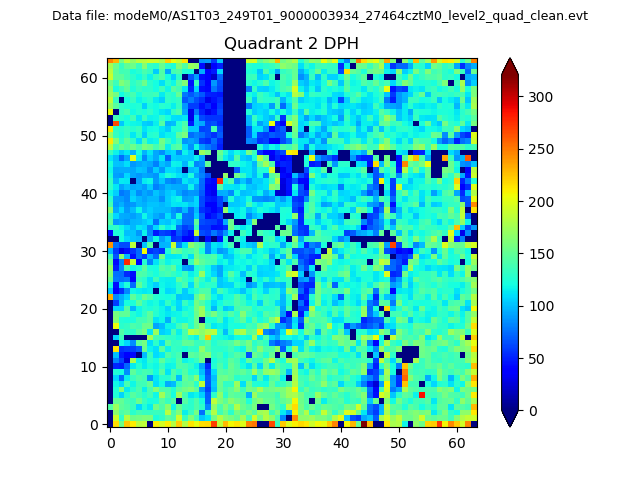
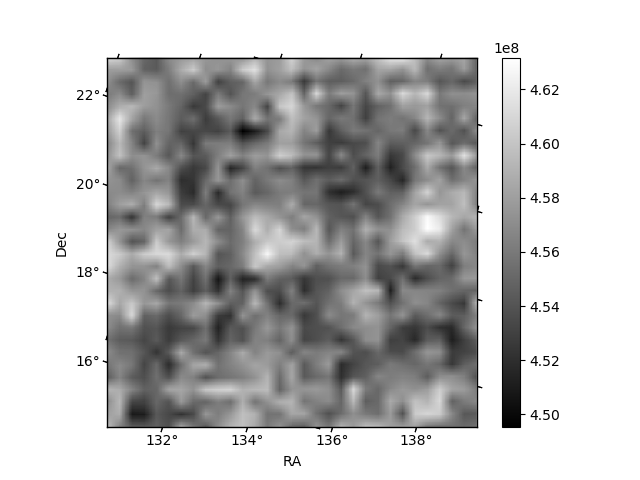
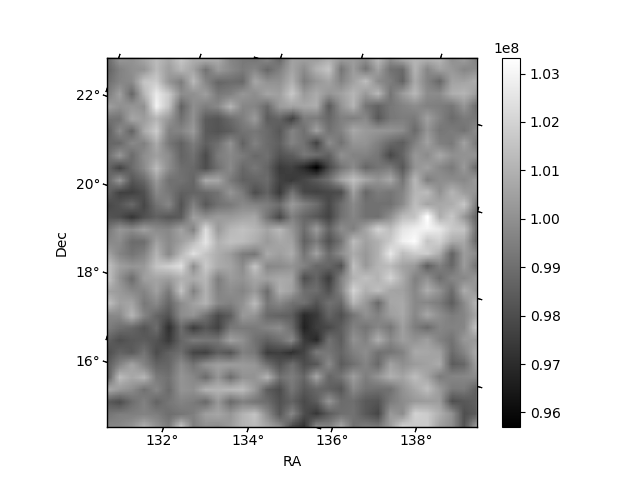
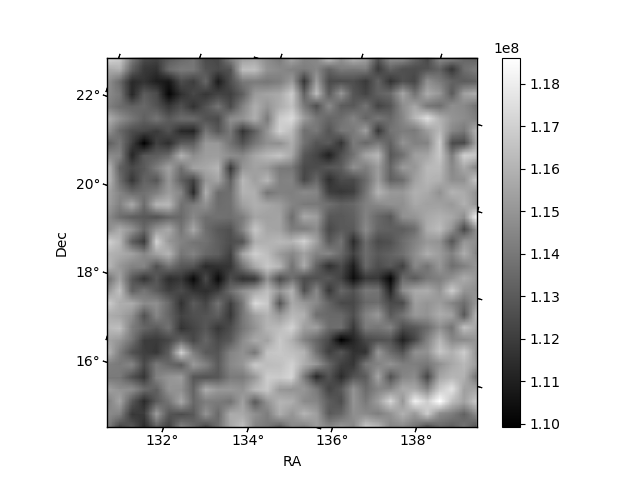
Histogram calculated using DETX and DETY for each event in the final _common_clean file
| Quadrant A | 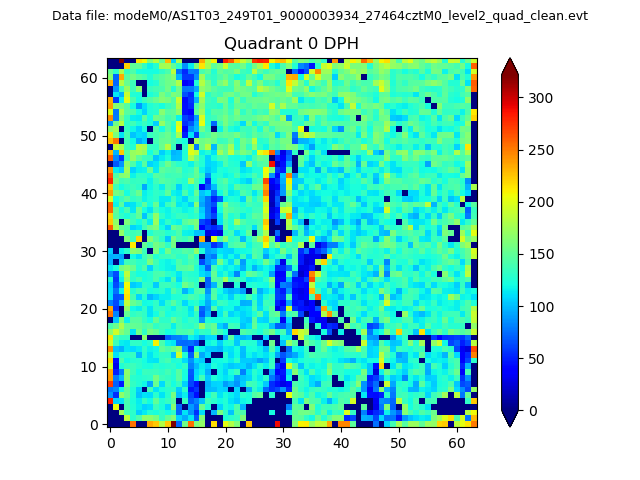 |
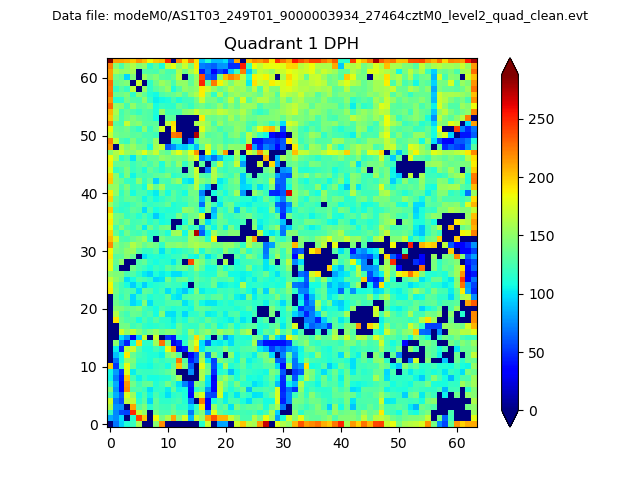 |
Quadrant B |
|---|---|---|---|
| Quadrant D | 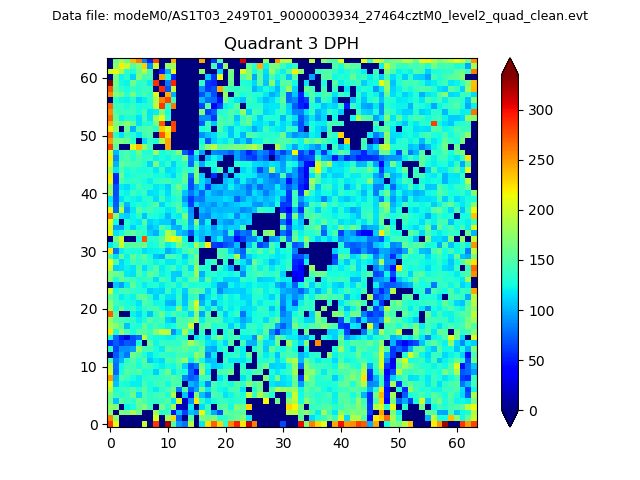 |
 |
Quadrant C |
| Plot type | Count rate plots | Images |
|---|---|---|
| Comparison with Poisson distribution Blue bars denote a histogram of data divided into 1 sec bins. Red curve is a Poisson curve with rate = median count rate of data. |
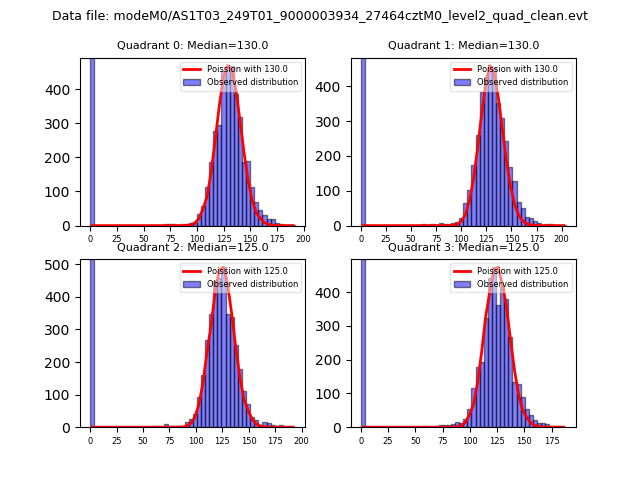 |
 |
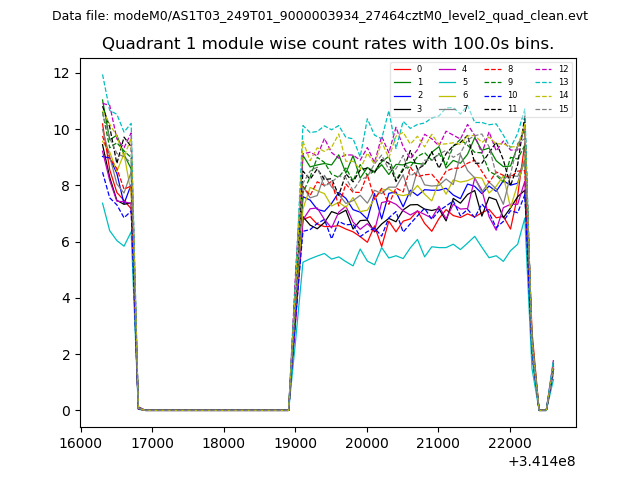
| Quadrant-wise count rates Data is divided into 100 sec bins |
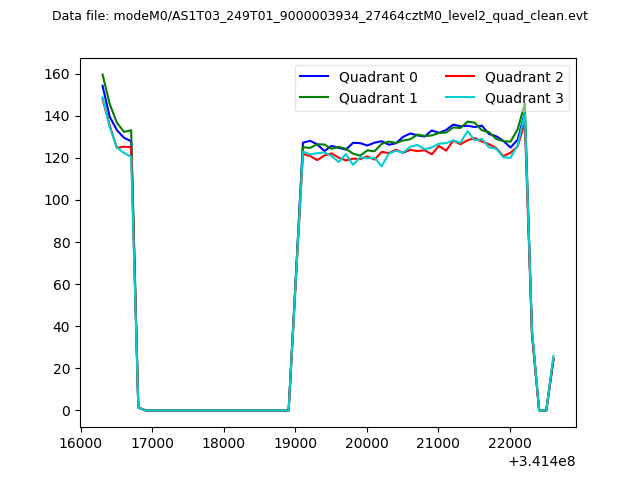 |
|
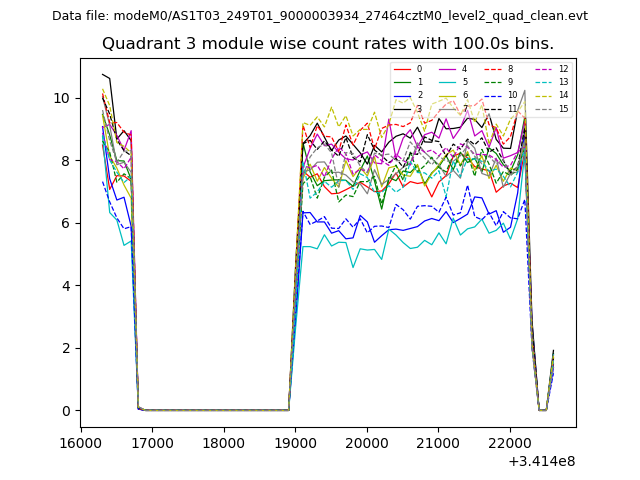
| Module-wise count rates for Quadrant A Data is divided into 100 sec bins |
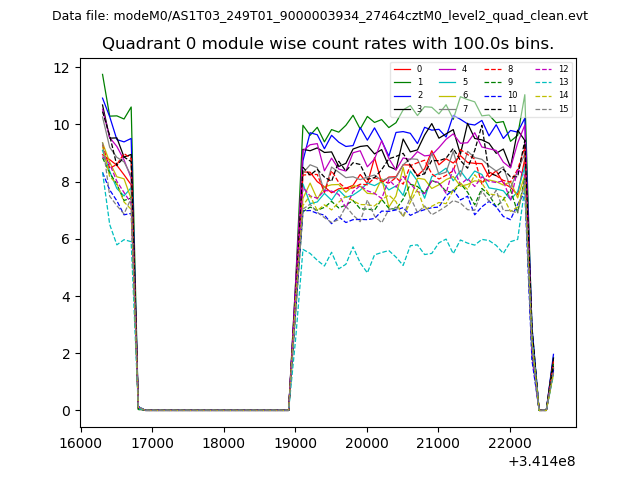 |
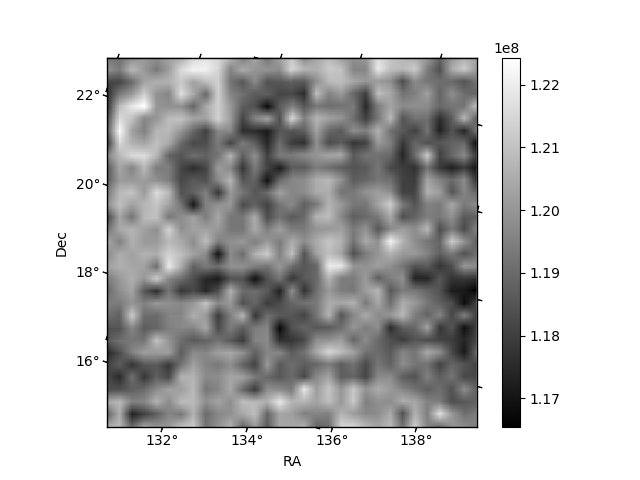 |
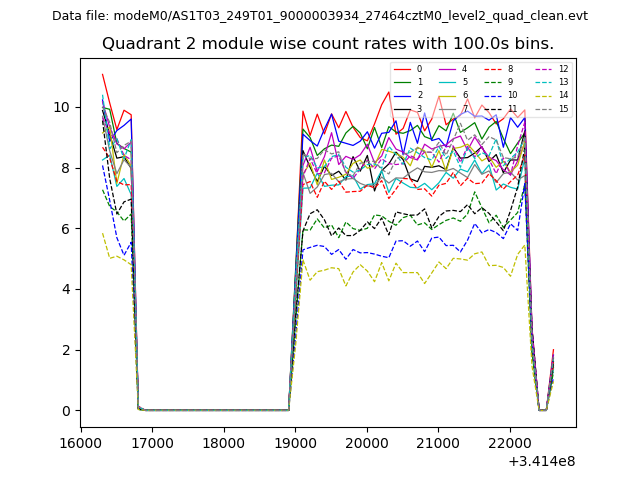
| Module-wise count rates for Quadrant B Data is divided into 100 sec bins |
 |
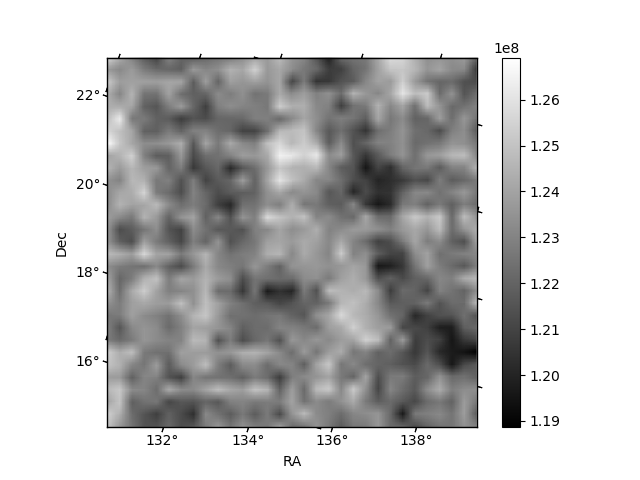 |
| Module-wise count rates for Quadrant C Data is divided into 100 sec bins |
 |
 |
| Module-wise count rates for Quadrant D Data is divided into 100 sec bins |
 |
 |
| Parameter | Plot |
|---|---|
| CZT HV Monitor | 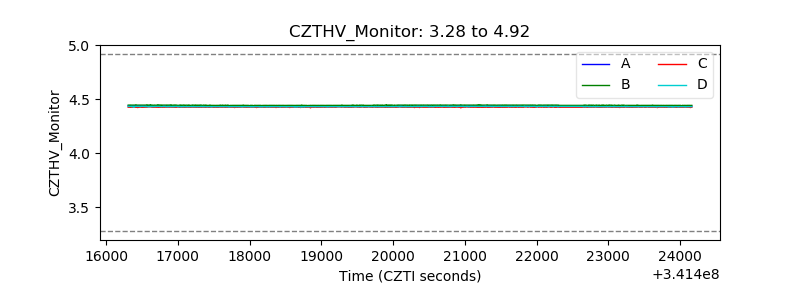 |
| D_VDD | 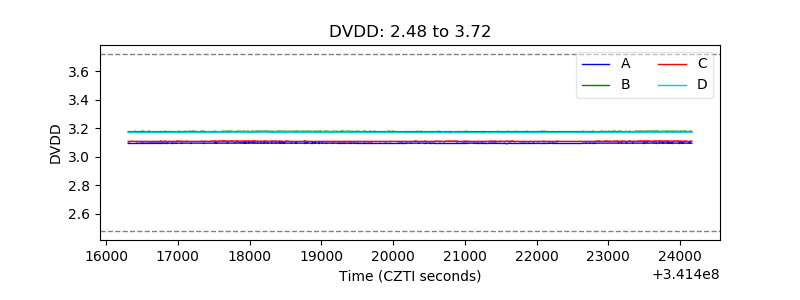 |
| Temperature 1 | 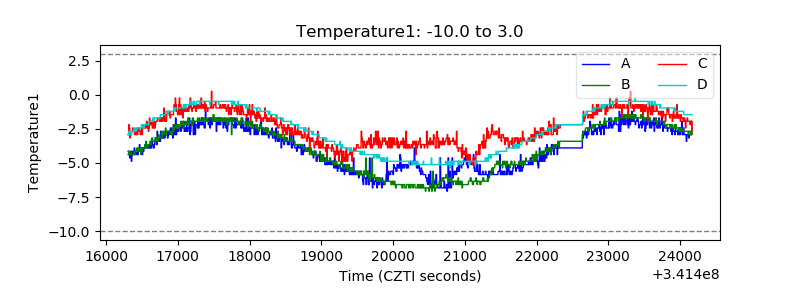 |
| Veto HV Monitor | 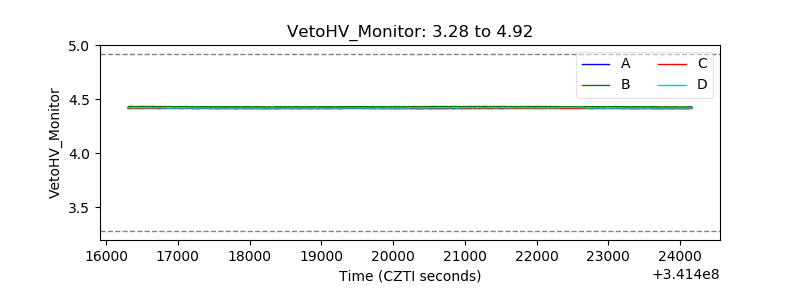 |
| Veto LLD | 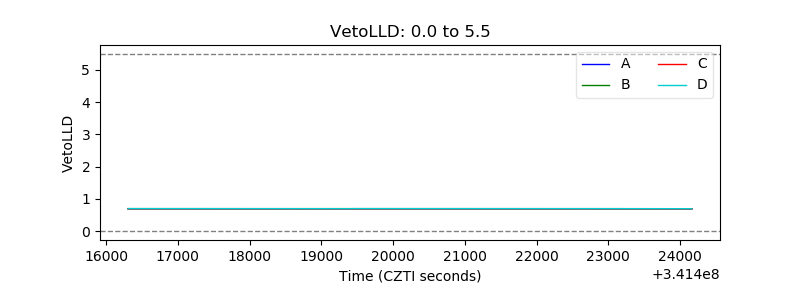 |
| Alpha Counter | 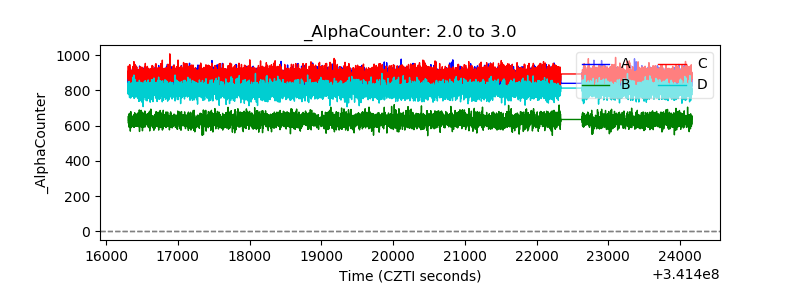 |
| _CPM_Rate | 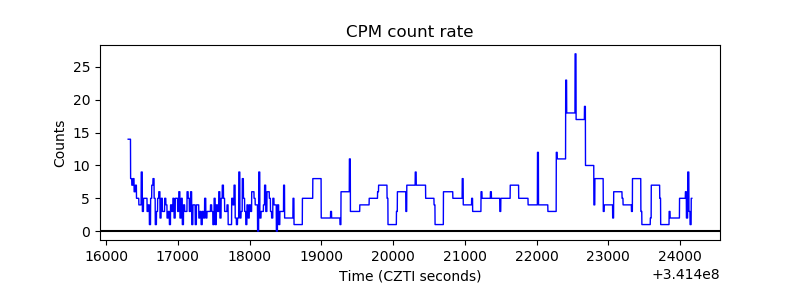 |
| CZT Counter | 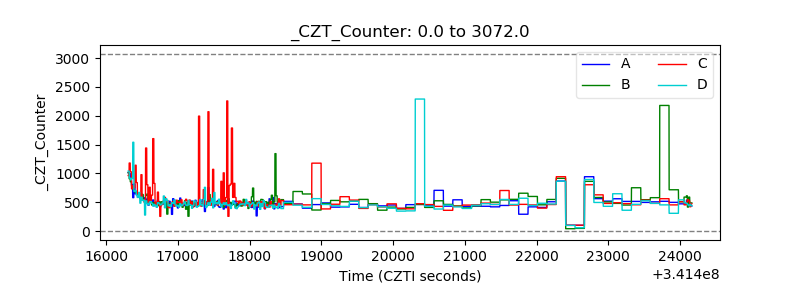 |
| +2.5 Volts monitor | 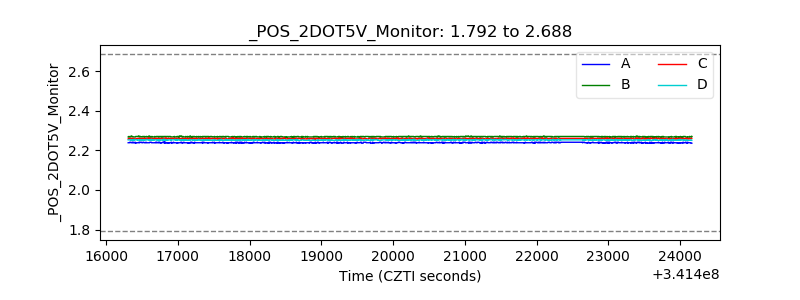 |
| +5 Volts monitor |  |
| _ROLL_ROT | 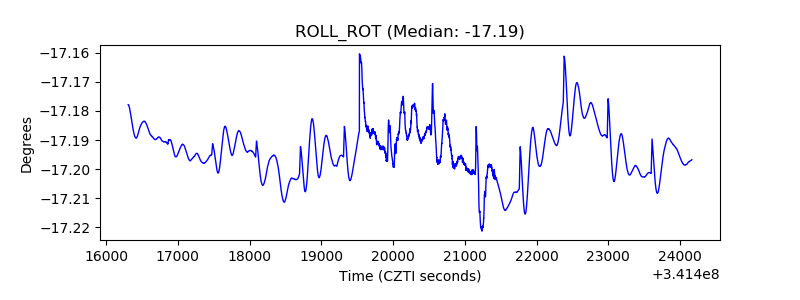 |
| _Roll_DEC | 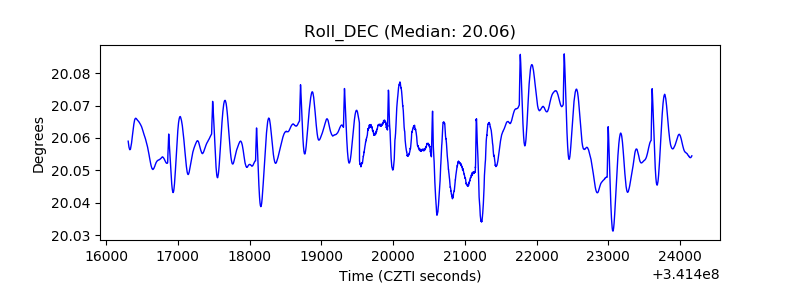 |
| _Roll_RA | 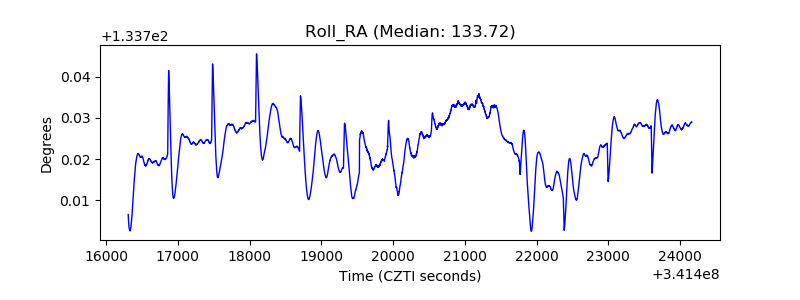 |
| Veto Counter | 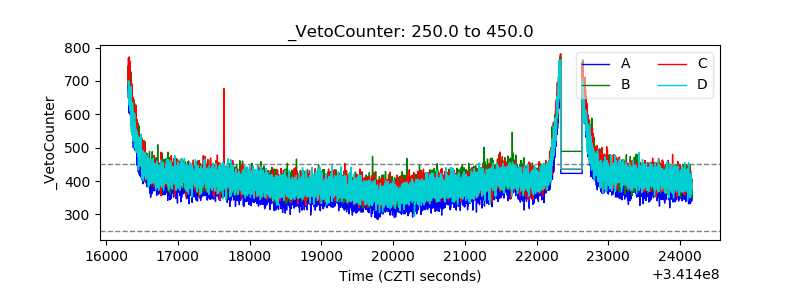 |