| Param | Original file | Final file |
|---|---|---|
| Filename | modeM0/AS1T03_249T01_9000003934_27467cztM0_level2.evt | modeM0/AS1T03_249T01_9000003934_27467cztM0_level2_quad_clean.evt |
| Size (bytes) | 609,269,760 | 104,921,280 |
| Size | 581.0 MB | 100.1 MB |
| Events in quadrant A | 4,285,705 | 651,166 |
| Events in quadrant B | 4,557,845 | 647,383 |
| Events in quadrant C | 4,323,648 | 621,512 |
| Events in quadrant D | 4,662,815 | 621,493 |
| Mode M0 | |||
|---|---|---|---|
| Quadrant | BADHDUFLAG | Total packets | Discarded packets |
| A | 0 | 18679 | 0 |
| B | 0 | 19469 | 0 |
| C | 0 | 18737 | 0 |
| D | 0 | 20190 | 0 |
| Mode M9 | |||
|---|---|---|---|
| Quadrant | BADHDUFLAG | Total packets | Discarded packets |
| A | 0 | 6 | 0 |
| B | 0 | 6 | 0 |
| C | 0 | 6 | 0 |
| D | 0 | 6 | 0 |
| Quadrant | Total seconds | Saturated seconds | Saturation percentage |
|---|---|---|---|
| A | 9169 | 36 | 0.392627% |
| B | 9168 | 72 | 0.785340% |
| C | 9168 | 103 | 1.123473% |
| D | 9169 | 81 | 0.883411% |
Noise dominated data is calculated using 1-second bins in cleaned event files. If a bin has >2000 counts, and if more than 50% of those come from <1% of pixels, then it is considered to be noise-dominated and hence unusable.
| Quadrant | # 1 sec bins | Bins with >0 counts | Bins with >2000 counts | High rate bins dominated by noise | Noise dominated (total time) | Noise dominated (detector-on time) | Marked lightcurve |
|---|---|---|---|---|---|---|---|
| A | 9694 | 9170 | 0 | 0 | 0.00% | 0.00% | 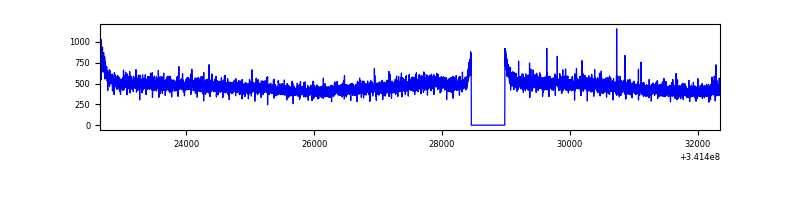 |
| B | 9693 | 9169 | 16 | 16 | 0.17% | 0.17% | 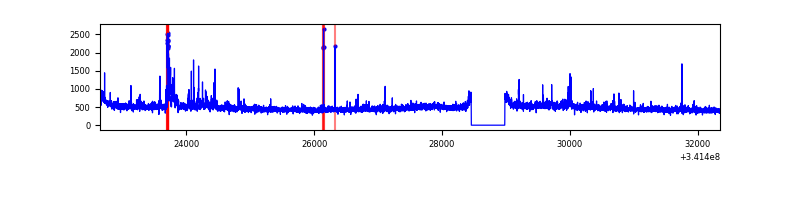 |
| C | 9693 | 9169 | 5 | 5 | 0.05% | 0.05% | 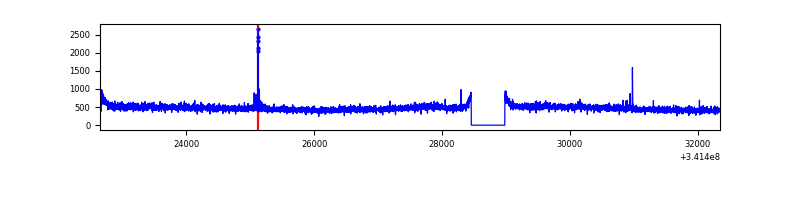 |
| D | 9694 | 9170 | 63 | 63 | 0.65% | 0.69% | 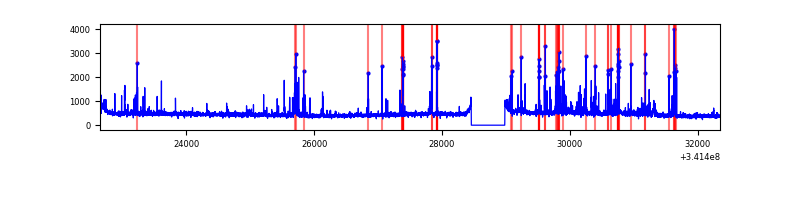 |
Top three noisy pixels from each quadrant. If the there are fewer than three noisy pixels in the level2.evt file, extra rows are filled as -1
| Pixel properties | Quadrant properties | ||||||
|---|---|---|---|---|---|---|---|
| Quadrant | DetID | PixID | Counts | Sigma | Mean | Median | Sigma |
| A | 13 | 254 | 15923 | 65.83 | 1109 | 1085 | 225.4 |
| A | 3 | 137 | 10696 | 42.64 | 1109 | 1085 | 225.4 |
| A | 0 | 226 | 9313 | 36.5 | 1109 | 1085 | 225.4 |
| B | 3 | 64 | 175436 | 820.61 | 1094 | 1062 | 212.5 |
| B | 15 | 32 | 26402 | 119.25 | 1094 | 1062 | 212.5 |
| B | 12 | 111 | 26118 | 117.91 | 1094 | 1062 | 212.5 |
| C | 14 | 238 | 167722 | 666.38 | 1058 | 1064 | 250.1 |
| C | 10 | 22 | 32713 | 126.55 | 1058 | 1064 | 250.1 |
| C | 13 | 61 | 7280 | 24.85 | 1058 | 1064 | 250.1 |
| D | 1 | 52 | 250698 | 964.95 | 1071 | 1039 | 258.7 |
| D | 2 | 250 | 228136 | 877.75 | 1071 | 1039 | 258.7 |
| D | 2 | 120 | 90711 | 346.59 | 1071 | 1039 | 258.7 |
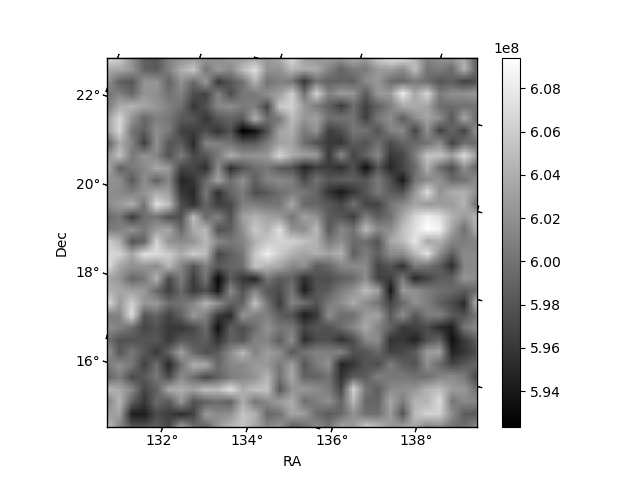
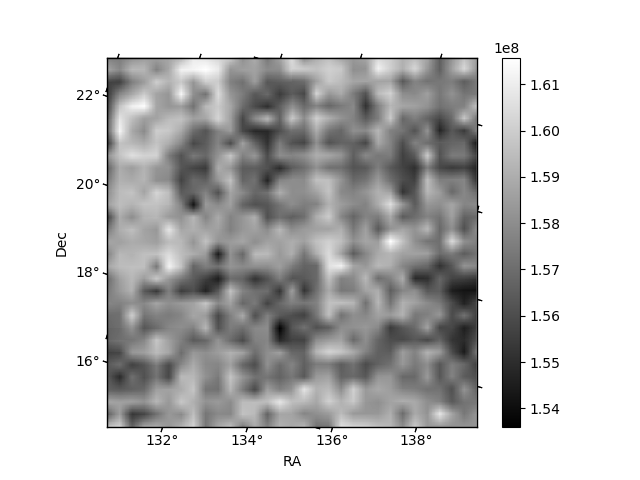
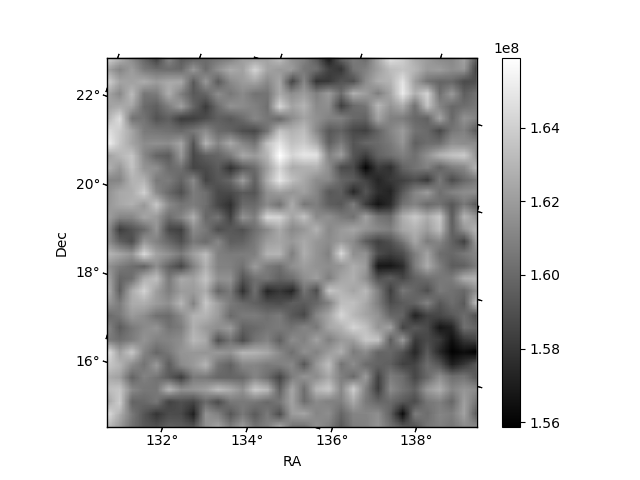
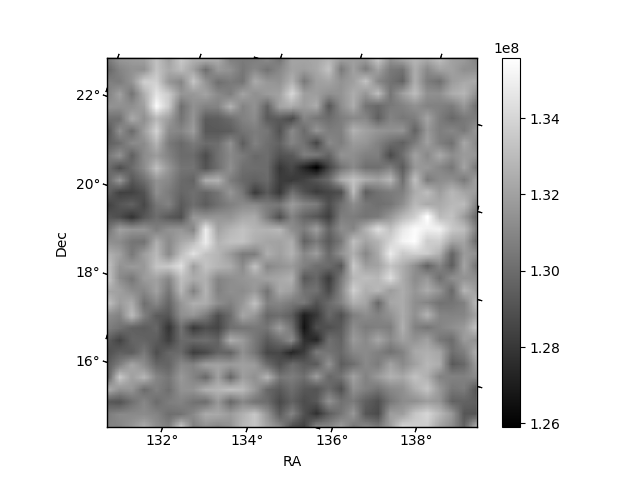
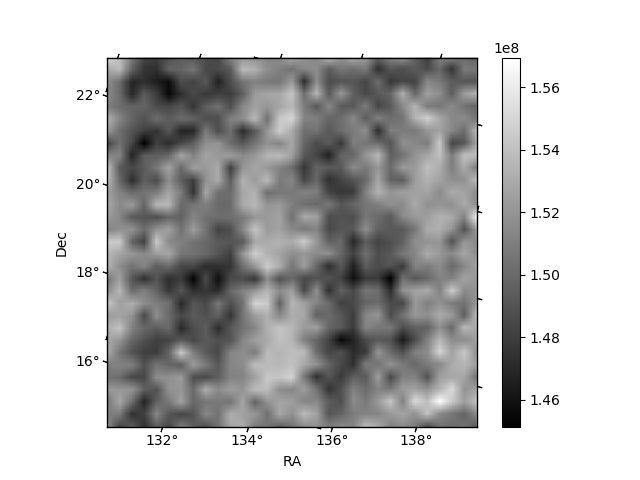
Histogram calculated using DETX and DETY for each event in the final _common_clean file
| Quadrant A | 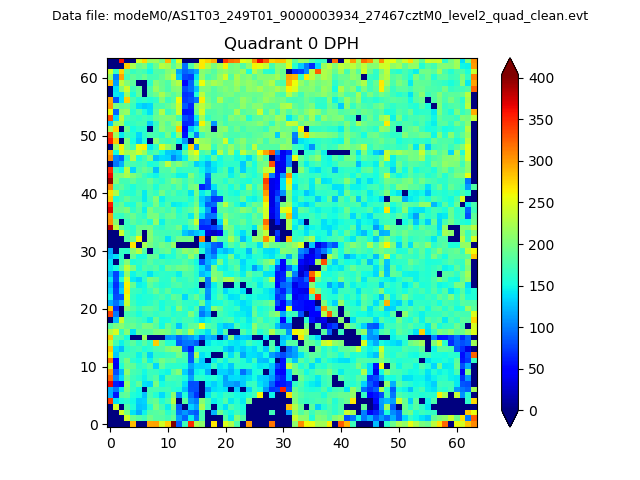 |
 |
Quadrant B |
|---|---|---|---|
| Quadrant D | 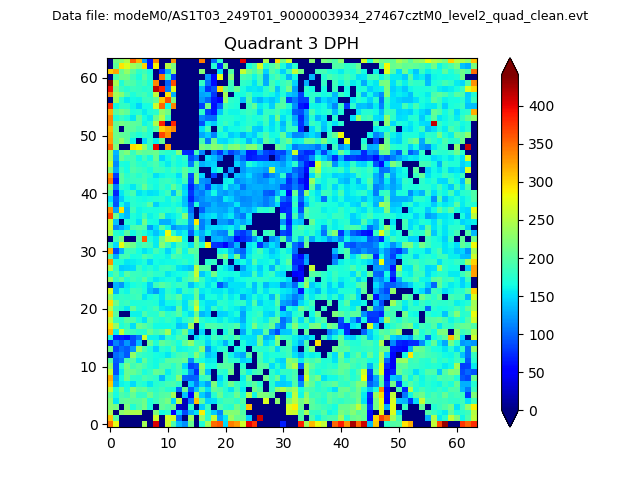 |
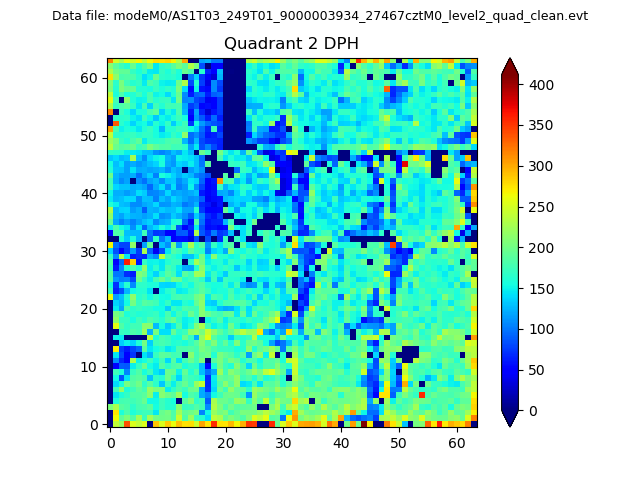 |
Quadrant C |
| Plot type | Count rate plots | Images |
|---|---|---|
| Comparison with Poisson distribution Blue bars denote a histogram of data divided into 1 sec bins. Red curve is a Poisson curve with rate = median count rate of data. |
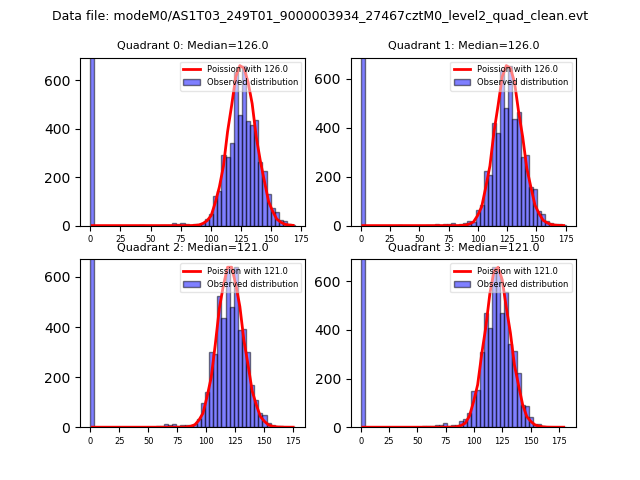 |
 |
| Quadrant-wise count rates Data is divided into 100 sec bins |
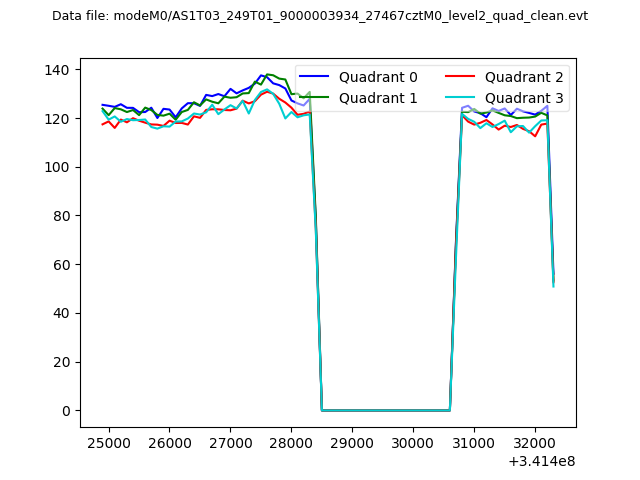 |
|
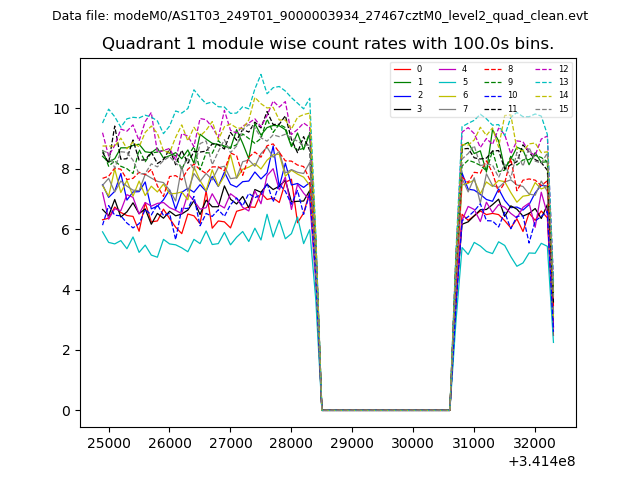
| Module-wise count rates for Quadrant A Data is divided into 100 sec bins |
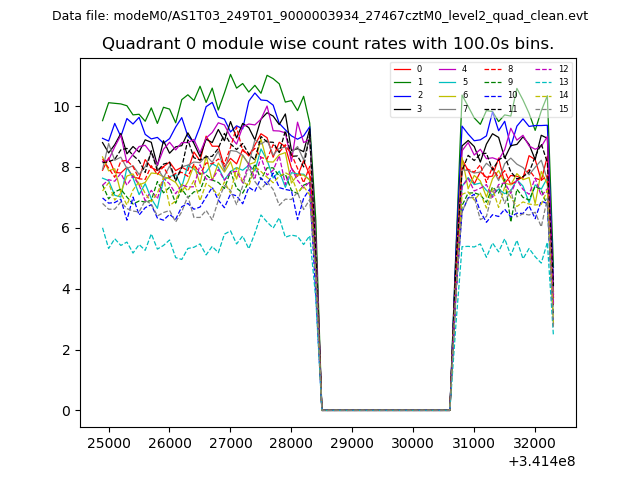 |
 |
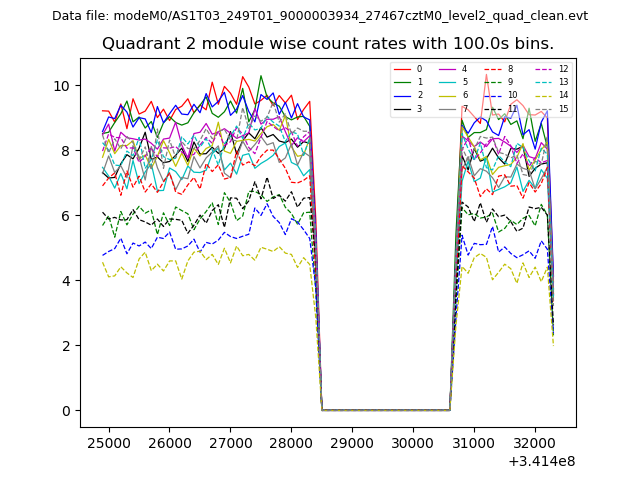
| Module-wise count rates for Quadrant B Data is divided into 100 sec bins |
 |
 |
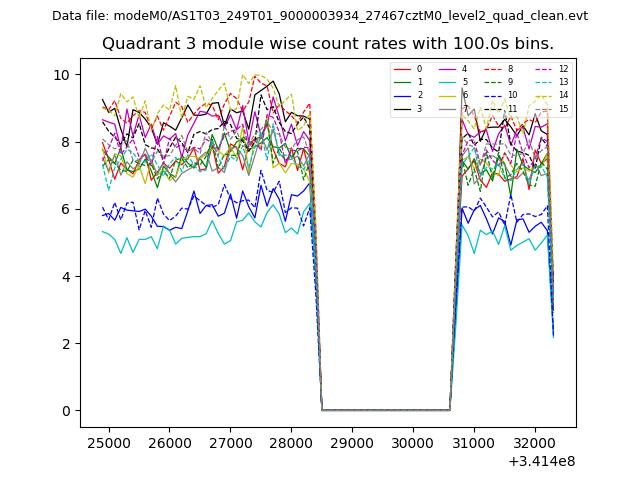
| Module-wise count rates for Quadrant C Data is divided into 100 sec bins |
 |
 |
| Module-wise count rates for Quadrant D Data is divided into 100 sec bins |
 |
 |
| Parameter | Plot |
|---|---|
| CZT HV Monitor | 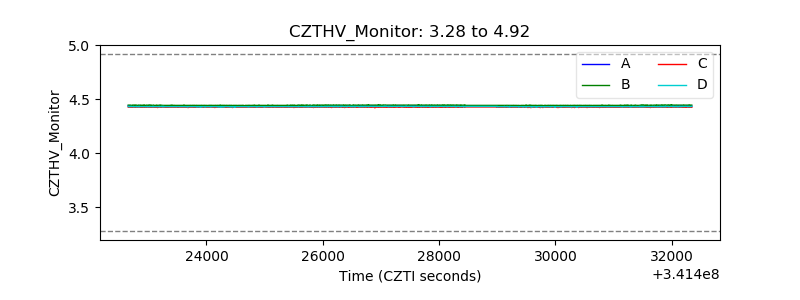 |
| D_VDD | 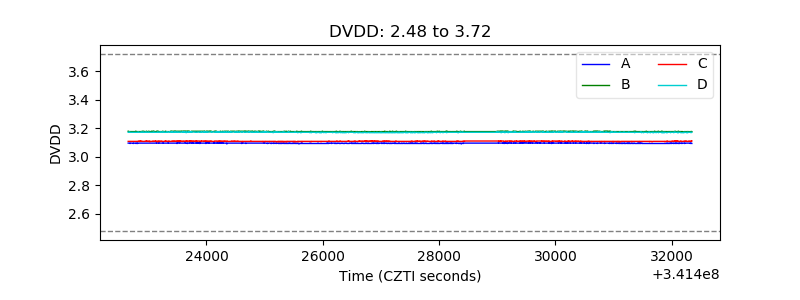 |
| Temperature 1 | 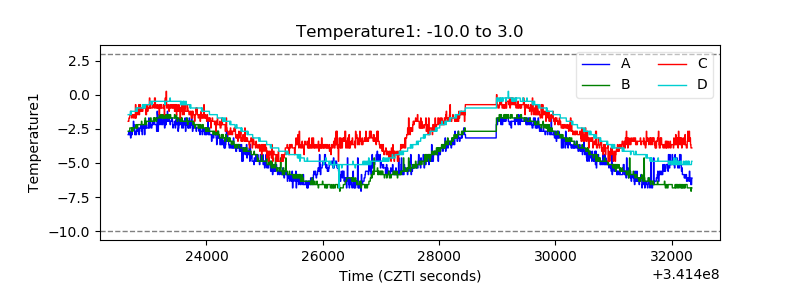 |
| Veto HV Monitor | 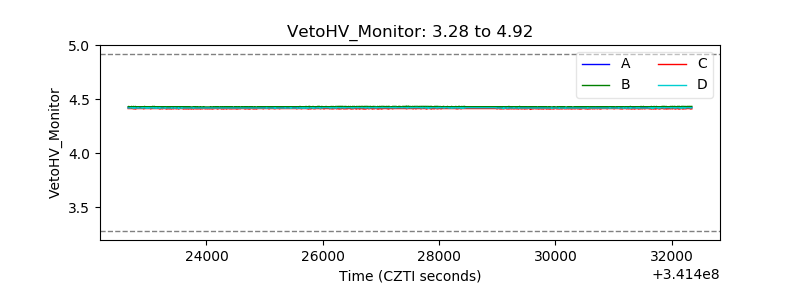 |
| Veto LLD | 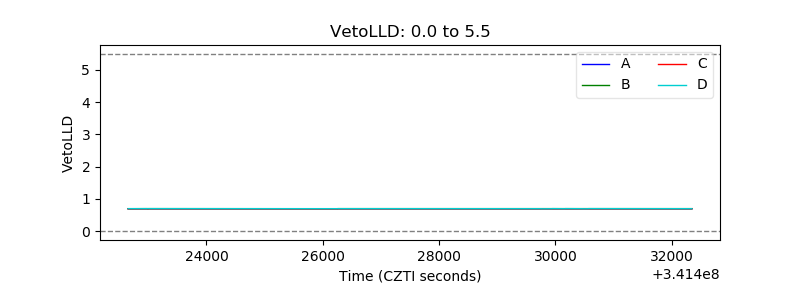 |
| Alpha Counter | 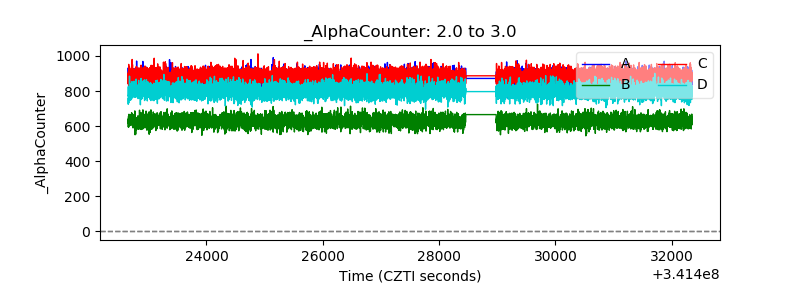 |
| _CPM_Rate | 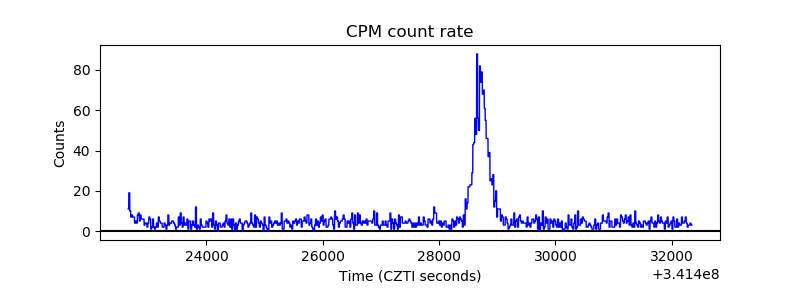 |
| CZT Counter | 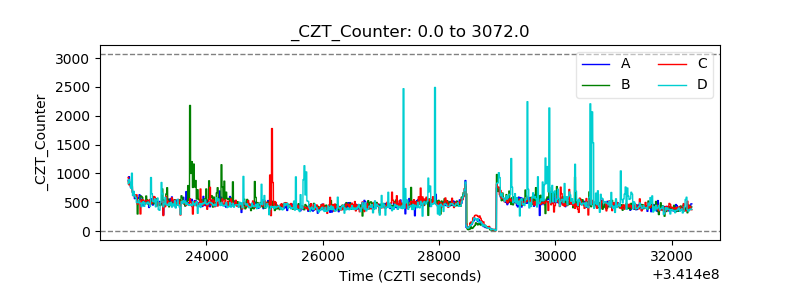 |
| +2.5 Volts monitor |  |
| +5 Volts monitor |  |
| _ROLL_ROT | 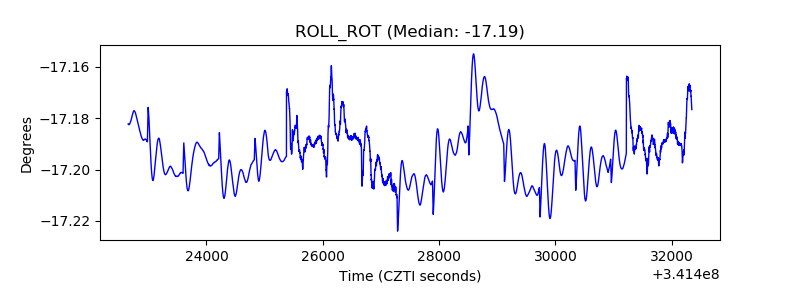 |
| _Roll_DEC | 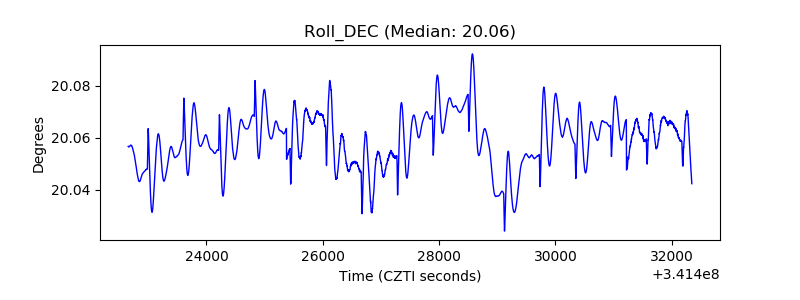 |
| _Roll_RA | 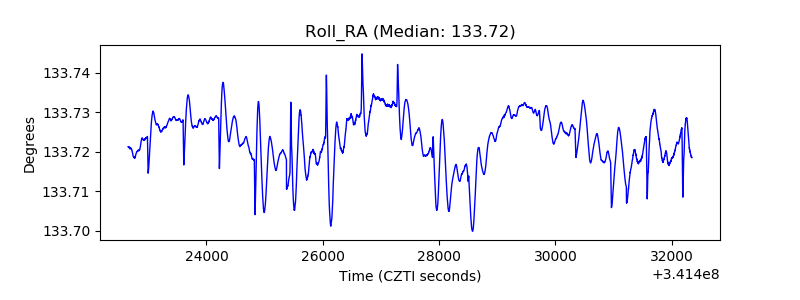 |
| Veto Counter | 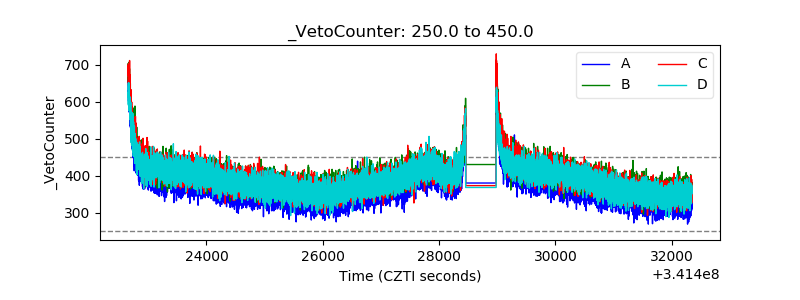 |