| Param | Original file | Final file |
|---|---|---|
| Filename | modeM0/AS1T03_249T01_9000003934_27470cztM0_level2.evt | modeM0/AS1T03_249T01_9000003934_27470cztM0_level2_quad_clean.evt |
| Size (bytes) | 484,493,760 | 101,508,480 |
| Size | 462.0 MB | 96.8 MB |
| Events in quadrant A | 3,178,437 | 675,516 |
| Events in quadrant B | 3,955,058 | 662,762 |
| Events in quadrant C | 3,410,308 | 645,690 |
| Events in quadrant D | 3,687,026 | 636,220 |
| Mode M0 | |||
|---|---|---|---|
| Quadrant | BADHDUFLAG | Total packets | Discarded packets |
| A | 0 | 13681 | 0 |
| B | 0 | 16015 | 0 |
| C | 0 | 14406 | 0 |
| D | 0 | 15497 | 0 |
| Mode M9 | |||
|---|---|---|---|
| Quadrant | BADHDUFLAG | Total packets | Discarded packets |
| A | 0 | 19 | 0 |
| B | 0 | 20 | 0 |
| C | 0 | 20 | 0 |
| D | 0 | 20 | 0 |
| Quadrant | Total seconds | Saturated seconds | Saturation percentage |
|---|---|---|---|
| A | 6507 | 26 | 0.399570% |
| B | 6507 | 401 | 6.162594% |
| C | 6507 | 129 | 1.982480% |
| D | 6507 | 139 | 2.136161% |
Noise dominated data is calculated using 1-second bins in cleaned event files. If a bin has >2000 counts, and if more than 50% of those come from <1% of pixels, then it is considered to be noise-dominated and hence unusable.
| Quadrant | # 1 sec bins | Bins with >0 counts | Bins with >2000 counts | High rate bins dominated by noise | Noise dominated (total time) | Noise dominated (detector-on time) | Marked lightcurve |
|---|---|---|---|---|---|---|---|
| A | 7602 | 6508 | 0 | 0 | 0.00% | 0.00% | 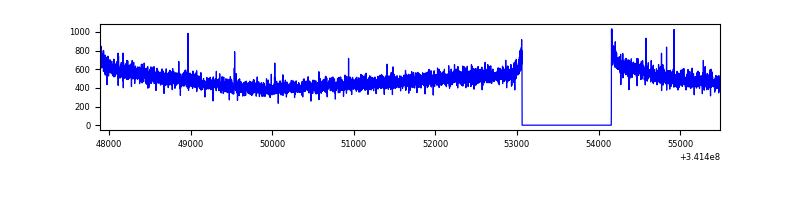 |
| B | 7602 | 6508 | 220 | 220 | 2.89% | 3.38% | 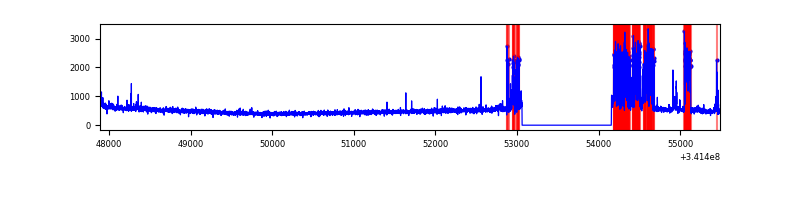 |
| C | 7602 | 6508 | 32 | 32 | 0.42% | 0.49% | 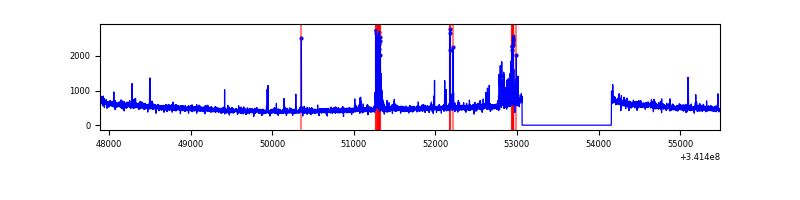 |
| D | 7602 | 6507 | 48 | 48 | 0.63% | 0.74% | 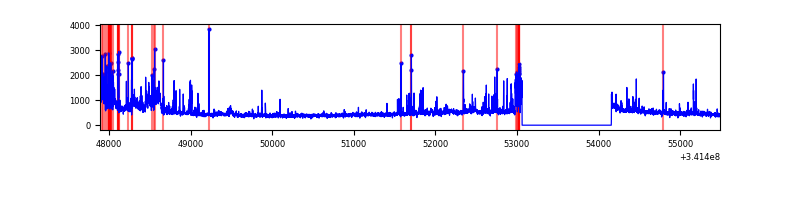 |
Top three noisy pixels from each quadrant. If the there are fewer than three noisy pixels in the level2.evt file, extra rows are filled as -1
| Pixel properties | Quadrant properties | ||||||
|---|---|---|---|---|---|---|---|
| Quadrant | DetID | PixID | Counts | Sigma | Mean | Median | Sigma |
| A | 0 | 13 | 16425 | 94.74 | 819 | 802 | 164.9 |
| A | 13 | 254 | 10819 | 60.75 | 819 | 802 | 164.9 |
| A | 3 | 137 | 7743 | 42.09 | 819 | 802 | 164.9 |
| B | 3 | 64 | 808561 | 5341.75 | 798 | 779 | 151.2 |
| B | 12 | 111 | 18761 | 118.91 | 798 | 779 | 151.2 |
| B | 11 | 111 | 16822 | 106.09 | 798 | 779 | 151.2 |
| C | 14 | 238 | 126642 | 683.65 | 783 | 791 | 184.1 |
| C | 2 | 16 | 117281 | 632.8 | 783 | 791 | 184.1 |
| C | 10 | 22 | 79479 | 427.45 | 783 | 791 | 184.1 |
| D | 1 | 52 | 398298 | 2134.45 | 781 | 761 | 186.2 |
| D | 12 | 227 | 233244 | 1248.24 | 781 | 761 | 186.2 |
| D | 2 | 250 | 57964 | 307.13 | 781 | 761 | 186.2 |
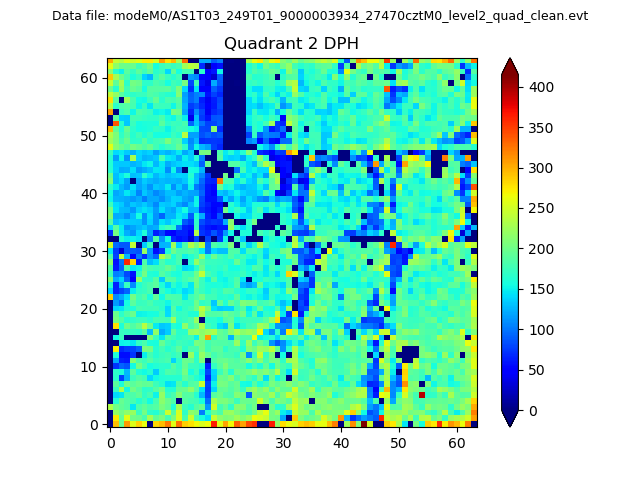
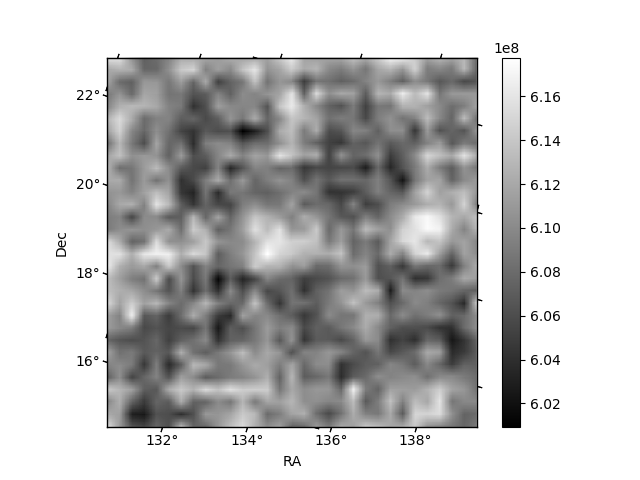
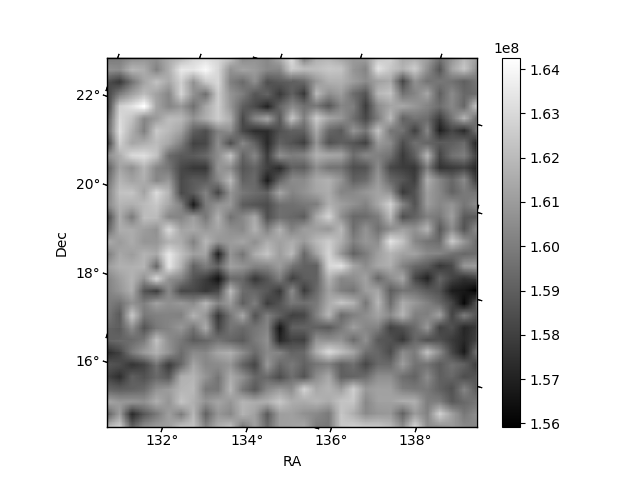
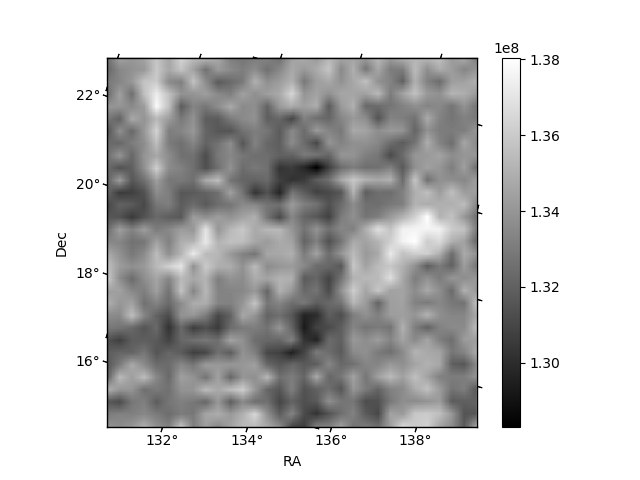
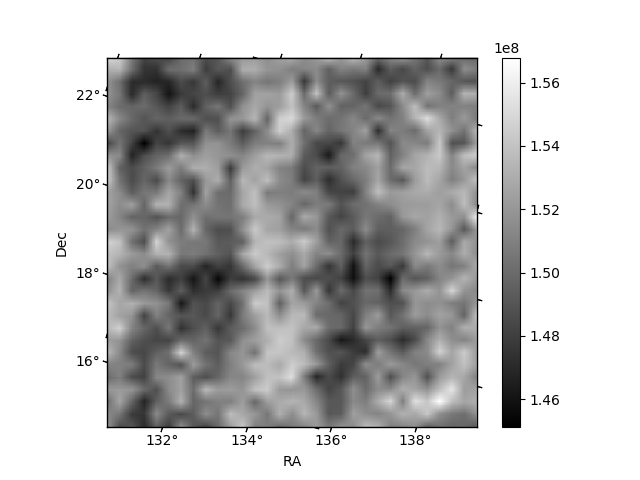
Histogram calculated using DETX and DETY for each event in the final _common_clean file
| Quadrant A | 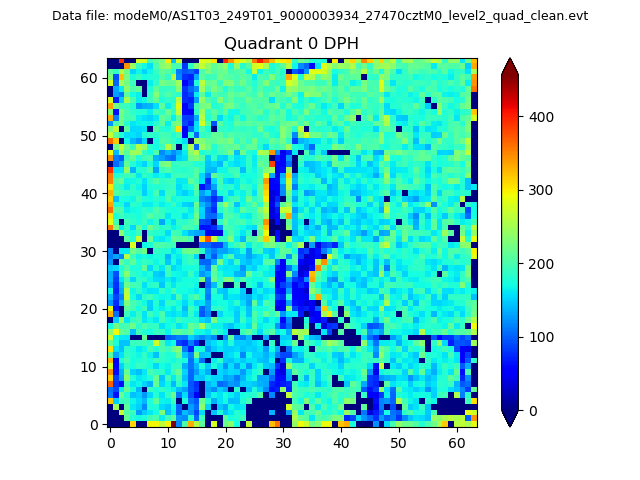 |
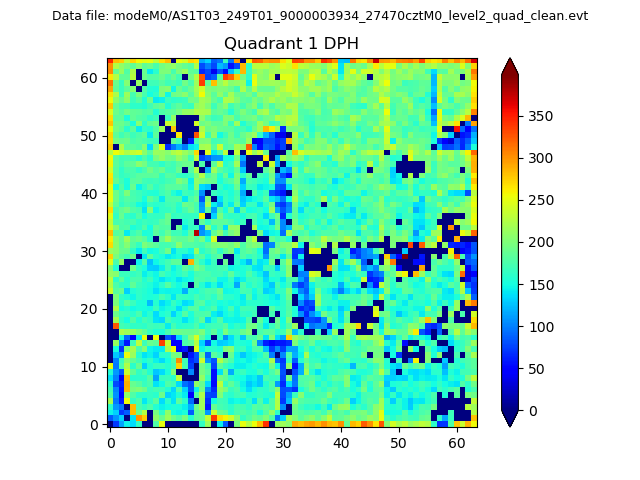 |
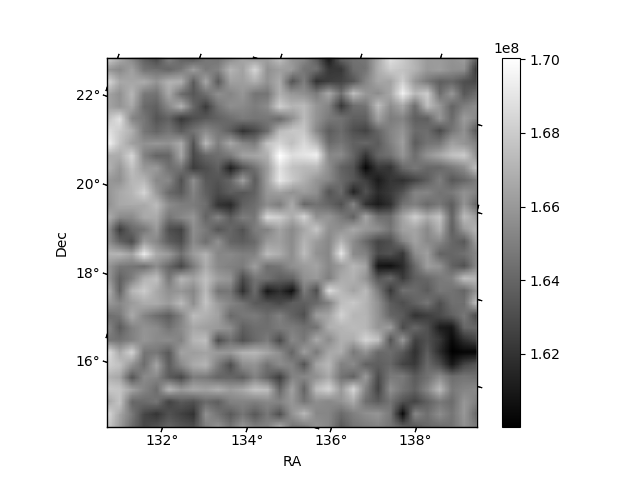
Quadrant B |
|---|---|---|---|
| Quadrant D | 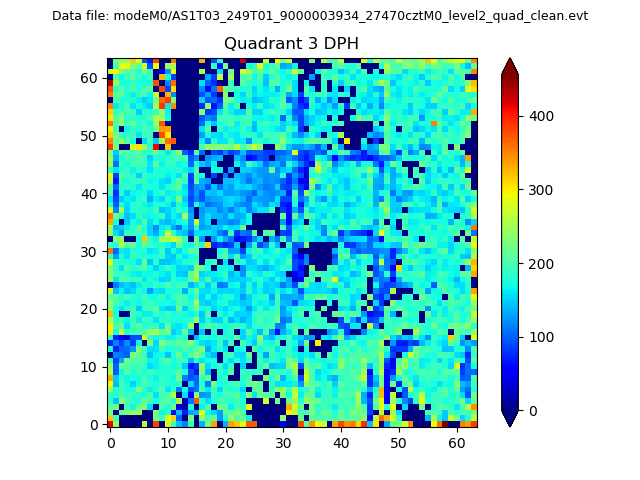 |
 |
Quadrant C |
| Plot type | Count rate plots | Images |
|---|---|---|
| Comparison with Poisson distribution Blue bars denote a histogram of data divided into 1 sec bins. Red curve is a Poisson curve with rate = median count rate of data. |
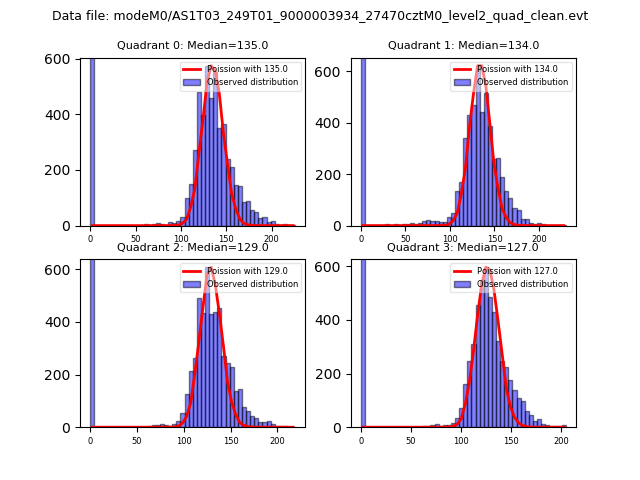 |
 |
| Quadrant-wise count rates Data is divided into 100 sec bins |
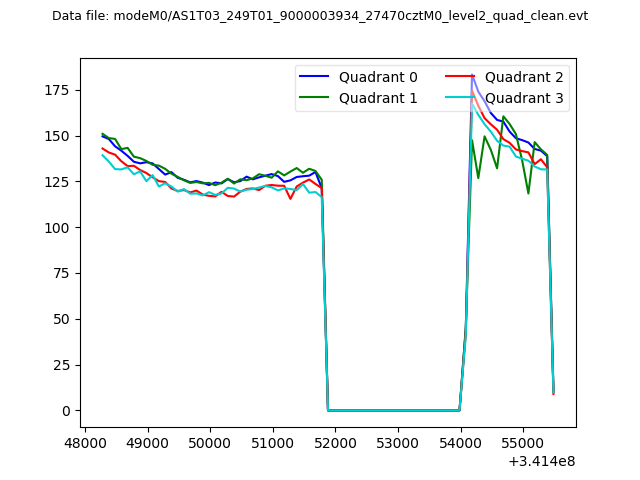 |
|
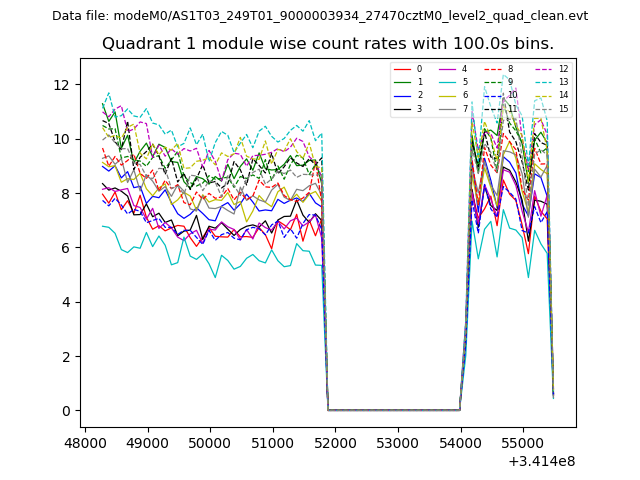
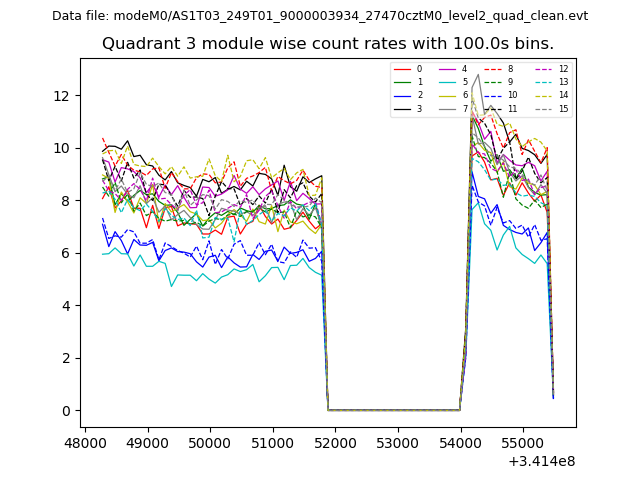
| Module-wise count rates for Quadrant A Data is divided into 100 sec bins |
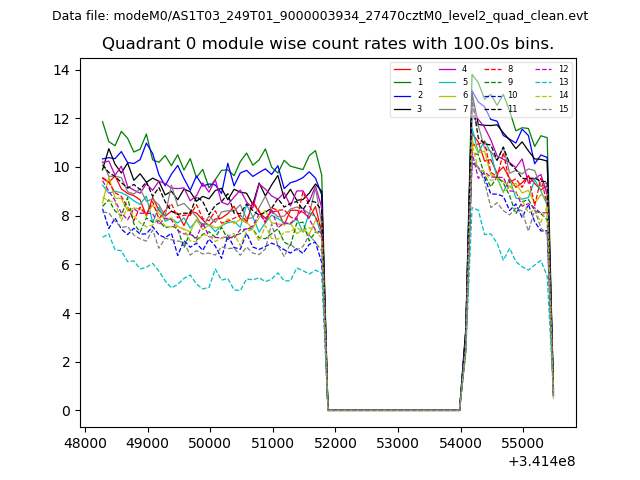 |
 |
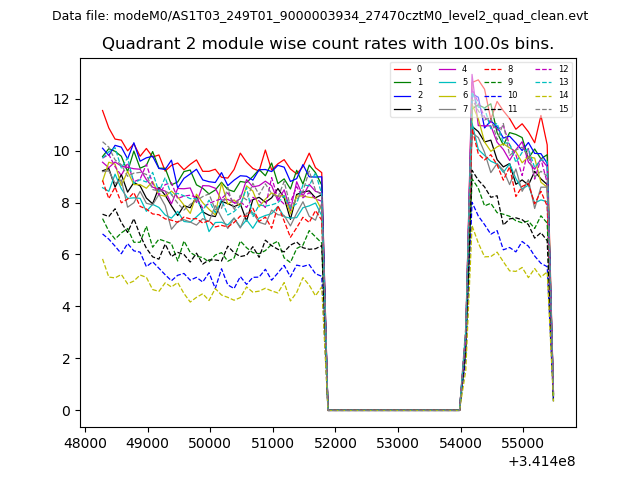
| Module-wise count rates for Quadrant B Data is divided into 100 sec bins |
 |
 |
| Module-wise count rates for Quadrant C Data is divided into 100 sec bins |
 |
 |
| Module-wise count rates for Quadrant D Data is divided into 100 sec bins |
 |
 |
| Parameter | Plot |
|---|---|
| CZT HV Monitor | 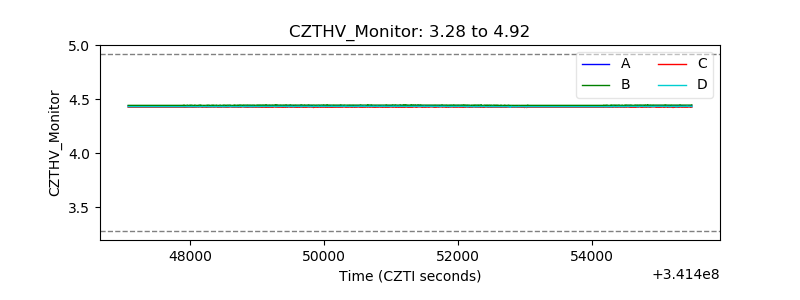 |
| D_VDD | 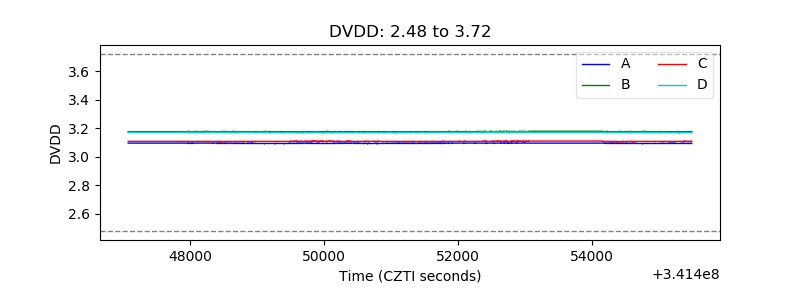 |
| Temperature 1 | 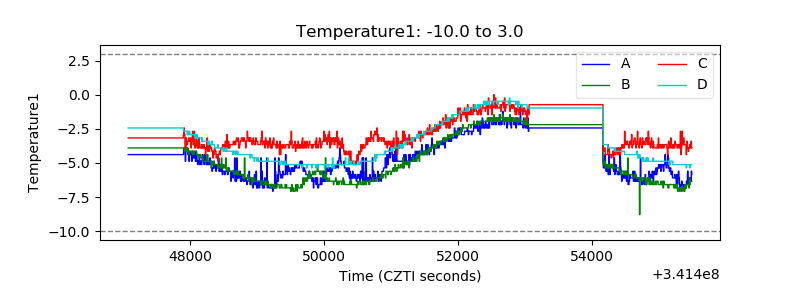 |
| Veto HV Monitor | 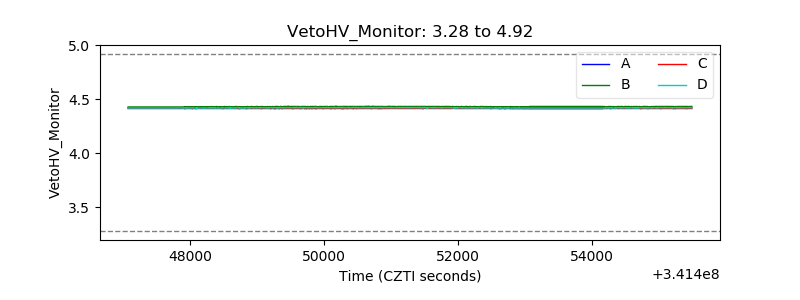 |
| Veto LLD | 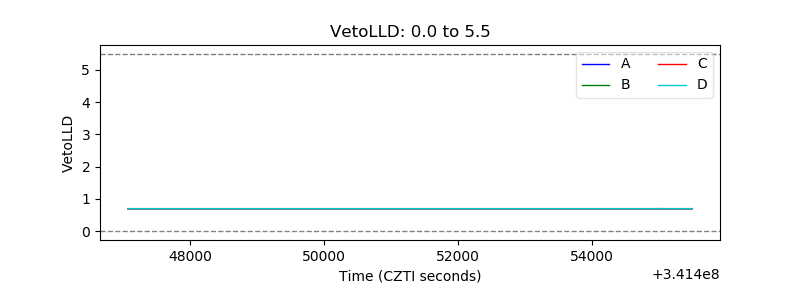 |
| Alpha Counter | 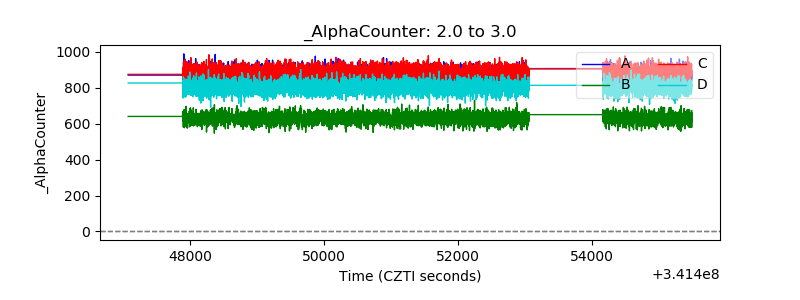 |
| _CPM_Rate | 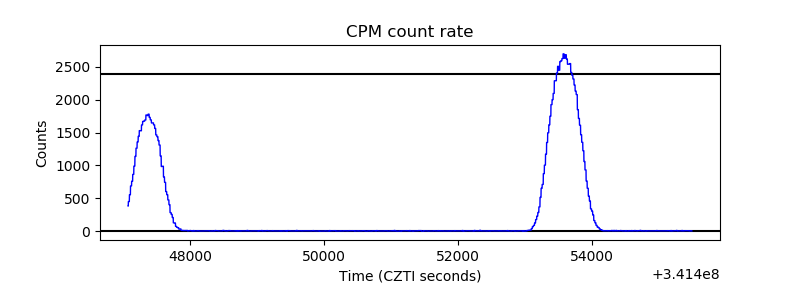 |
| CZT Counter | 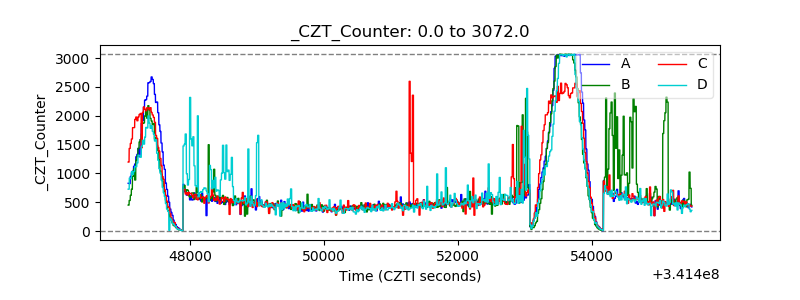 |
| +2.5 Volts monitor | 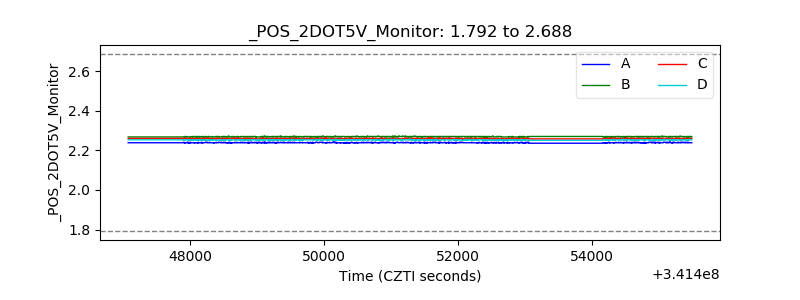 |
| +5 Volts monitor |  |
| _ROLL_ROT | 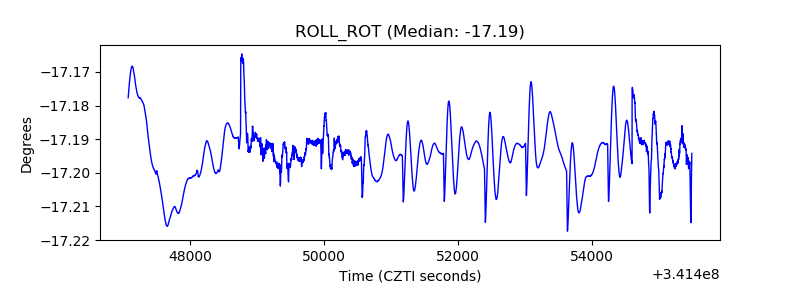 |
| _Roll_DEC |  |
| _Roll_RA | 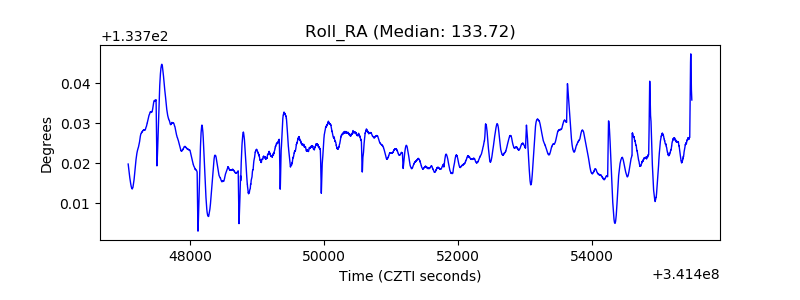 |
| Veto Counter | 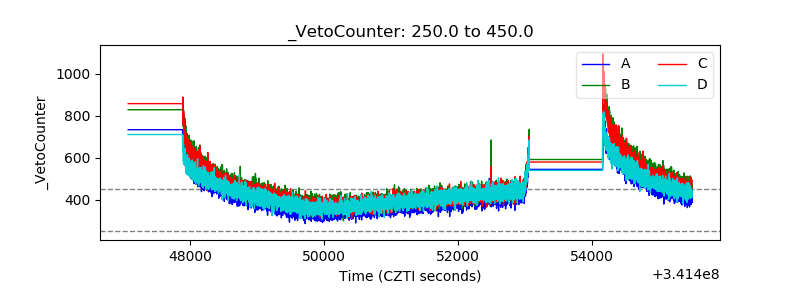 |