| Param | Original file | Final file |
|---|---|---|
| Filename | modeM0/AS1T03_249T01_9000003934_27471cztM0_level2.evt | modeM0/AS1T03_249T01_9000003934_27471cztM0_level2_quad_clean.evt |
| Size (bytes) | 484,675,200 | 111,634,560 |
| Size | 462.2 MB | 106.5 MB |
| Events in quadrant A | 3,307,466 | 751,364 |
| Events in quadrant B | 4,284,839 | 746,512 |
| Events in quadrant C | 3,405,400 | 720,534 |
| Events in quadrant D | 3,232,859 | 702,782 |
| Mode M0 | |||
|---|---|---|---|
| Quadrant | BADHDUFLAG | Total packets | Discarded packets |
| A | 0 | 13967 | 0 |
| B | 0 | 17078 | 0 |
| C | 0 | 14291 | 0 |
| D | 0 | 14106 | 0 |
| Mode M9 | |||
|---|---|---|---|
| Quadrant | BADHDUFLAG | Total packets | Discarded packets |
| A | 0 | 12 | 0 |
| B | 0 | 12 | 0 |
| C | 0 | 12 | 0 |
| D | 0 | 12 | 0 |
| Quadrant | Total seconds | Saturated seconds | Saturation percentage |
|---|---|---|---|
| A | 6592 | 14 | 0.212379% |
| B | 6592 | 374 | 5.673544% |
| C | 6592 | 68 | 1.031553% |
| D | 6593 | 24 | 0.364022% |
Noise dominated data is calculated using 1-second bins in cleaned event files. If a bin has >2000 counts, and if more than 50% of those come from <1% of pixels, then it is considered to be noise-dominated and hence unusable.
| Quadrant | # 1 sec bins | Bins with >0 counts | Bins with >2000 counts | High rate bins dominated by noise | Noise dominated (total time) | Noise dominated (detector-on time) | Marked lightcurve |
|---|---|---|---|---|---|---|---|
| A | 7792 | 6593 | 0 | 0 | 0.00% | 0.00% | 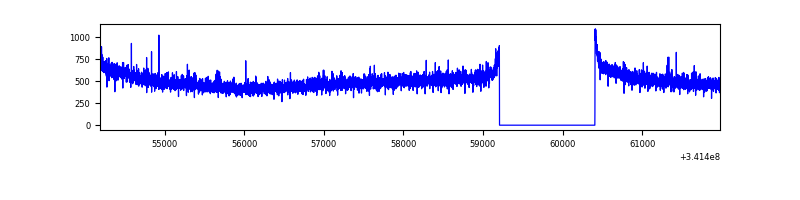 |
| B | 7792 | 6593 | 224 | 224 | 2.87% | 3.40% | 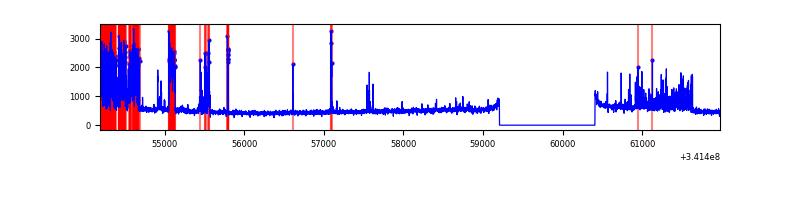 |
| C | 7792 | 6593 | 10 | 10 | 0.13% | 0.15% | 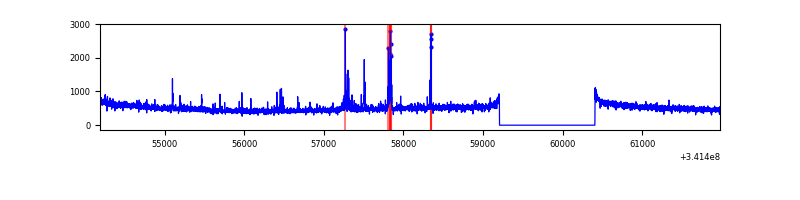 |
| D | 7793 | 6594 | 14 | 14 | 0.18% | 0.21% | 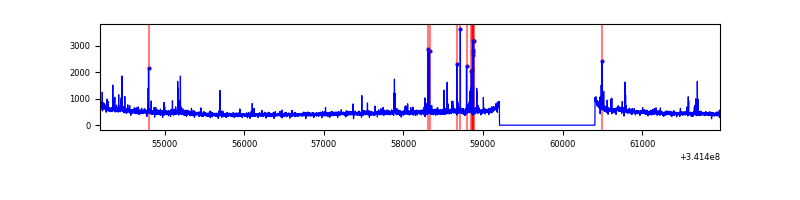 |
Top three noisy pixels from each quadrant. If the there are fewer than three noisy pixels in the level2.evt file, extra rows are filled as -1
| Pixel properties | Quadrant properties | ||||||
|---|---|---|---|---|---|---|---|
| Quadrant | DetID | PixID | Counts | Sigma | Mean | Median | Sigma |
| A | 0 | 13 | 45144 | 262.98 | 846 | 830 | 168.5 |
| A | 13 | 254 | 10674 | 58.42 | 846 | 830 | 168.5 |
| A | 3 | 137 | 7611 | 40.24 | 846 | 830 | 168.5 |
| B | 3 | 64 | 1026090 | 6482.91 | 831 | 810 | 158.2 |
| B | 12 | 111 | 19159 | 116.02 | 831 | 810 | 158.2 |
| B | 11 | 111 | 16827 | 101.28 | 831 | 810 | 158.2 |
| C | 14 | 238 | 130970 | 688.97 | 809 | 818 | 188.9 |
| C | 10 | 22 | 65361 | 341.66 | 809 | 818 | 188.9 |
| C | 2 | 16 | 33754 | 174.35 | 809 | 818 | 188.9 |
| D | 1 | 52 | 76934 | 398.87 | 807 | 786 | 190.9 |
| D | 2 | 250 | 58285 | 301.18 | 807 | 786 | 190.9 |
| D | 2 | 234 | 26686 | 135.67 | 807 | 786 | 190.9 |
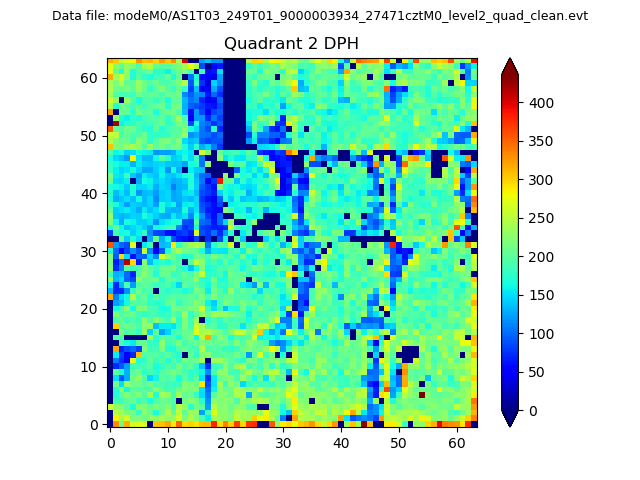
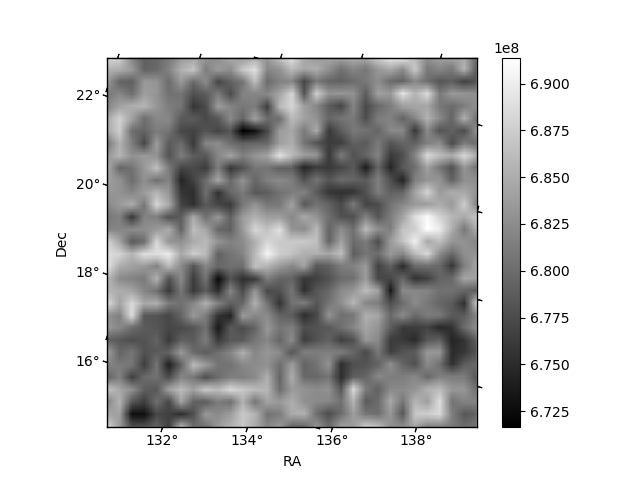
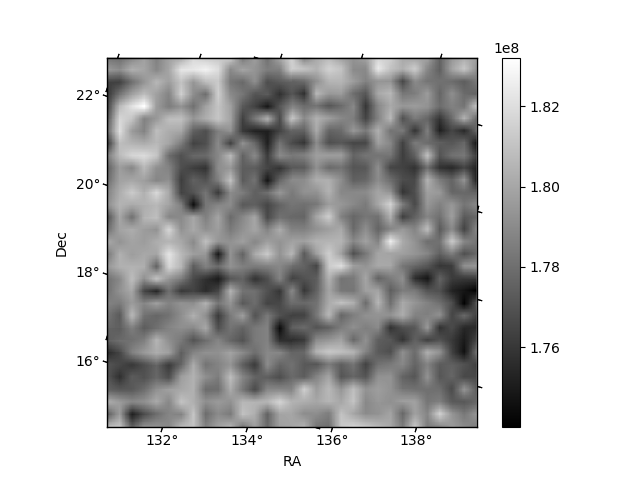
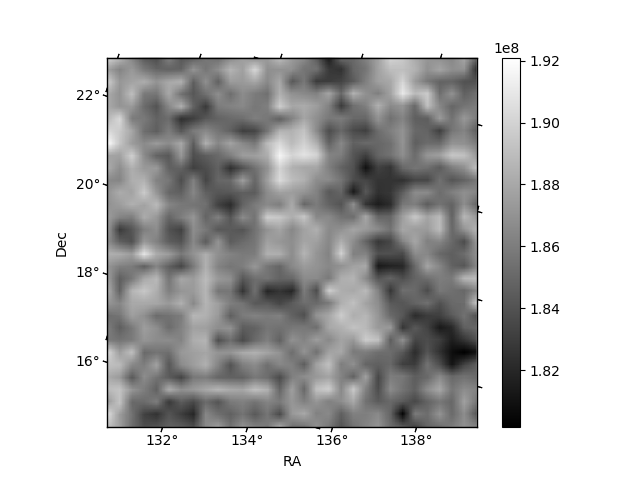
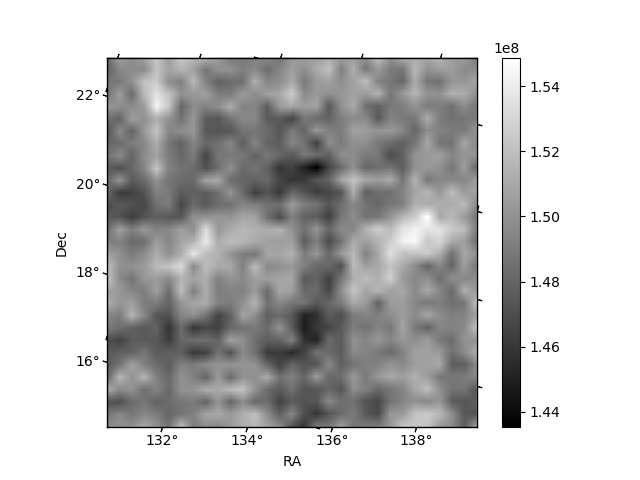
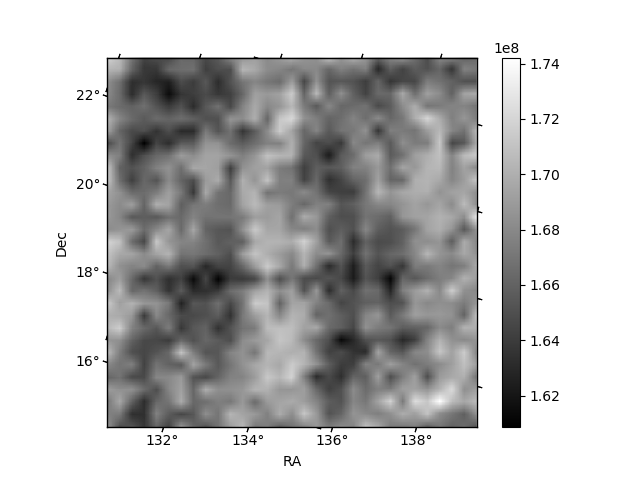
Histogram calculated using DETX and DETY for each event in the final _common_clean file
| Quadrant A | 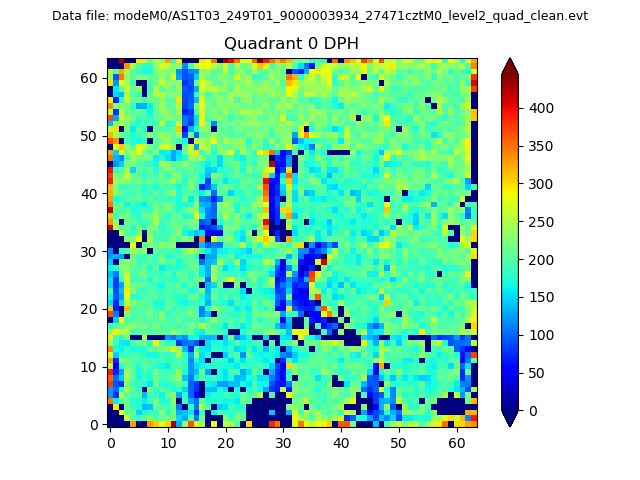 |
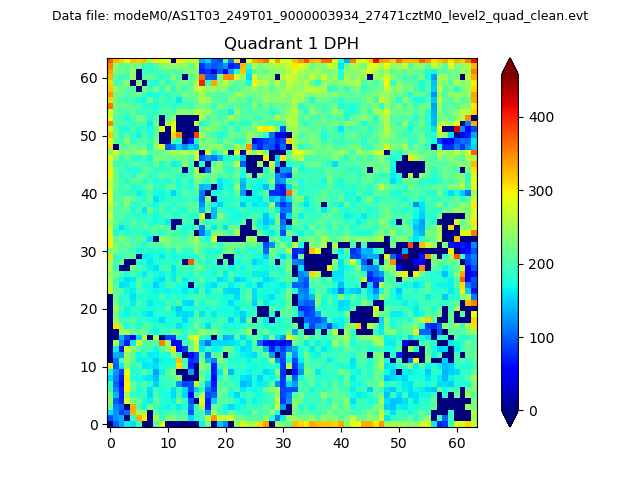 |
Quadrant B |
|---|---|---|---|
| Quadrant D | 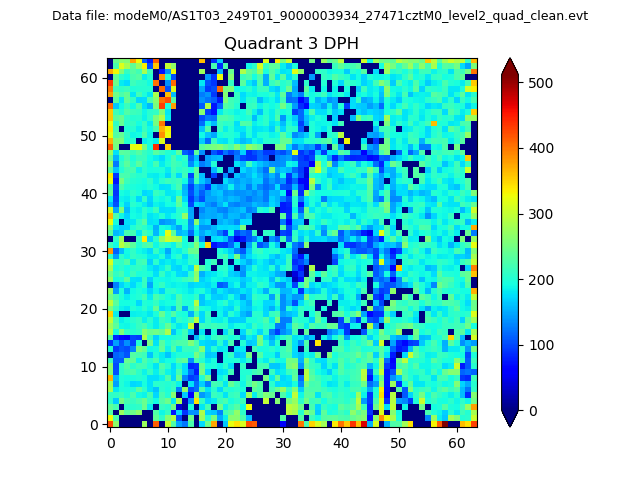 |
 |
Quadrant C |
| Plot type | Count rate plots | Images |
|---|---|---|
| Comparison with Poisson distribution Blue bars denote a histogram of data divided into 1 sec bins. Red curve is a Poisson curve with rate = median count rate of data. |
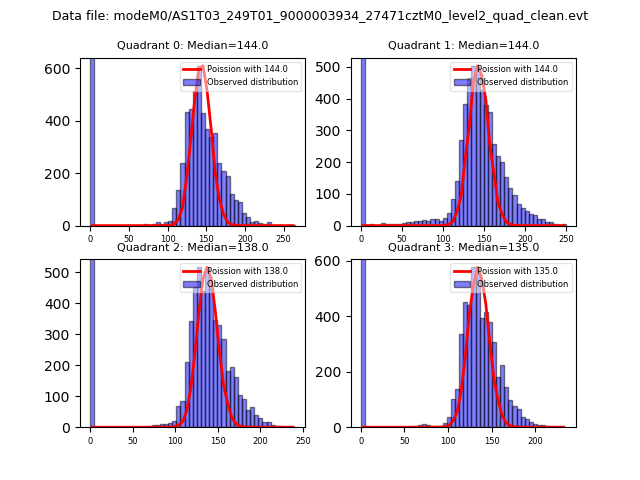 |
 |
| Quadrant-wise count rates Data is divided into 100 sec bins |
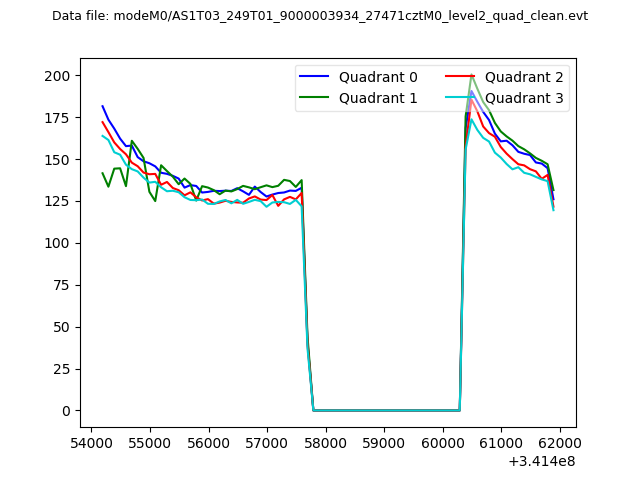 |
|
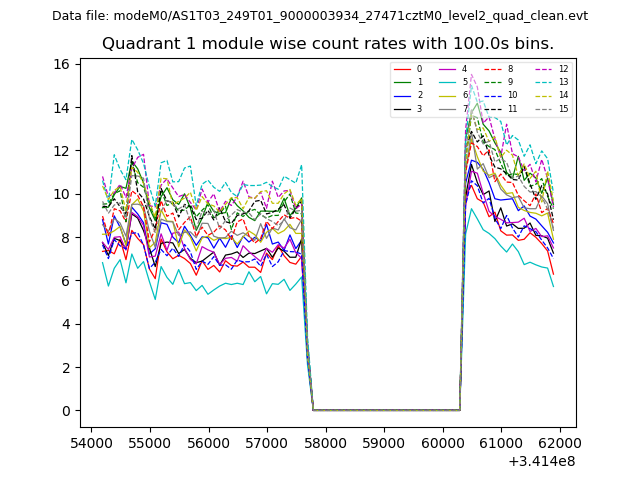
| Module-wise count rates for Quadrant A Data is divided into 100 sec bins |
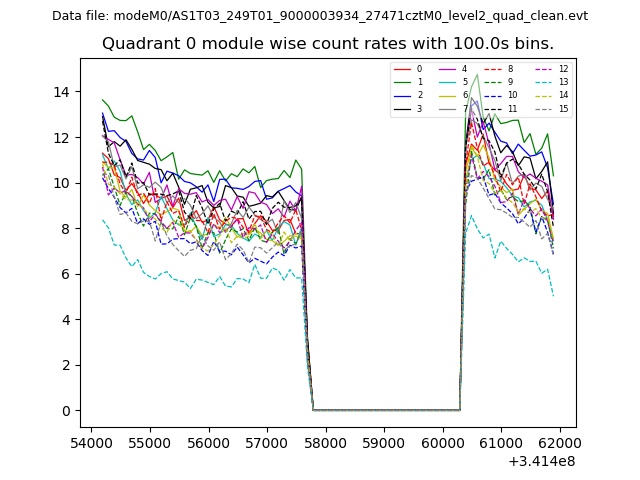 |
 |
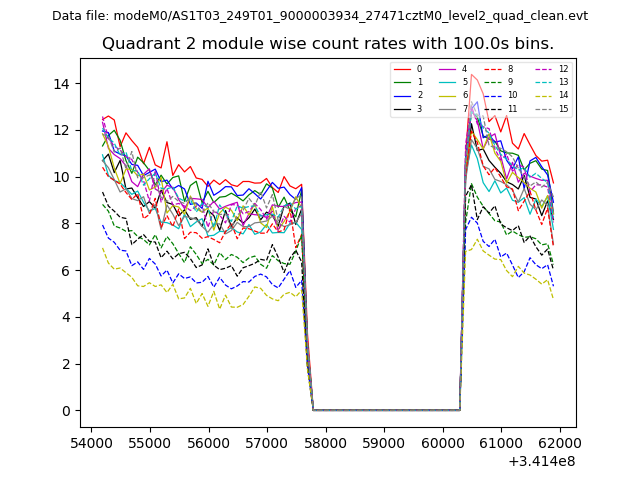
| Module-wise count rates for Quadrant B Data is divided into 100 sec bins |
 |
 |
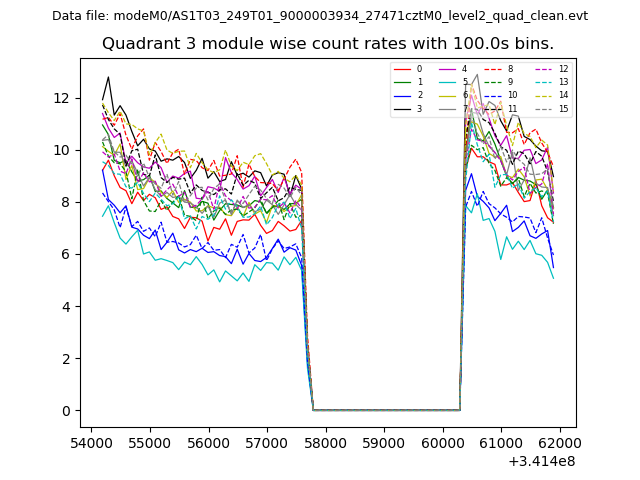
| Module-wise count rates for Quadrant C Data is divided into 100 sec bins |
 |
 |
| Module-wise count rates for Quadrant D Data is divided into 100 sec bins |
 |
 |
| Parameter | Plot |
|---|---|
| CZT HV Monitor | 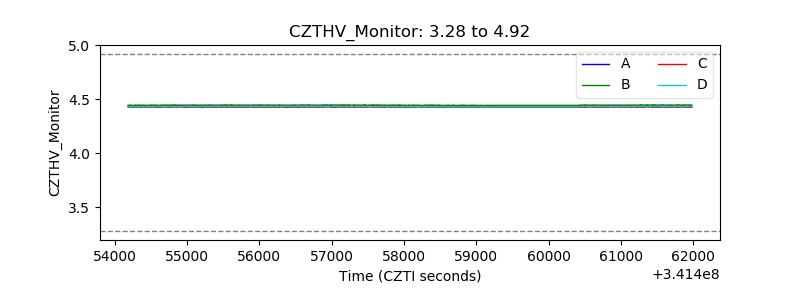 |
| D_VDD | 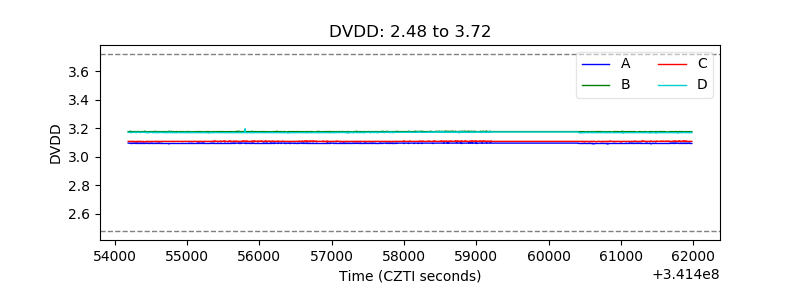 |
| Temperature 1 | 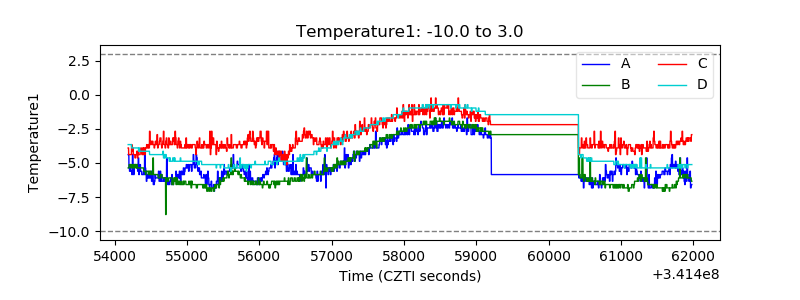 |
| Veto HV Monitor | 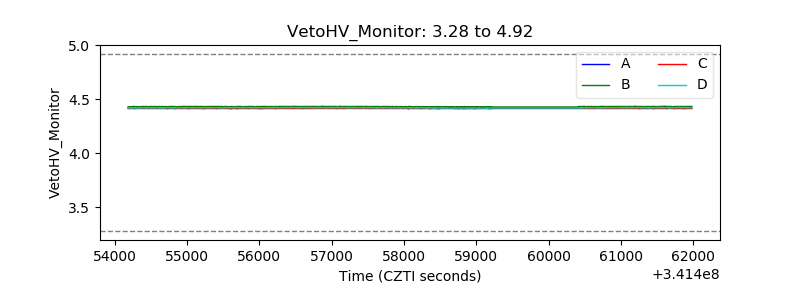 |
| Veto LLD | 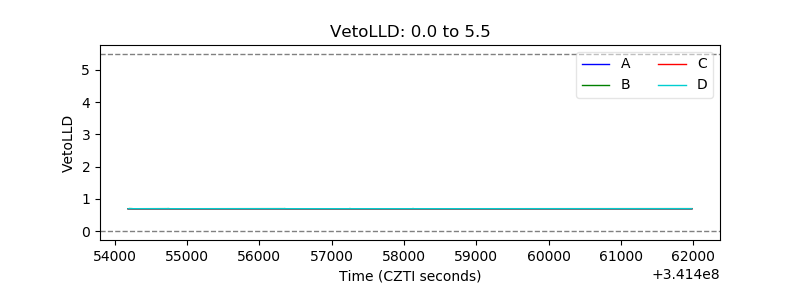 |
| Alpha Counter | 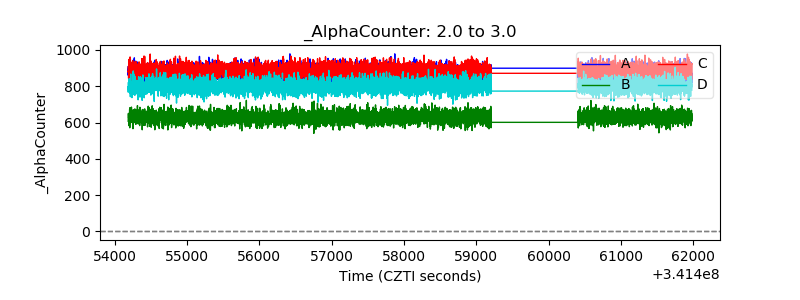 |
| _CPM_Rate | 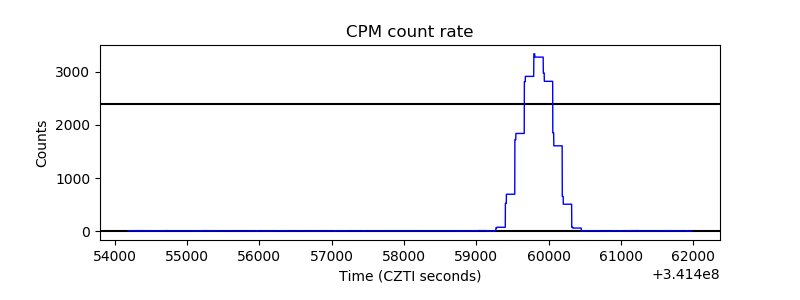 |
| CZT Counter | 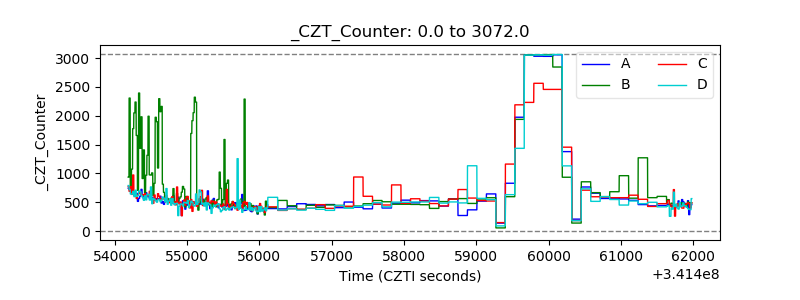 |
| +2.5 Volts monitor |  |
| +5 Volts monitor |  |
| _ROLL_ROT | 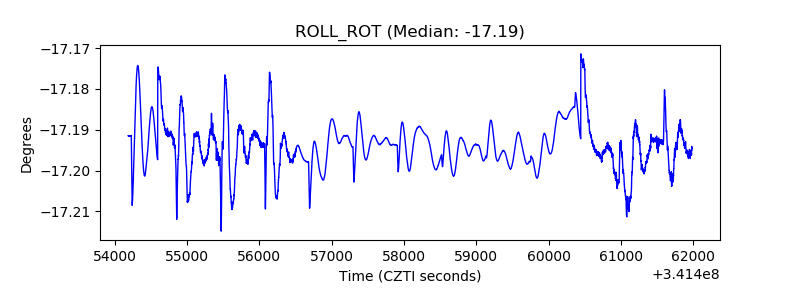 |
| _Roll_DEC | 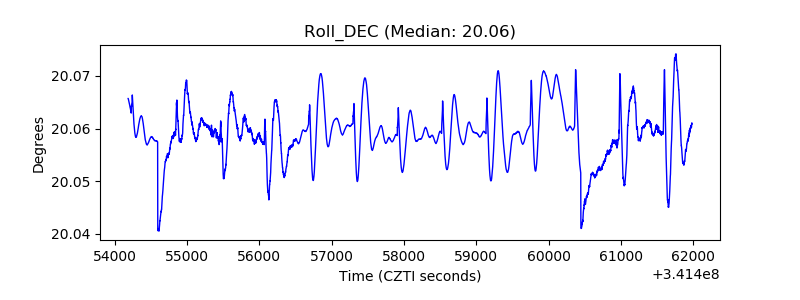 |
| _Roll_RA | 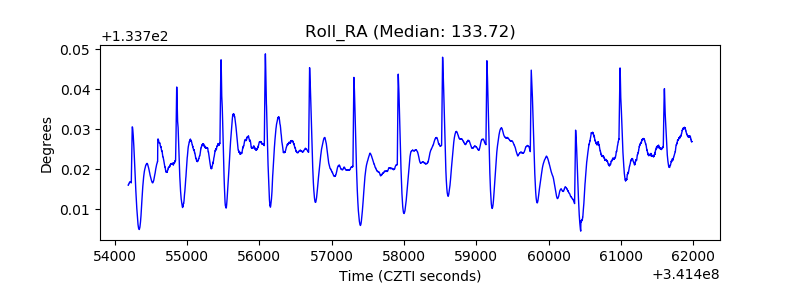 |
| Veto Counter |  |