| Param | Original file | Final file |
|---|---|---|
| Filename | modeM0/AS1T03_249T01_9000003934_27473cztM0_level2.evt | modeM0/AS1T03_249T01_9000003934_27473cztM0_level2_quad_clean.evt |
| Size (bytes) | 427,867,200 | 89,674,560 |
| Size | 408.0 MB | 85.5 MB |
| Events in quadrant A | 3,059,769 | 588,374 |
| Events in quadrant B | 3,407,572 | 597,665 |
| Events in quadrant C | 3,073,207 | 561,688 |
| Events in quadrant D | 3,011,166 | 550,256 |
| Mode M0 | |||
|---|---|---|---|
| Quadrant | BADHDUFLAG | Total packets | Discarded packets |
| A | 0 | 12505 | 0 |
| B | 0 | 13748 | 0 |
| C | 0 | 12596 | 0 |
| D | 0 | 12647 | 0 |
| Mode M9 | |||
|---|---|---|---|
| Quadrant | BADHDUFLAG | Total packets | Discarded packets |
| A | 0 | 13 | 0 |
| B | 0 | 13 | 0 |
| C | 0 | 13 | 0 |
| D | 0 | 13 | 0 |
| Quadrant | Total seconds | Saturated seconds | Saturation percentage |
|---|---|---|---|
| A | 5977 | 41 | 0.685963% |
| B | 5978 | 66 | 1.104048% |
| C | 5978 | 78 | 1.304784% |
| D | 5978 | 29 | 0.485112% |
Noise dominated data is calculated using 1-second bins in cleaned event files. If a bin has >2000 counts, and if more than 50% of those come from <1% of pixels, then it is considered to be noise-dominated and hence unusable.
| Quadrant | # 1 sec bins | Bins with >0 counts | Bins with >2000 counts | High rate bins dominated by noise | Noise dominated (total time) | Noise dominated (detector-on time) | Marked lightcurve |
|---|---|---|---|---|---|---|---|
| A | 7292 | 5978 | 0 | 0 | 0.00% | 0.00% | 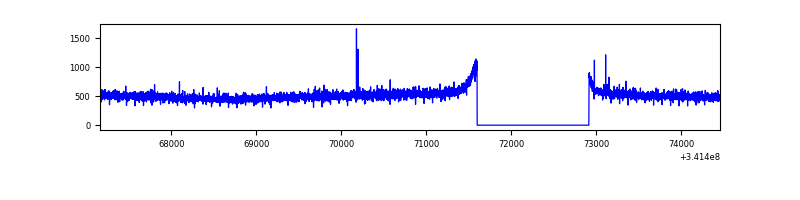 |
| B | 7293 | 5979 | 3 | 3 | 0.04% | 0.05% | 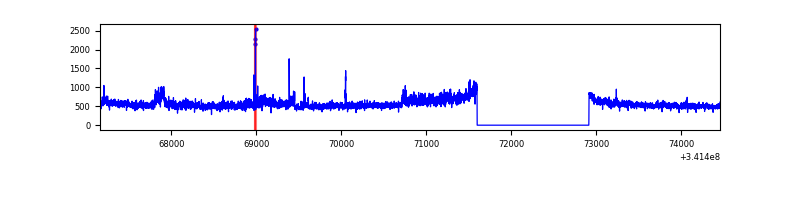 |
| C | 7293 | 5978 | 0 | 0 | 0.00% | 0.00% | 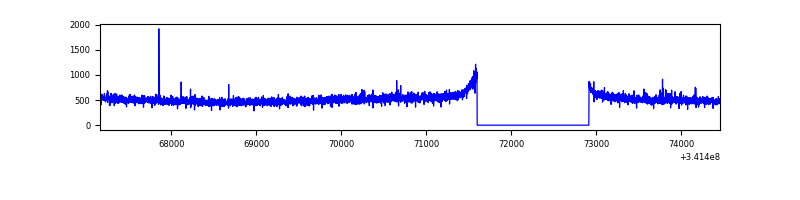 |
| D | 7293 | 5979 | 6 | 6 | 0.08% | 0.10% | 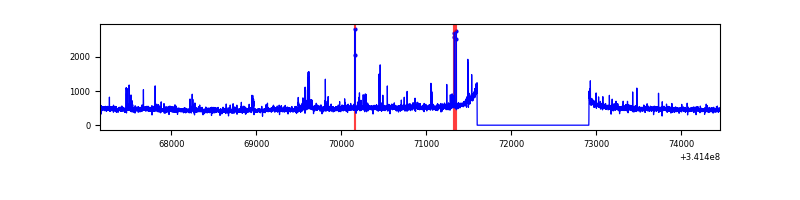 |
Top three noisy pixels from each quadrant. If the there are fewer than three noisy pixels in the level2.evt file, extra rows are filled as -1
| Pixel properties | Quadrant properties | ||||||
|---|---|---|---|---|---|---|---|
| Quadrant | DetID | PixID | Counts | Sigma | Mean | Median | Sigma |
| A | 13 | 254 | 10128 | 59.04 | 792 | 777 | 158.4 |
| A | 6 | 16 | 7242 | 40.82 | 792 | 777 | 158.4 |
| A | 3 | 137 | 6981 | 39.17 | 792 | 777 | 158.4 |
| B | 3 | 64 | 304365 | 2070.62 | 784 | 768 | 146.6 |
| B | 12 | 111 | 17715 | 115.58 | 784 | 768 | 146.6 |
| B | 11 | 111 | 15712 | 101.92 | 784 | 768 | 146.6 |
| C | 14 | 238 | 124231 | 704.95 | 753 | 758 | 175.2 |
| C | 2 | 16 | 10385 | 54.96 | 753 | 758 | 175.2 |
| C | 13 | 61 | 5249 | 25.64 | 753 | 758 | 175.2 |
| D | 1 | 52 | 101082 | 570.78 | 757 | 738 | 175.8 |
| D | 2 | 234 | 21201 | 116.4 | 757 | 738 | 175.8 |
| D | 15 | 145 | 20433 | 112.03 | 757 | 738 | 175.8 |
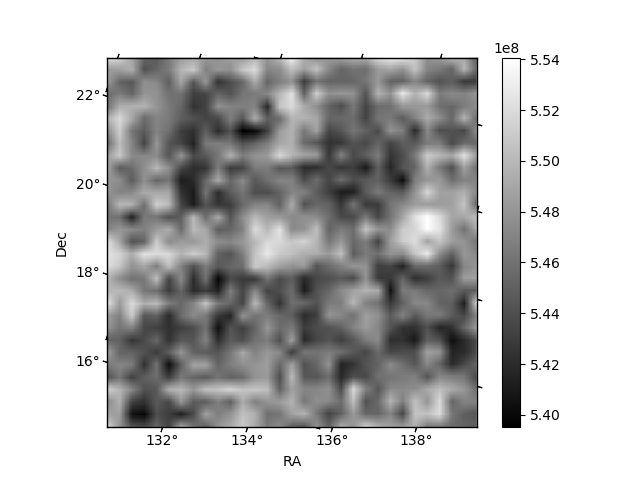
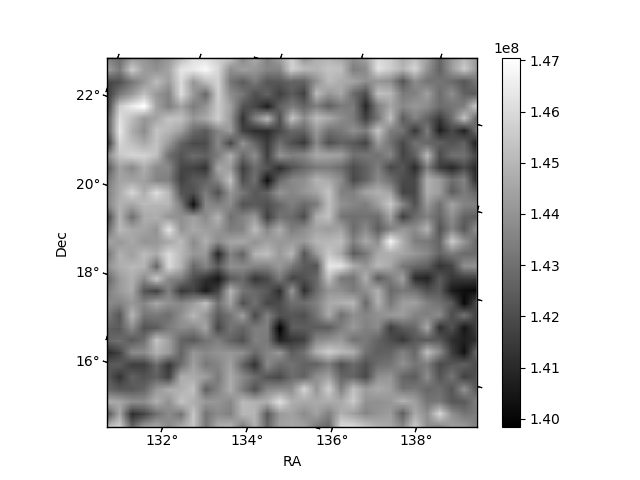
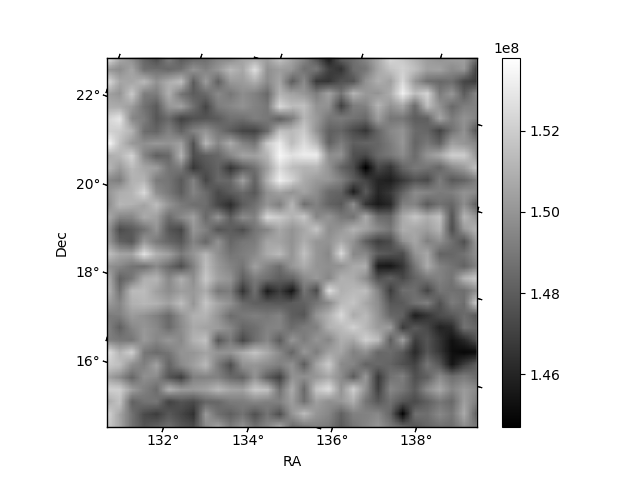
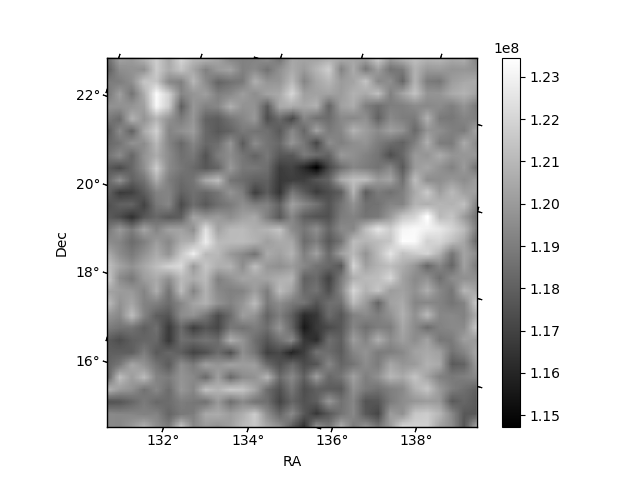
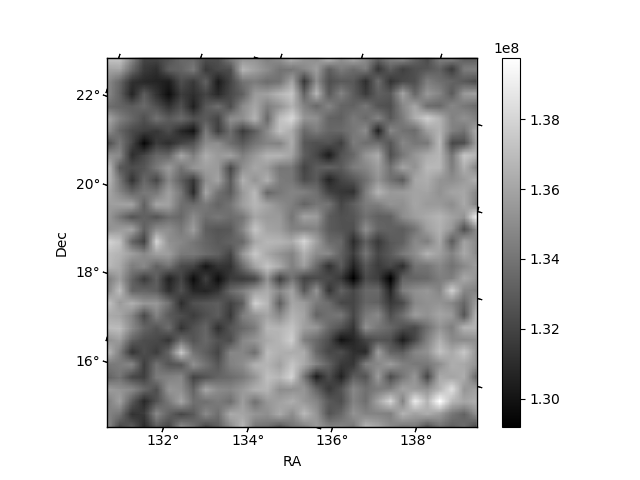
Histogram calculated using DETX and DETY for each event in the final _common_clean file
| Quadrant A | 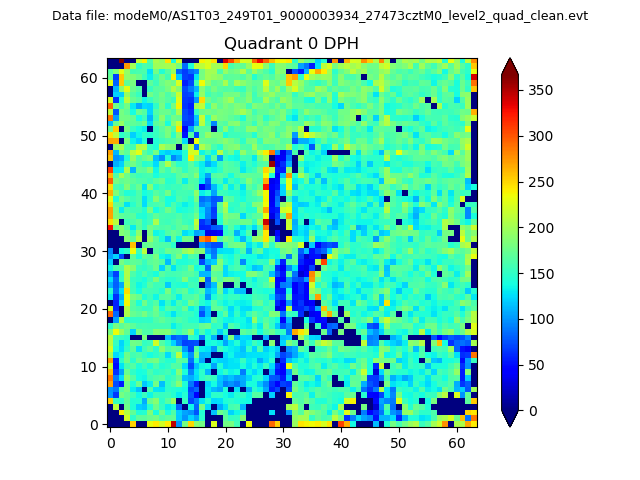 |
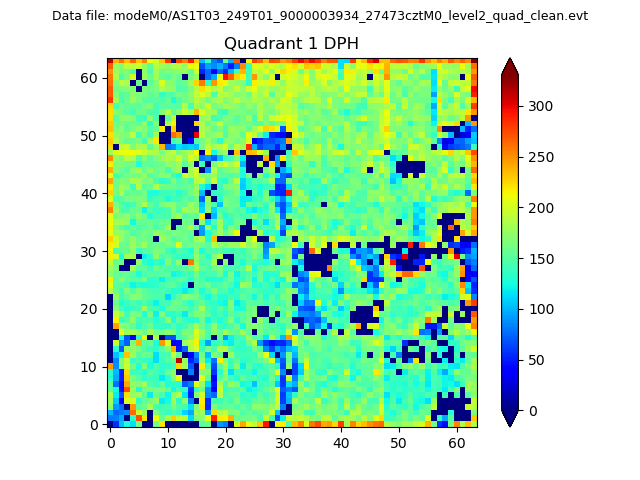 |
Quadrant B |
|---|---|---|---|
| Quadrant D | 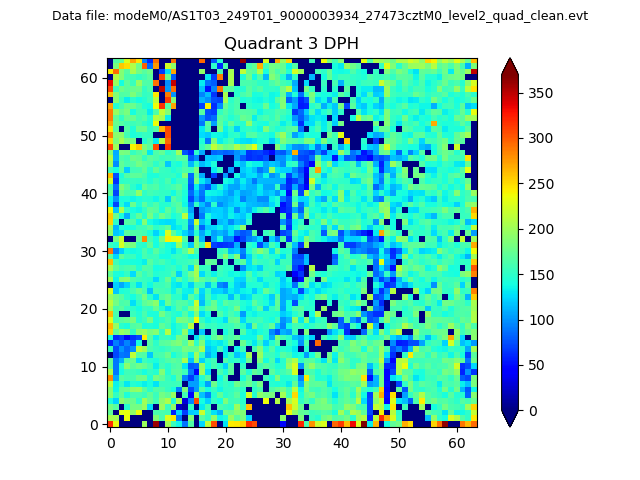 |
 |
Quadrant C |
| Plot type | Count rate plots | Images |
|---|---|---|
| Comparison with Poisson distribution Blue bars denote a histogram of data divided into 1 sec bins. Red curve is a Poisson curve with rate = median count rate of data. |
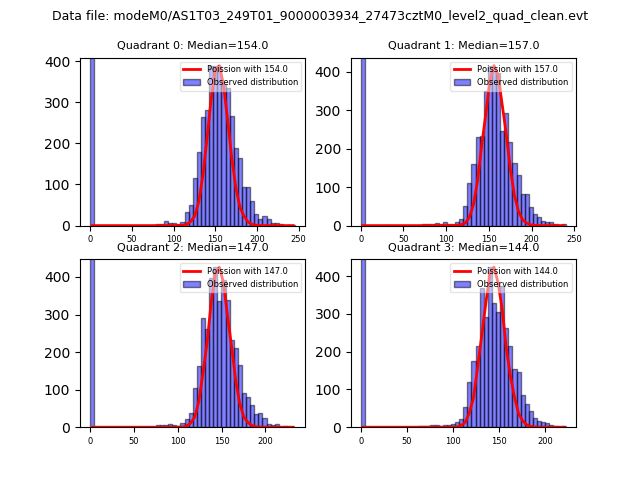 |
 |
| Quadrant-wise count rates Data is divided into 100 sec bins |
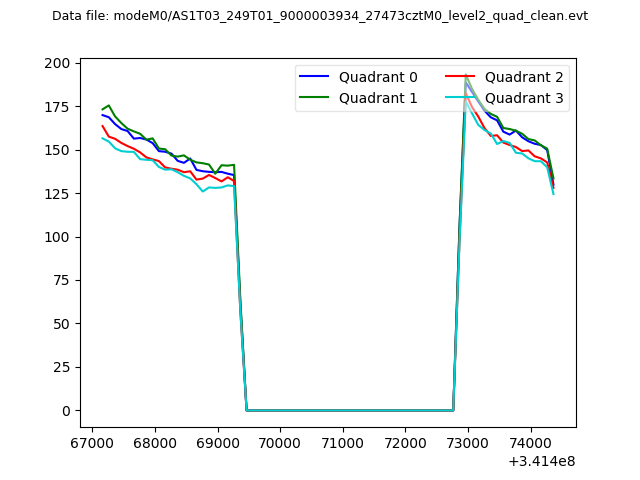 |
|
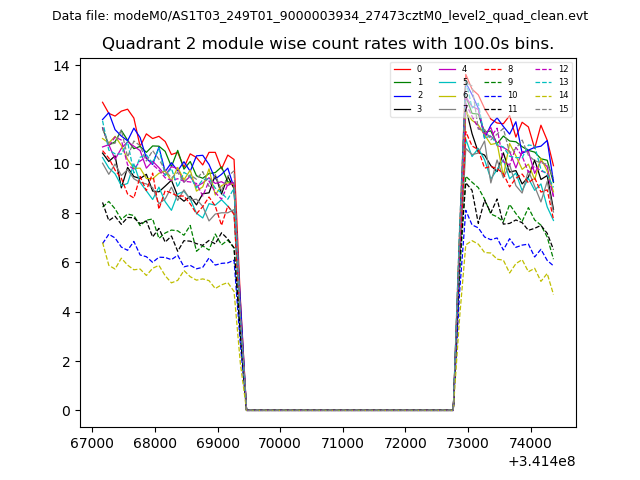
| Module-wise count rates for Quadrant A Data is divided into 100 sec bins |
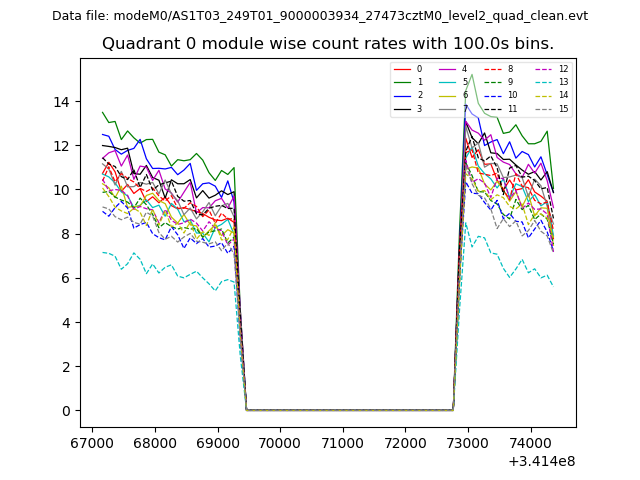 |
 |
| Module-wise count rates for Quadrant B Data is divided into 100 sec bins |
 |
 |
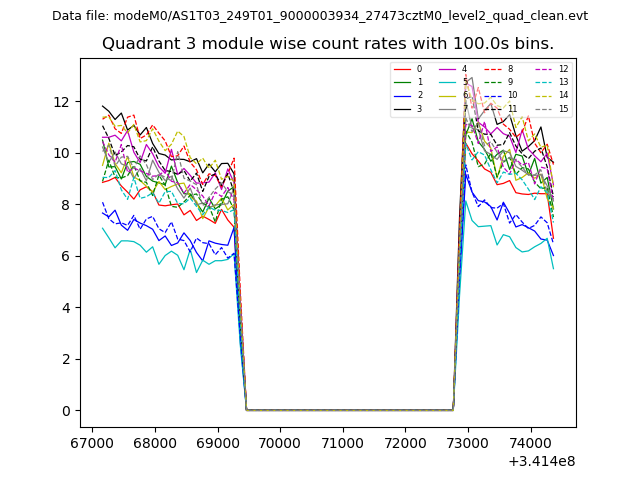
| Module-wise count rates for Quadrant C Data is divided into 100 sec bins |
 |
 |
| Module-wise count rates for Quadrant D Data is divided into 100 sec bins |
 |
 |
| Parameter | Plot |
|---|---|
| CZT HV Monitor |  |
| D_VDD | 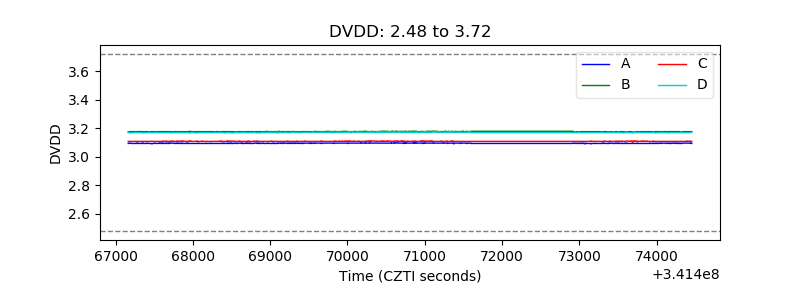 |
| Temperature 1 | 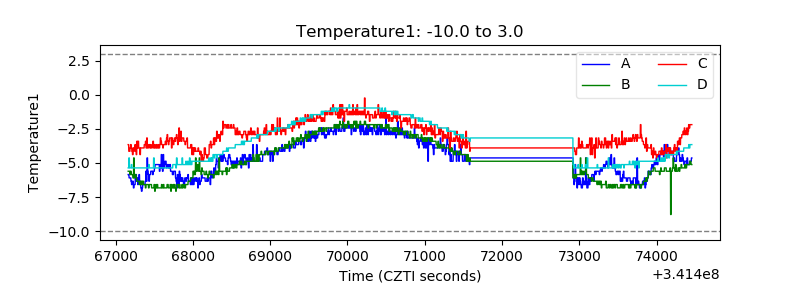 |
| Veto HV Monitor | 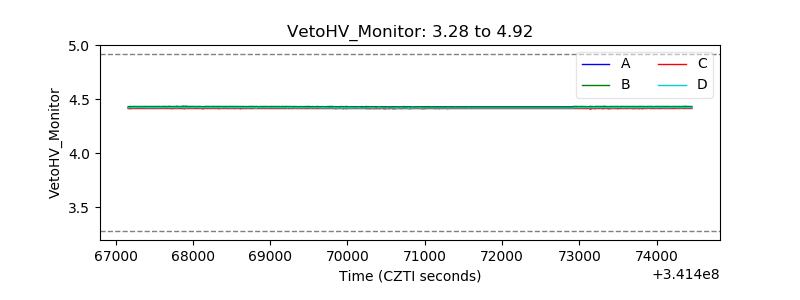 |
| Veto LLD | 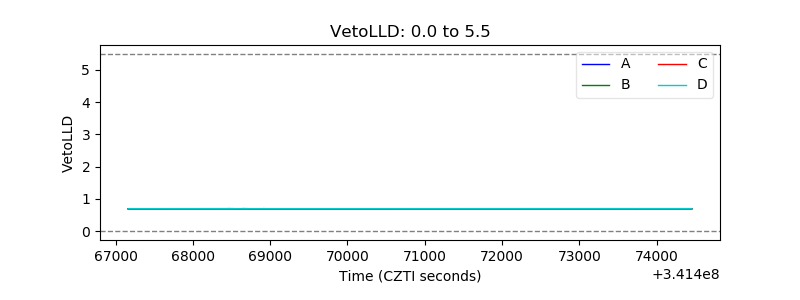 |
| Alpha Counter |  |
| _CPM_Rate | 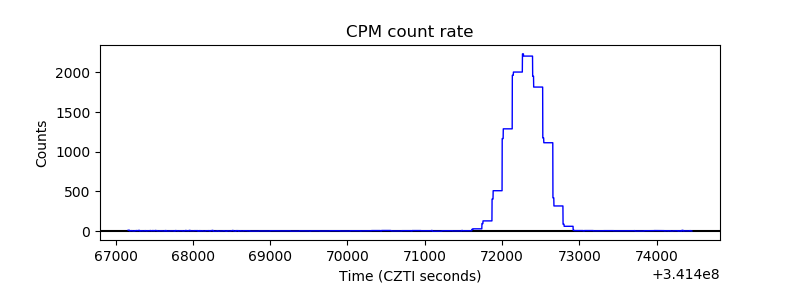 |
| CZT Counter | 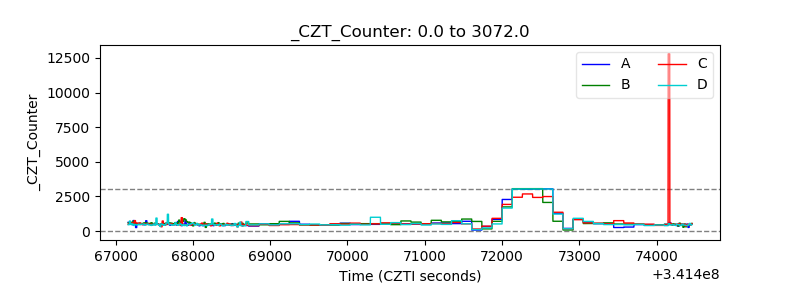 |
| +2.5 Volts monitor | 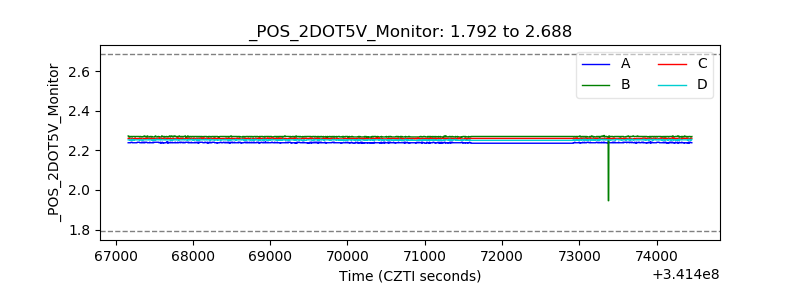 |
| +5 Volts monitor |  |
| _ROLL_ROT | 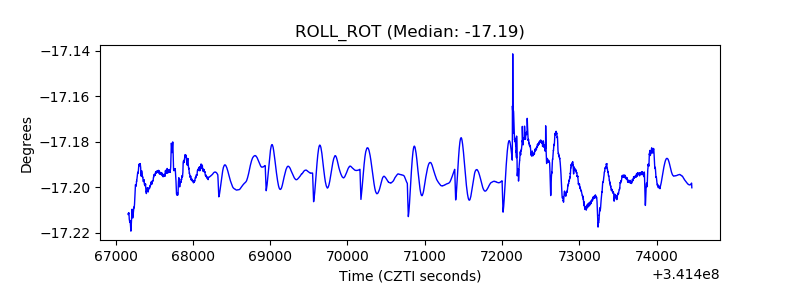 |
| _Roll_DEC |  |
| _Roll_RA | 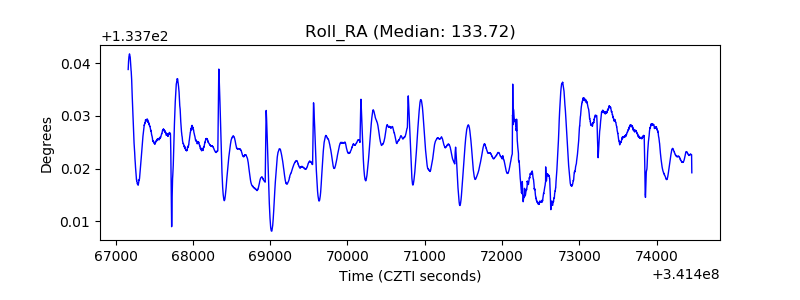 |
| Veto Counter |  |