| Param | Original file | Final file |
|---|---|---|
| Filename | modeM0/AS1T03_249T01_9000003934_27474cztM0_level2.evt | modeM0/AS1T03_249T01_9000003934_27474cztM0_level2_quad_clean.evt |
| Size (bytes) | 463,392,000 | 99,466,560 |
| Size | 441.9 MB | 94.9 MB |
| Events in quadrant A | 3,334,027 | 654,917 |
| Events in quadrant B | 3,432,088 | 663,078 |
| Events in quadrant C | 3,399,953 | 625,713 |
| Events in quadrant D | 3,428,214 | 617,200 |
| Mode M0 | |||
|---|---|---|---|
| Quadrant | BADHDUFLAG | Total packets | Discarded packets |
| A | 0 | 13580 | 0 |
| B | 0 | 13926 | 0 |
| C | 0 | 13860 | 0 |
| D | 0 | 14221 | 0 |
| Mode M9 | |||
|---|---|---|---|
| Quadrant | BADHDUFLAG | Total packets | Discarded packets |
| A | 0 | 12 | 0 |
| B | 0 | 12 | 0 |
| C | 0 | 12 | 0 |
| D | 0 | 12 | 0 |
| Quadrant | Total seconds | Saturated seconds | Saturation percentage |
|---|---|---|---|
| A | 6469 | 58 | 0.896584% |
| B | 6470 | 99 | 1.530139% |
| C | 6470 | 96 | 1.483771% |
| D | 6470 | 49 | 0.757342% |
Noise dominated data is calculated using 1-second bins in cleaned event files. If a bin has >2000 counts, and if more than 50% of those come from <1% of pixels, then it is considered to be noise-dominated and hence unusable.
| Quadrant | # 1 sec bins | Bins with >0 counts | Bins with >2000 counts | High rate bins dominated by noise | Noise dominated (total time) | Noise dominated (detector-on time) | Marked lightcurve |
|---|---|---|---|---|---|---|---|
| A | 7744 | 6470 | 0 | 0 | 0.00% | 0.00% | 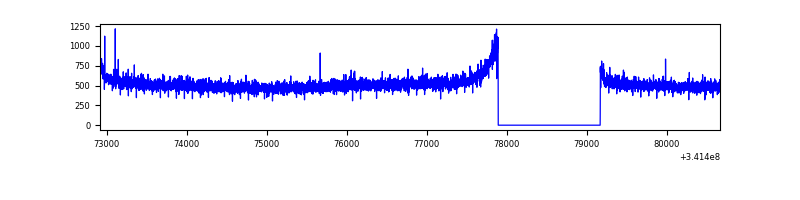 |
| B | 7745 | 6470 | 13 | 13 | 0.17% | 0.20% | 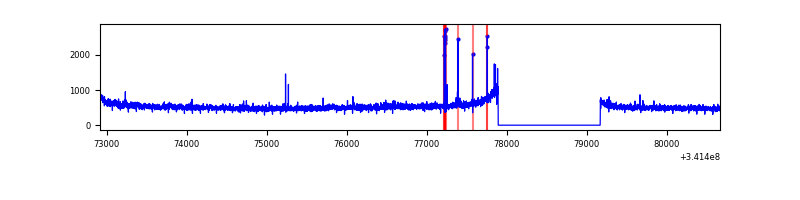 |
| C | 7745 | 6471 | 1 | 1 | 0.01% | 0.02% | 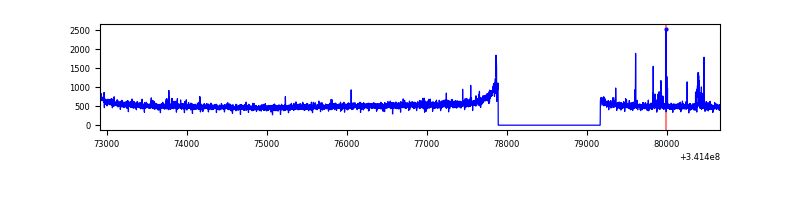 |
| D | 7745 | 6470 | 12 | 12 | 0.15% | 0.19% | 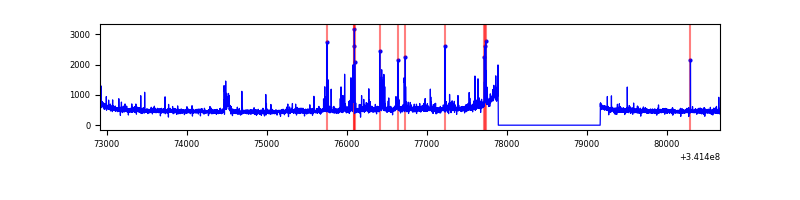 |
Top three noisy pixels from each quadrant. If the there are fewer than three noisy pixels in the level2.evt file, extra rows are filled as -1
| Pixel properties | Quadrant properties | ||||||
|---|---|---|---|---|---|---|---|
| Quadrant | DetID | PixID | Counts | Sigma | Mean | Median | Sigma |
| A | 13 | 254 | 11077 | 59.29 | 863 | 848 | 172.5 |
| A | 0 | 226 | 7624 | 39.28 | 863 | 848 | 172.5 |
| A | 3 | 137 | 7496 | 38.53 | 863 | 848 | 172.5 |
| B | 3 | 64 | 70984 | 437.94 | 852 | 834 | 160.2 |
| B | 12 | 111 | 19334 | 115.49 | 852 | 834 | 160.2 |
| B | 11 | 111 | 17170 | 101.98 | 852 | 834 | 160.2 |
| C | 14 | 238 | 132846 | 693.72 | 818 | 826 | 190.3 |
| C | 10 | 22 | 40593 | 208.96 | 818 | 826 | 190.3 |
| C | 2 | 16 | 30982 | 158.46 | 818 | 826 | 190.3 |
| D | 1 | 52 | 205909 | 1052.47 | 829 | 809 | 194.9 |
| D | 2 | 250 | 64164 | 325.11 | 829 | 809 | 194.9 |
| D | 2 | 234 | 24141 | 119.73 | 829 | 809 | 194.9 |
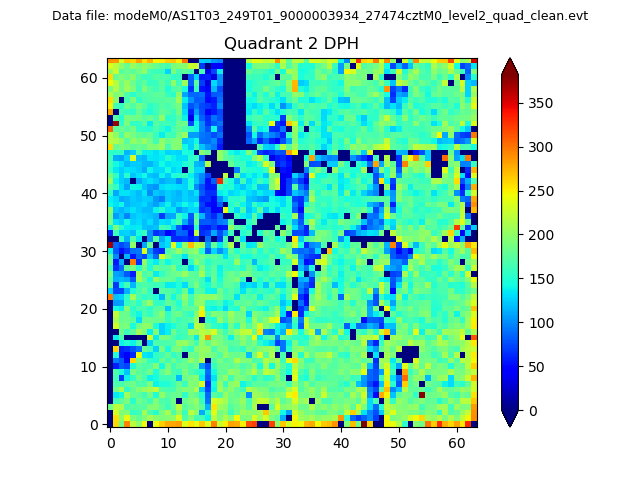
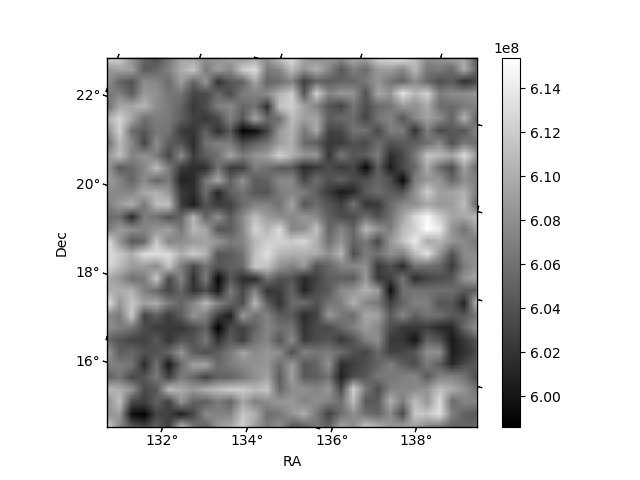
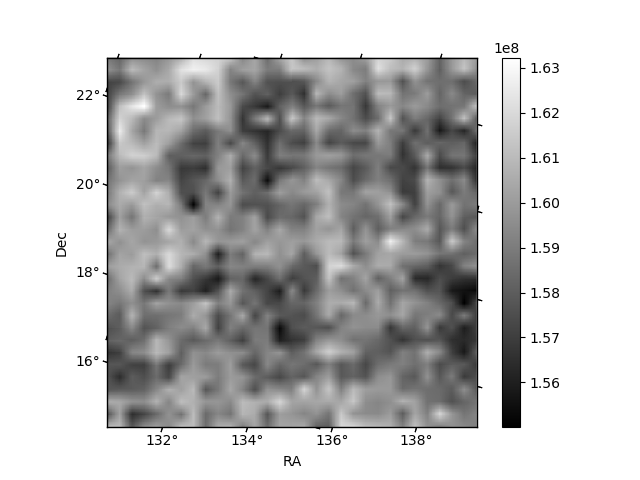
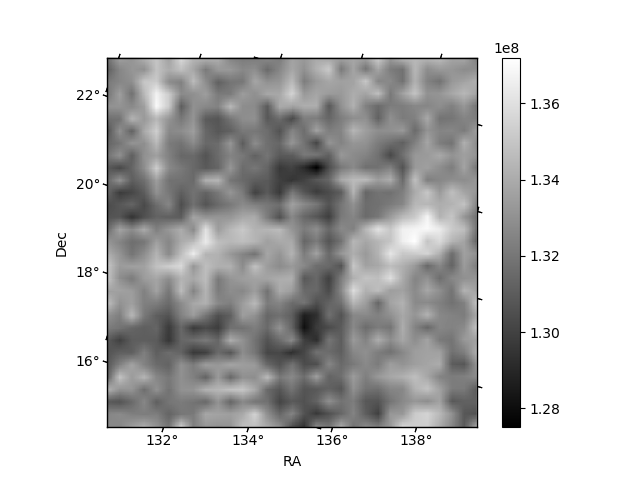
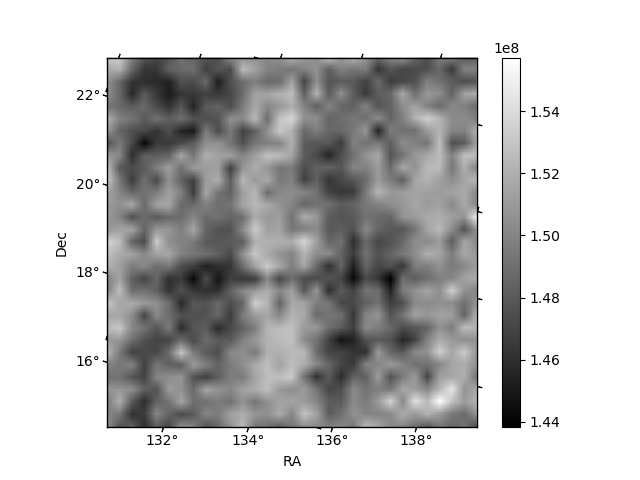
Histogram calculated using DETX and DETY for each event in the final _common_clean file
| Quadrant A | 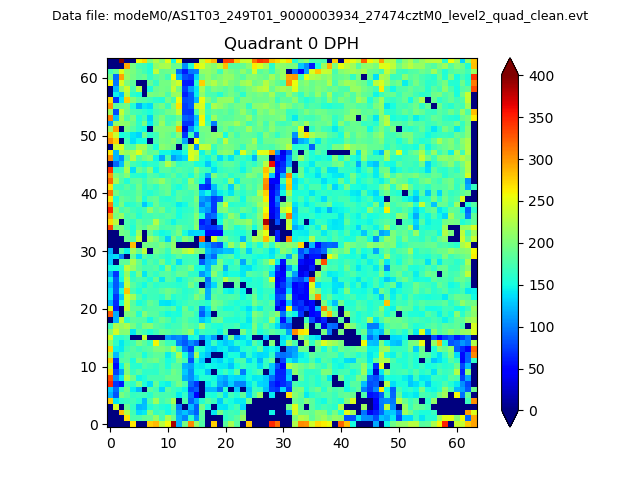 |
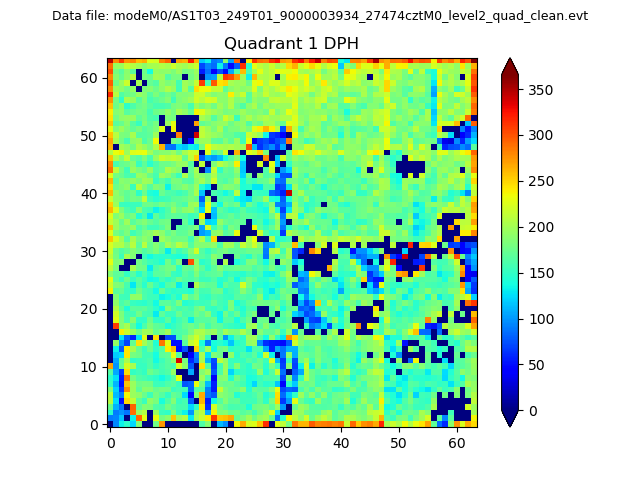 |
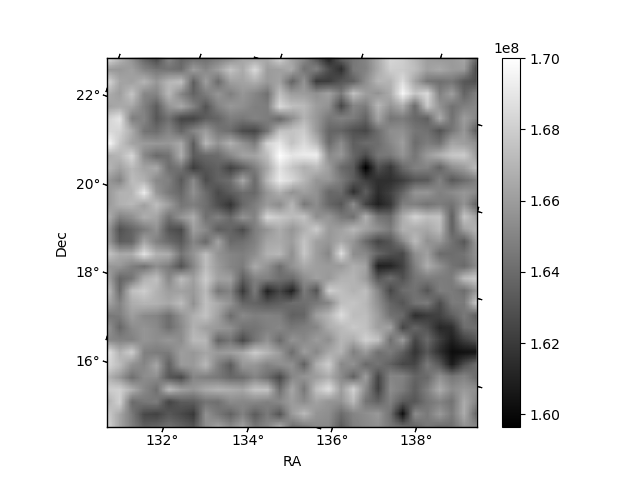
Quadrant B |
|---|---|---|---|
| Quadrant D | 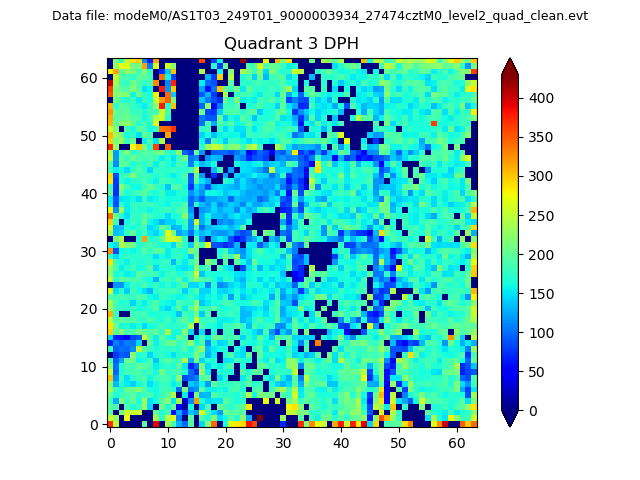 |
 |
Quadrant C |
| Plot type | Count rate plots | Images |
|---|---|---|
| Comparison with Poisson distribution Blue bars denote a histogram of data divided into 1 sec bins. Red curve is a Poisson curve with rate = median count rate of data. |
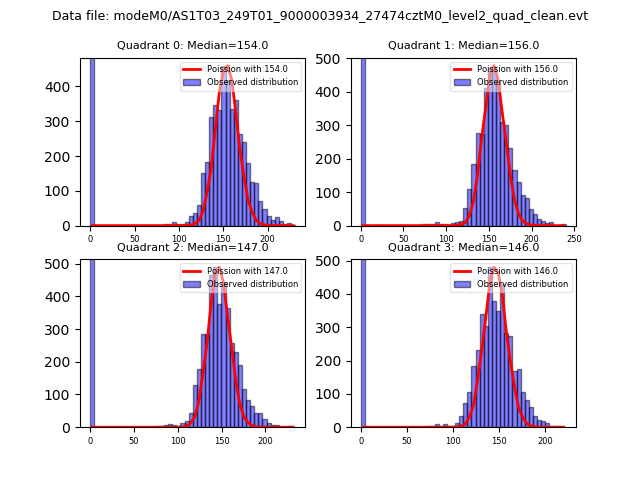 |
 |
| Quadrant-wise count rates Data is divided into 100 sec bins |
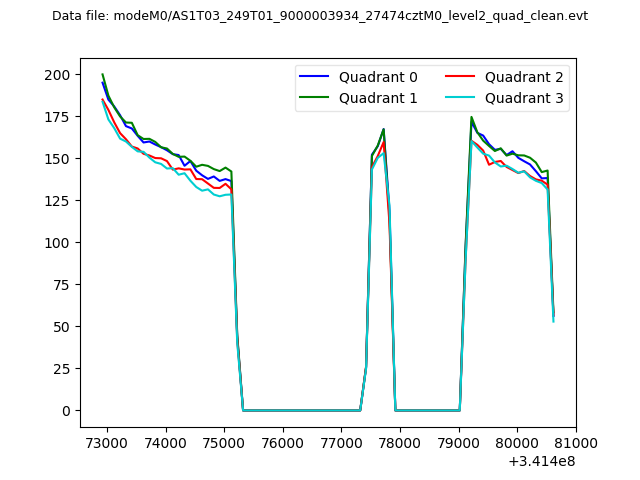 |
|
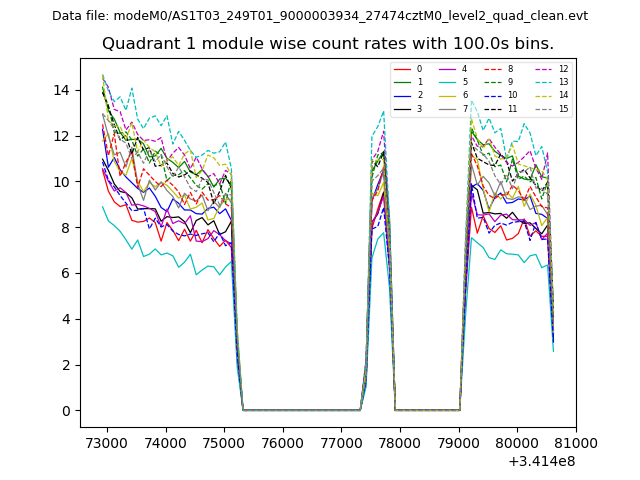
| Module-wise count rates for Quadrant A Data is divided into 100 sec bins |
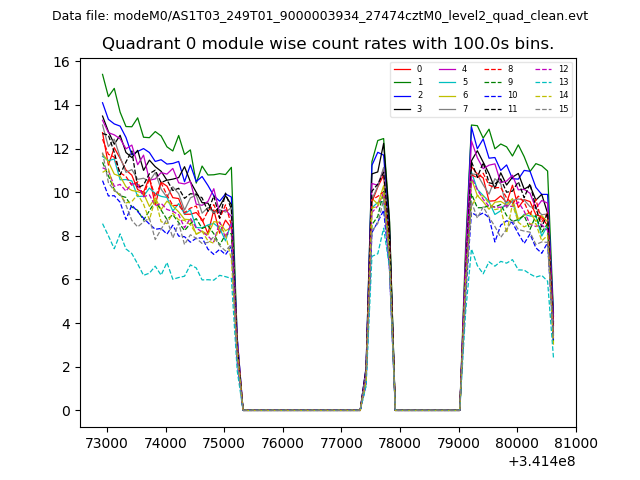 |
 |
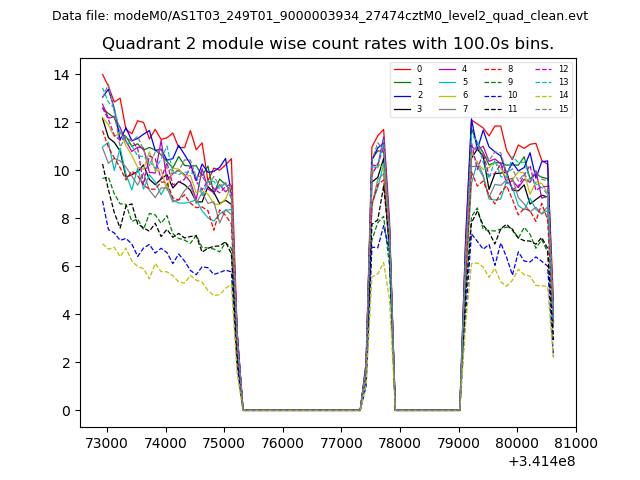
| Module-wise count rates for Quadrant B Data is divided into 100 sec bins |
 |
 |
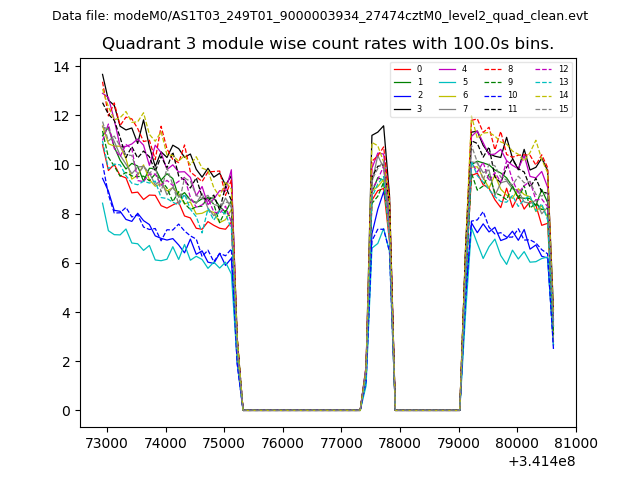
| Module-wise count rates for Quadrant C Data is divided into 100 sec bins |
 |
 |
| Module-wise count rates for Quadrant D Data is divided into 100 sec bins |
 |
 |
| Parameter | Plot |
|---|---|
| CZT HV Monitor | 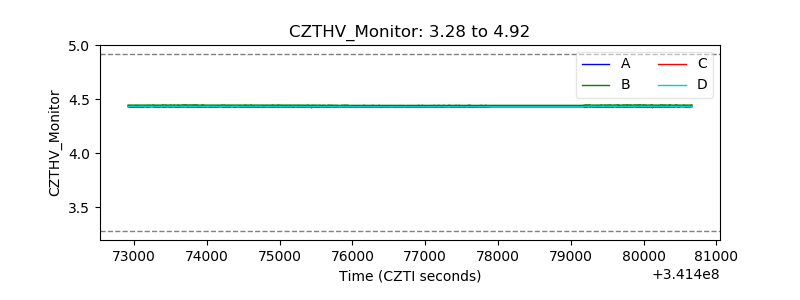 |
| D_VDD | 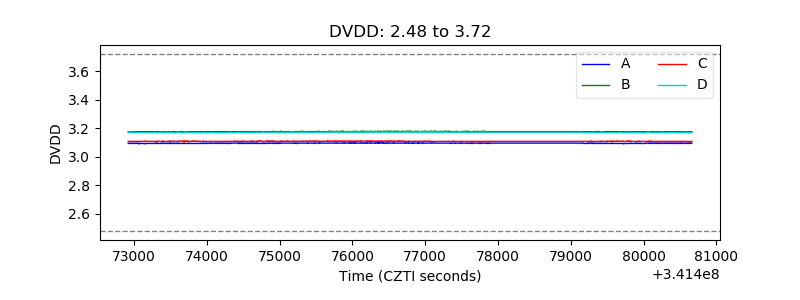 |
| Temperature 1 | 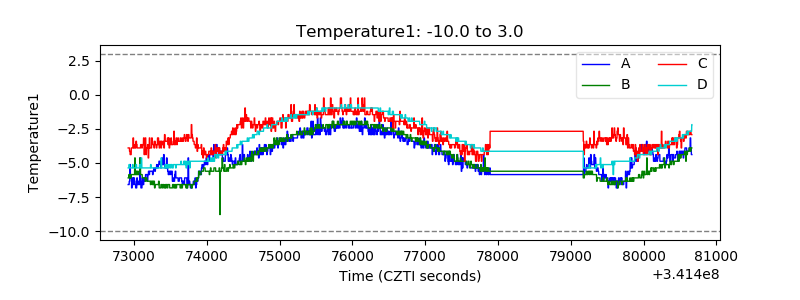 |
| Veto HV Monitor | 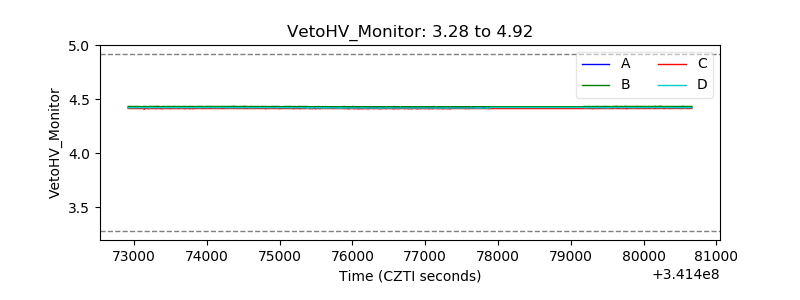 |
| Veto LLD | 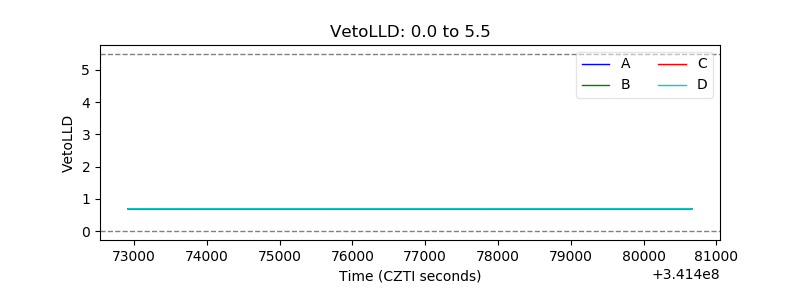 |
| Alpha Counter | 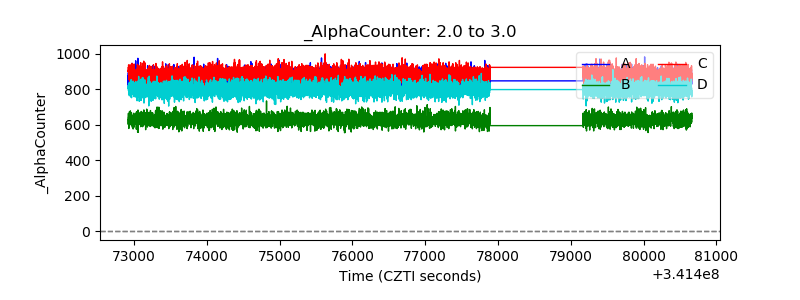 |
| _CPM_Rate | 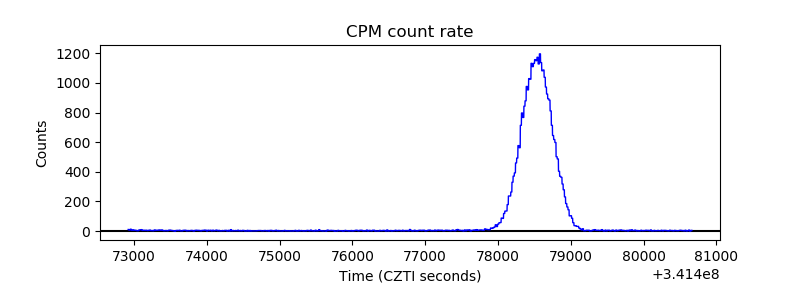 |
| CZT Counter | 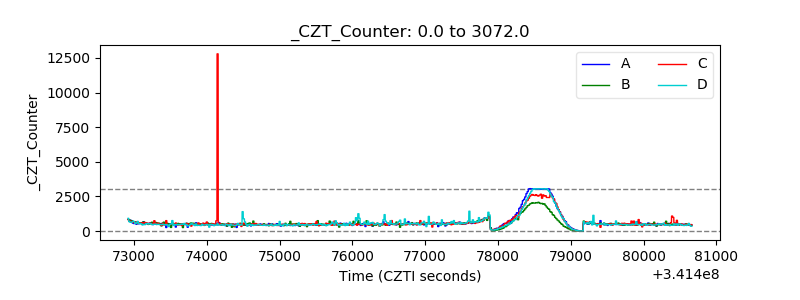 |
| +2.5 Volts monitor |  |
| +5 Volts monitor |  |
| _ROLL_ROT | 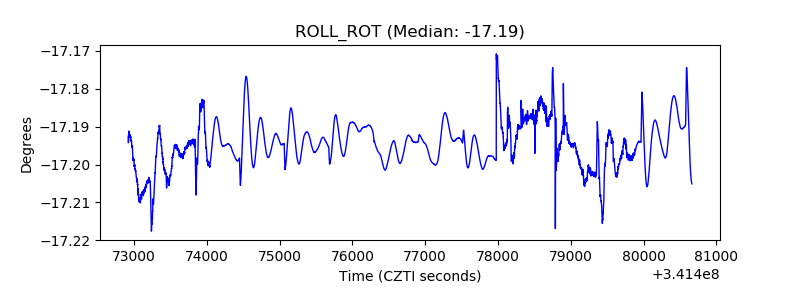 |
| _Roll_DEC | 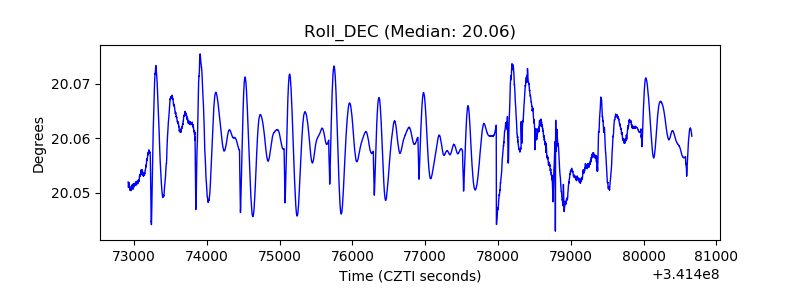 |
| _Roll_RA | 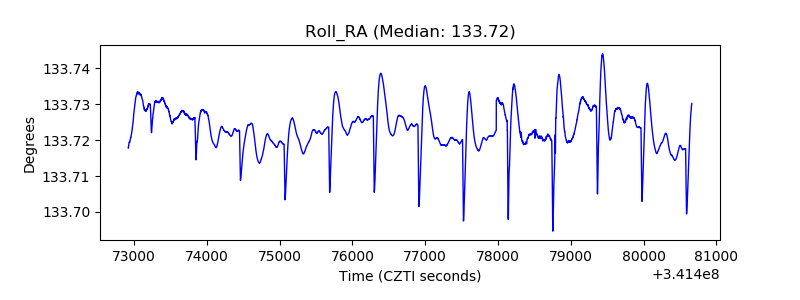 |
| Veto Counter |  |