| Param | Original file | Final file |
|---|---|---|
| Filename | modeM0/AS1T03_249T01_9000003934_27475cztM0_level2.evt | modeM0/AS1T03_249T01_9000003934_27475cztM0_level2_quad_clean.evt |
| Size (bytes) | 539,193,600 | 96,071,040 |
| Size | 514.2 MB | 91.6 MB |
| Events in quadrant A | 3,270,938 | 626,888 |
| Events in quadrant B | 3,303,867 | 633,889 |
| Events in quadrant C | 3,330,966 | 599,720 |
| Events in quadrant D | 5,979,630 | 592,638 |
| Mode M0 | |||
|---|---|---|---|
| Quadrant | BADHDUFLAG | Total packets | Discarded packets |
| A | 0 | 13489 | 0 |
| B | 0 | 13630 | 0 |
| C | 0 | 13700 | 0 |
| D | 0 | 21937 | 0 |
| Mode M9 | |||
|---|---|---|---|
| Quadrant | BADHDUFLAG | Total packets | Discarded packets |
| A | 0 | 11 | 0 |
| B | 0 | 11 | 0 |
| C | 0 | 11 | 0 |
| D | 0 | 11 | 0 |
| Quadrant | Total seconds | Saturated seconds | Saturation percentage |
|---|---|---|---|
| A | 6539 | 46 | 0.703471% |
| B | 6540 | 59 | 0.902141% |
| C | 6540 | 58 | 0.886850% |
| D | 6540 | 1132 | 17.308869% |
Noise dominated data is calculated using 1-second bins in cleaned event files. If a bin has >2000 counts, and if more than 50% of those come from <1% of pixels, then it is considered to be noise-dominated and hence unusable.
| Quadrant | # 1 sec bins | Bins with >0 counts | Bins with >2000 counts | High rate bins dominated by noise | Noise dominated (total time) | Noise dominated (detector-on time) | Marked lightcurve |
|---|---|---|---|---|---|---|---|
| A | 7634 | 6540 | 0 | 0 | 0.00% | 0.00% | 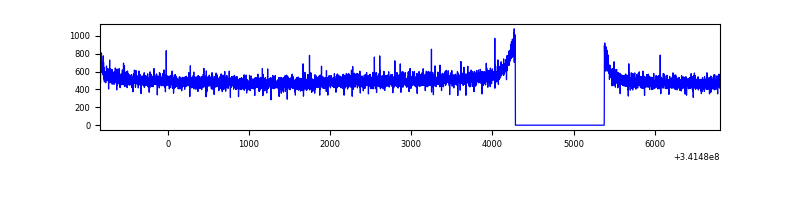 |
| B | 7635 | 6541 | 0 | 0 | 0.00% | 0.00% | 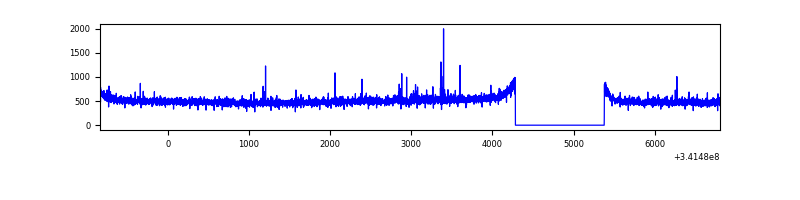 |
| C | 7635 | 6541 | 1 | 1 | 0.01% | 0.02% | 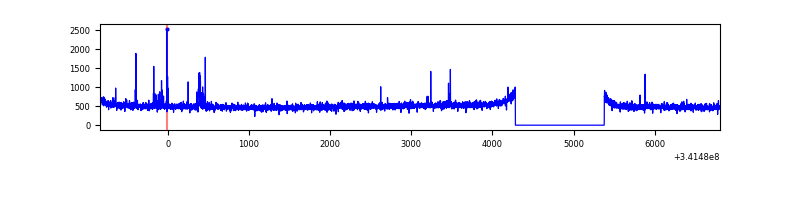 |
| D | 7635 | 6541 | 1058 | 1058 | 13.86% | 16.17% | 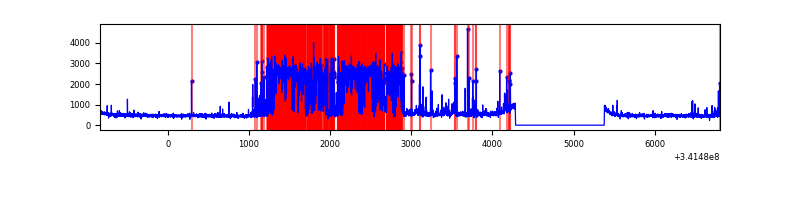 |
Top three noisy pixels from each quadrant. If the there are fewer than three noisy pixels in the level2.evt file, extra rows are filled as -1
| Pixel properties | Quadrant properties | ||||||
|---|---|---|---|---|---|---|---|
| Quadrant | DetID | PixID | Counts | Sigma | Mean | Median | Sigma |
| A | 13 | 254 | 10994 | 60.29 | 847 | 831 | 168.6 |
| A | 3 | 137 | 7612 | 40.23 | 847 | 831 | 168.6 |
| A | 0 | 226 | 7390 | 38.91 | 847 | 831 | 168.6 |
| B | 12 | 111 | 19160 | 115.49 | 836 | 816 | 158.8 |
| B | 11 | 111 | 17380 | 104.29 | 836 | 816 | 158.8 |
| B | 14 | 111 | 15894 | 94.93 | 836 | 816 | 158.8 |
| C | 14 | 238 | 131364 | 692.93 | 803 | 807 | 188.4 |
| C | 10 | 22 | 33112 | 171.46 | 803 | 807 | 188.4 |
| C | 2 | 16 | 32533 | 168.38 | 803 | 807 | 188.4 |
| D | 1 | 52 | 3011302 | 16691.46 | 756 | 736 | 180.4 |
| D | 2 | 250 | 42153 | 229.63 | 756 | 736 | 180.4 |
| D | 2 | 234 | 23967 | 128.8 | 756 | 736 | 180.4 |
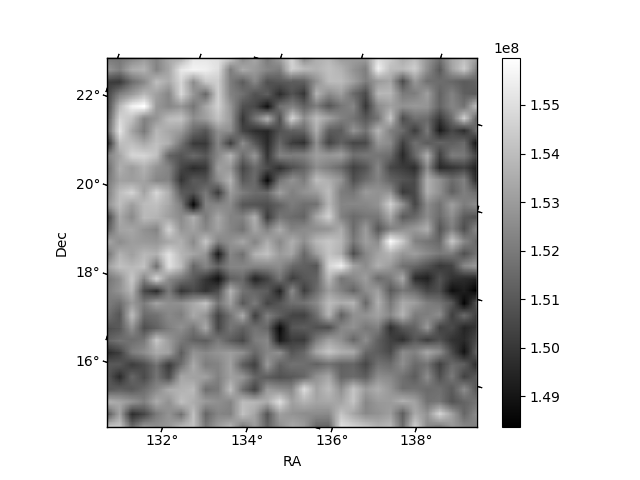
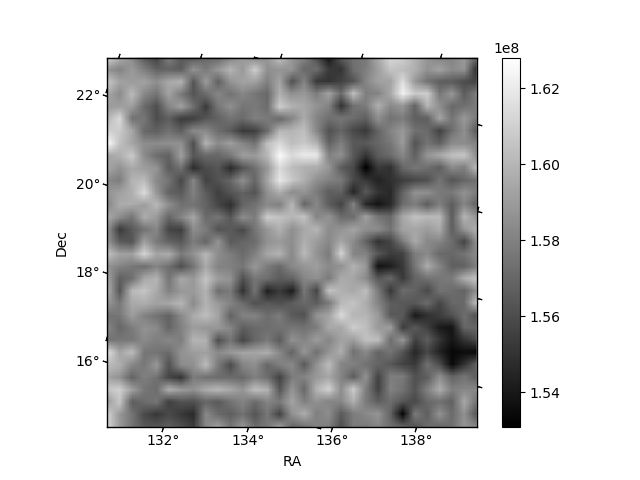
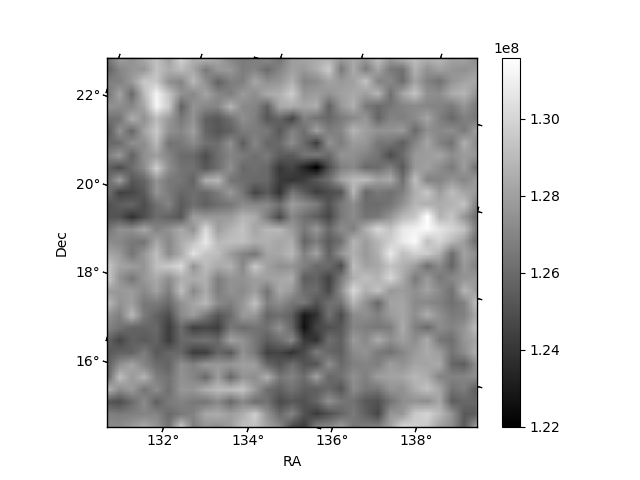
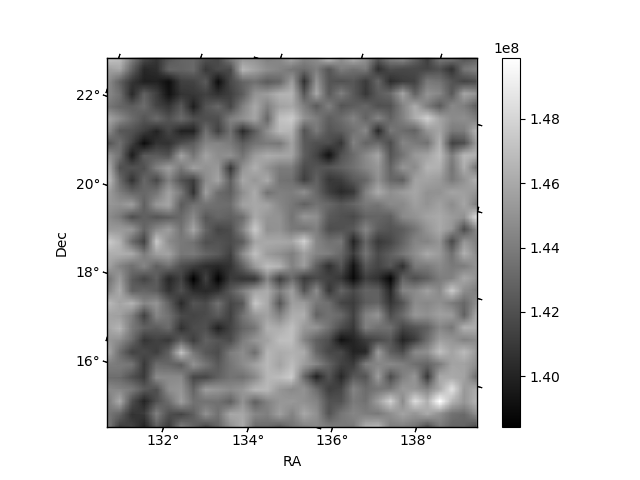
Histogram calculated using DETX and DETY for each event in the final _common_clean file
| Quadrant A | 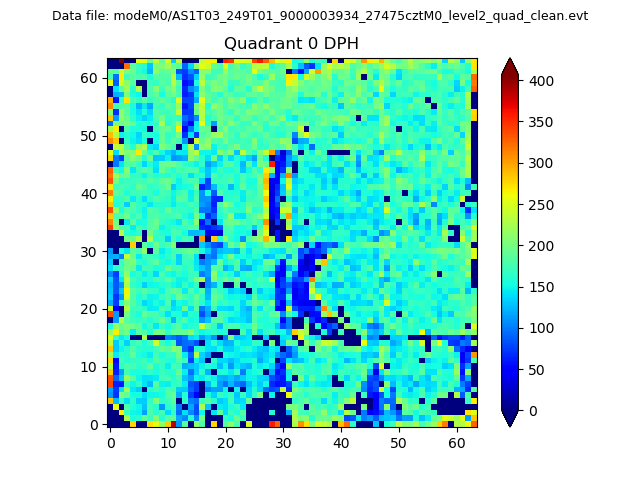 |
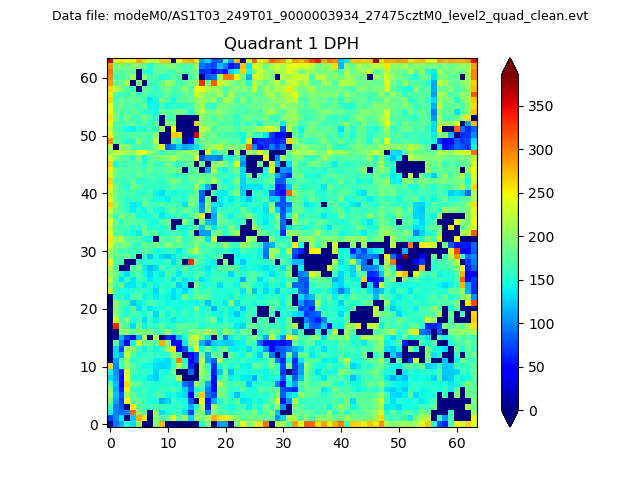 |
Quadrant B |
|---|---|---|---|
| Quadrant D | 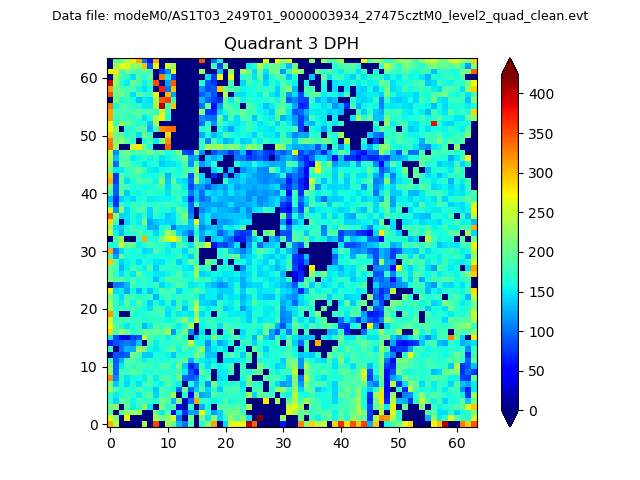 |
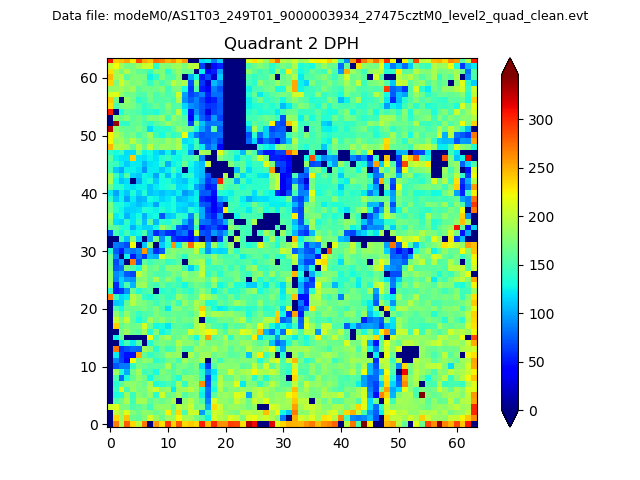 |
Quadrant C |
| Plot type | Count rate plots | Images |
|---|---|---|
| Comparison with Poisson distribution Blue bars denote a histogram of data divided into 1 sec bins. Red curve is a Poisson curve with rate = median count rate of data. |
 |
 |
| Quadrant-wise count rates Data is divided into 100 sec bins |
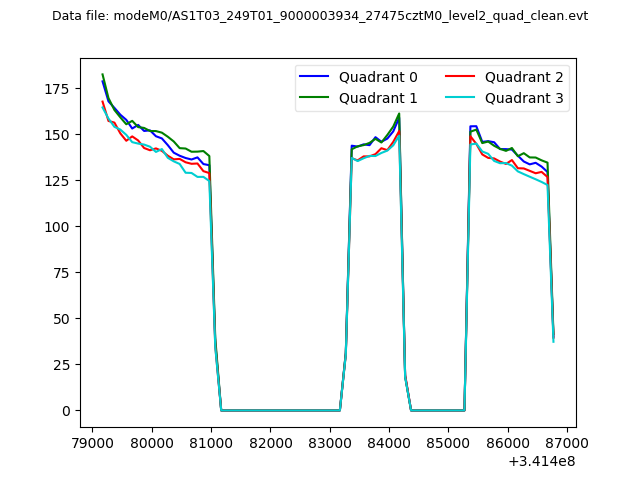 |
|
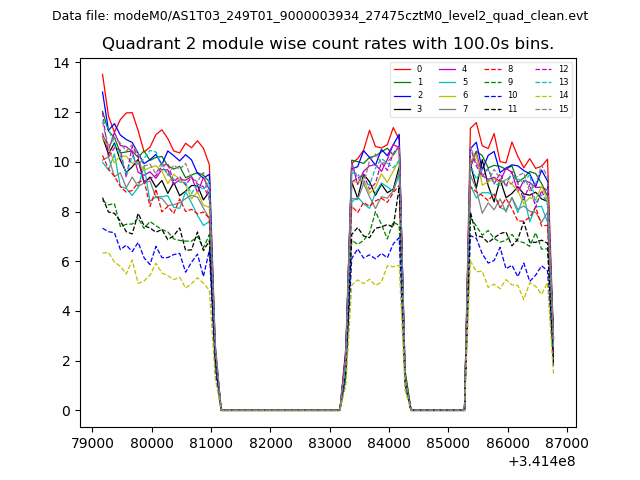
| Module-wise count rates for Quadrant A Data is divided into 100 sec bins |
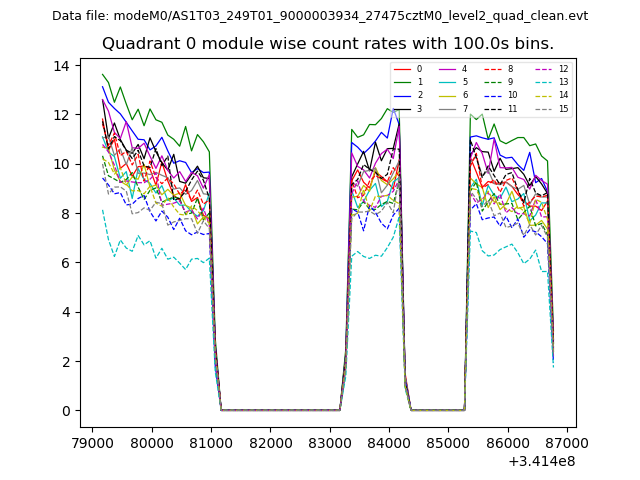 |
 |
| Module-wise count rates for Quadrant B Data is divided into 100 sec bins |
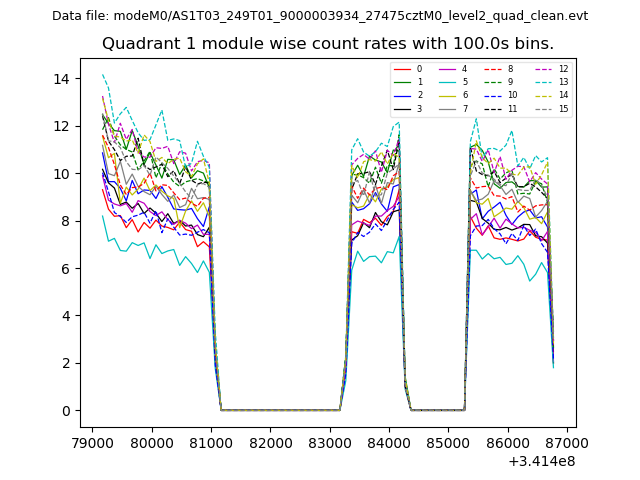 |
 |
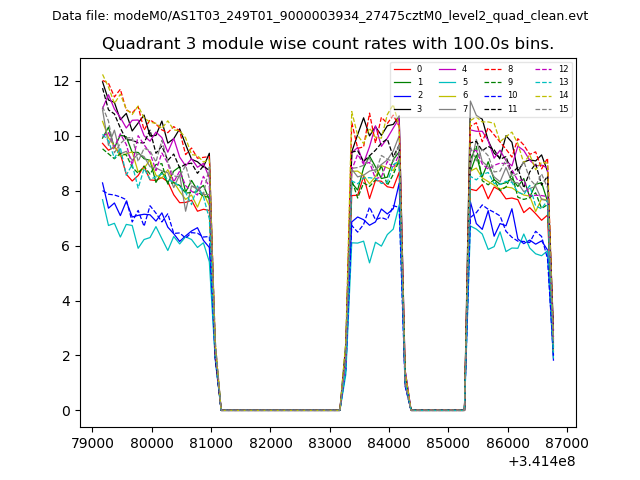
| Module-wise count rates for Quadrant C Data is divided into 100 sec bins |
 |
 |
| Module-wise count rates for Quadrant D Data is divided into 100 sec bins |
 |
 |
| Parameter | Plot |
|---|---|
| CZT HV Monitor | 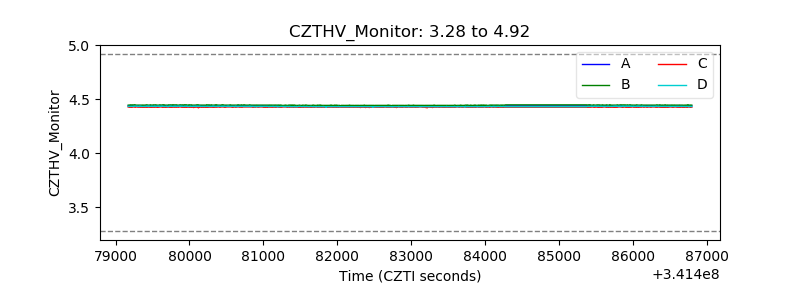 |
| D_VDD | 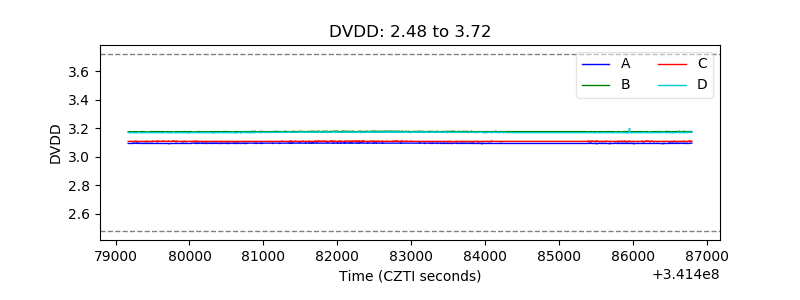 |
| Temperature 1 | 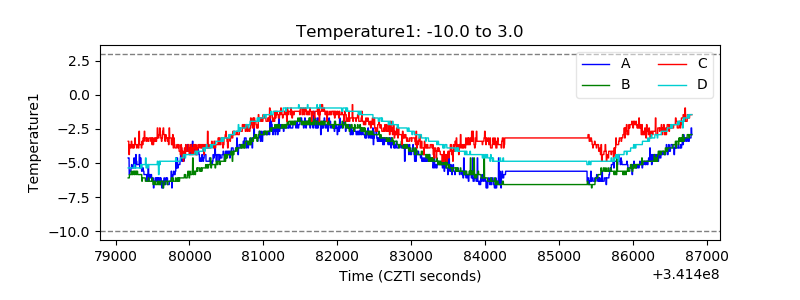 |
| Veto HV Monitor | 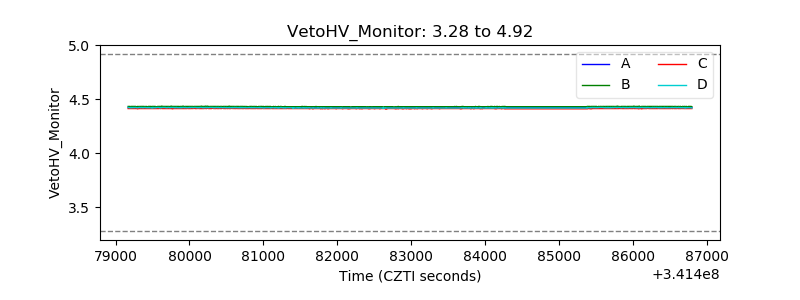 |
| Veto LLD | 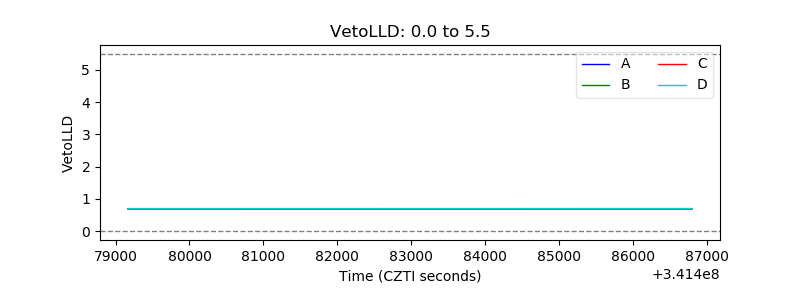 |
| Alpha Counter | 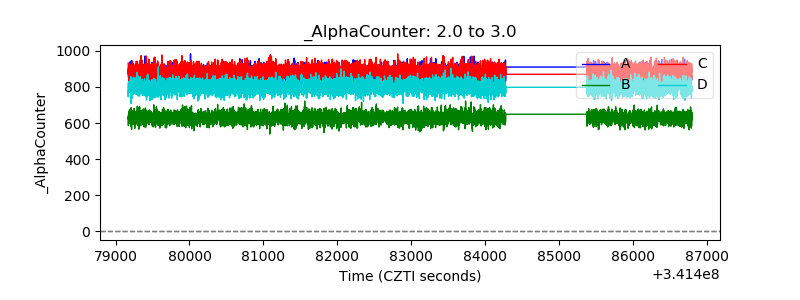 |
| _CPM_Rate | 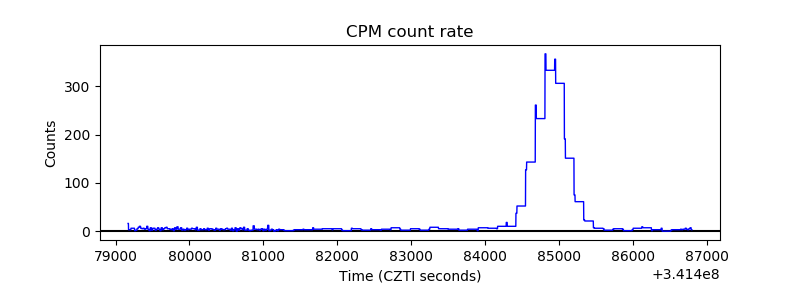 |
| CZT Counter |  |
| +2.5 Volts monitor | 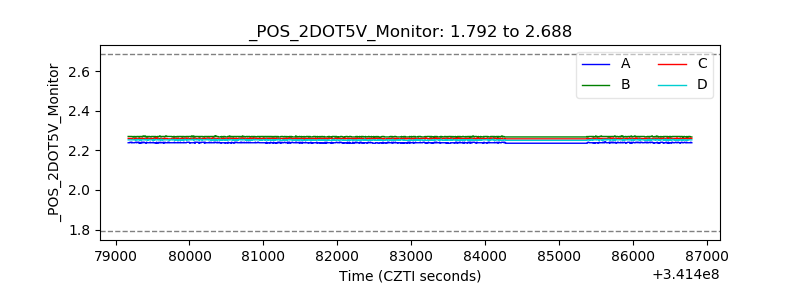 |
| +5 Volts monitor |  |
| _ROLL_ROT | 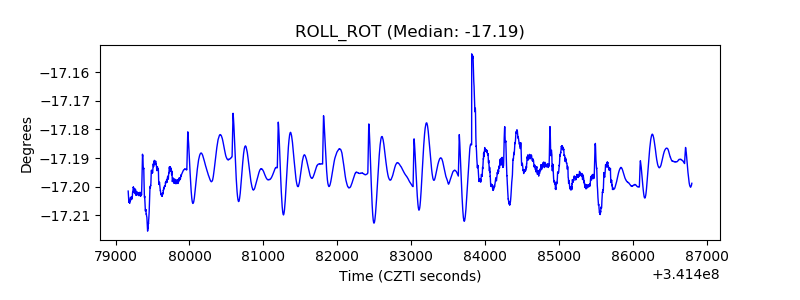 |
| _Roll_DEC | 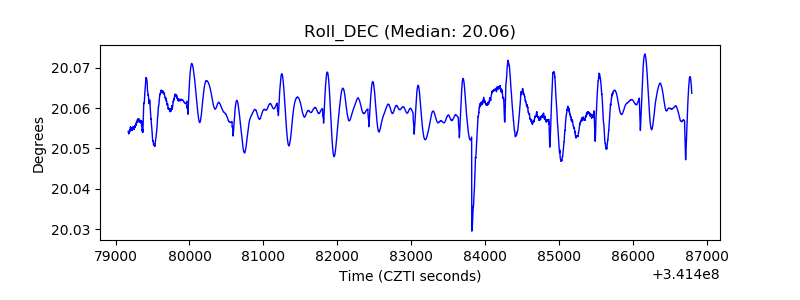 |
| _Roll_RA | 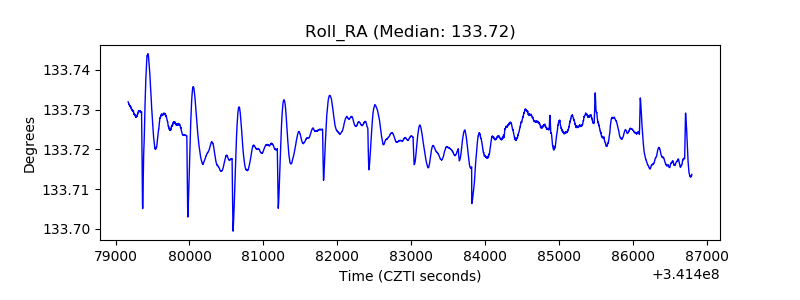 |
| Veto Counter |  |