| Param | Original file | Final file |
|---|---|---|
| Filename | modeM0/AS1T03_249T01_9000003934_27476cztM0_level2.evt | modeM0/AS1T03_249T01_9000003934_27476cztM0_level2_quad_clean.evt |
| Size (bytes) | 439,225,920 | 78,050,880 |
| Size | 418.9 MB | 74.4 MB |
| Events in quadrant A | 2,988,148 | 493,931 |
| Events in quadrant B | 3,095,630 | 497,209 |
| Events in quadrant C | 3,005,372 | 473,741 |
| Events in quadrant D | 3,792,343 | 466,514 |
| Mode M0 | |||
|---|---|---|---|
| Quadrant | BADHDUFLAG | Total packets | Discarded packets |
| A | 0 | 12624 | 0 |
| B | 0 | 12934 | 0 |
| C | 0 | 12641 | 0 |
| D | 0 | 15258 | 0 |
| Mode M9 | |||
|---|---|---|---|
| Quadrant | BADHDUFLAG | Total packets | Discarded packets |
| A | 0 | 7 | 0 |
| B | 0 | 7 | 0 |
| C | 0 | 7 | 0 |
| D | 0 | 7 | 0 |
| Quadrant | Total seconds | Saturated seconds | Saturation percentage |
|---|---|---|---|
| A | 6179 | 67 | 1.084318% |
| B | 6179 | 83 | 1.343259% |
| C | 6180 | 101 | 1.634304% |
| D | 6180 | 115 | 1.860841% |
Noise dominated data is calculated using 1-second bins in cleaned event files. If a bin has >2000 counts, and if more than 50% of those come from <1% of pixels, then it is considered to be noise-dominated and hence unusable.
| Quadrant | # 1 sec bins | Bins with >0 counts | Bins with >2000 counts | High rate bins dominated by noise | Noise dominated (total time) | Noise dominated (detector-on time) | Marked lightcurve |
|---|---|---|---|---|---|---|---|
| A | 6914 | 6180 | 0 | 0 | 0.00% | 0.00% | 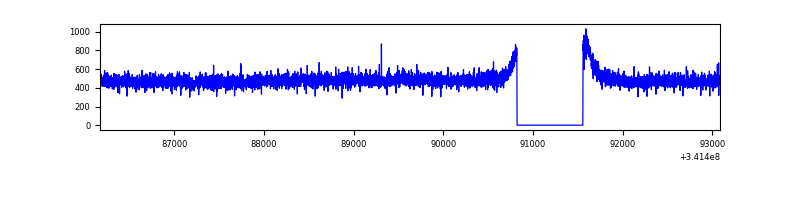 |
| B | 6914 | 6180 | 1 | 1 | 0.01% | 0.02% | 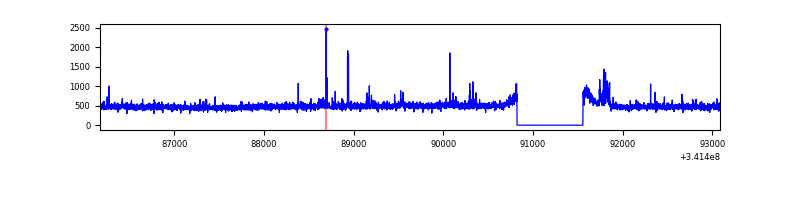 |
| C | 6915 | 6181 | 0 | 0 | 0.00% | 0.00% | 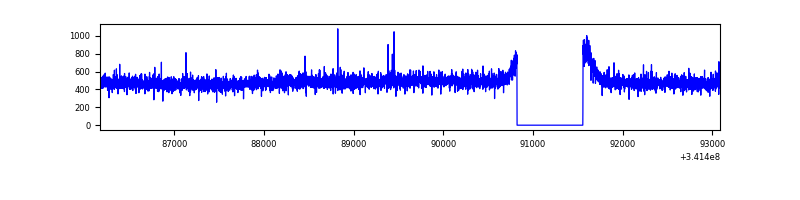 |
| D | 6915 | 6180 | 66 | 66 | 0.95% | 1.07% | 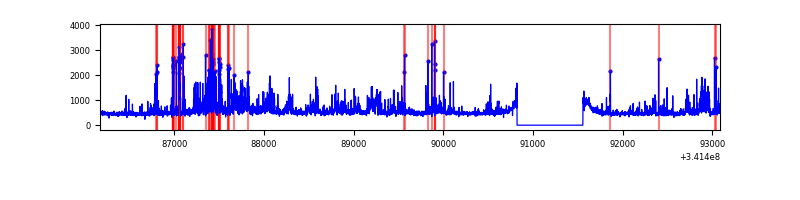 |
Top three noisy pixels from each quadrant. If the there are fewer than three noisy pixels in the level2.evt file, extra rows are filled as -1
| Pixel properties | Quadrant properties | ||||||
|---|---|---|---|---|---|---|---|
| Quadrant | DetID | PixID | Counts | Sigma | Mean | Median | Sigma |
| A | 13 | 254 | 10500 | 63.07 | 774 | 758 | 154.5 |
| A | 3 | 137 | 7288 | 42.28 | 774 | 758 | 154.5 |
| A | 0 | 226 | 6665 | 38.24 | 774 | 758 | 154.5 |
| B | 3 | 64 | 60731 | 409.19 | 762 | 742 | 146.6 |
| B | 0 | 230 | 23136 | 152.75 | 762 | 742 | 146.6 |
| B | 12 | 111 | 17929 | 117.24 | 762 | 742 | 146.6 |
| C | 14 | 238 | 117810 | 674.68 | 739 | 743 | 173.5 |
| C | 2 | 16 | 5411 | 26.9 | 739 | 743 | 173.5 |
| C | 13 | 61 | 5143 | 25.36 | 739 | 743 | 173.5 |
| D | 1 | 52 | 795592 | 4442.71 | 746 | 726 | 178.9 |
| D | 2 | 250 | 76482 | 423.42 | 746 | 726 | 178.9 |
| D | 8 | 195 | 34815 | 190.53 | 746 | 726 | 178.9 |
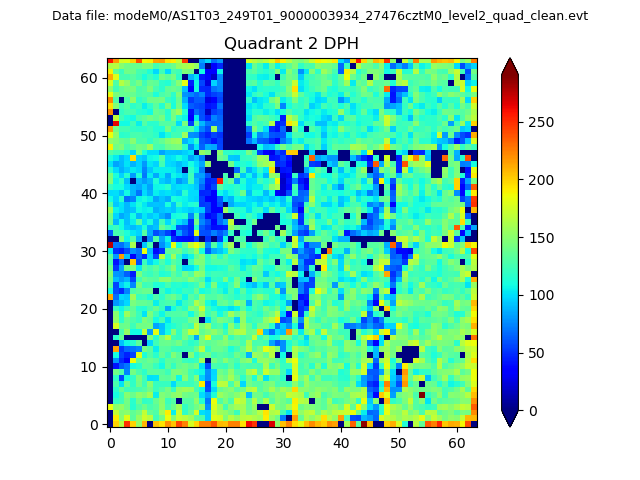
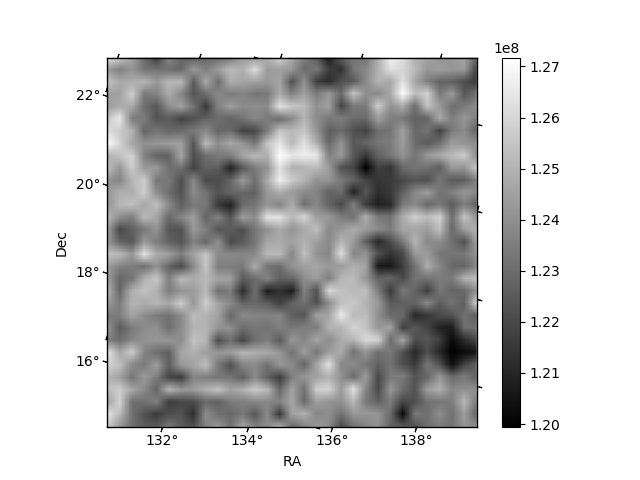
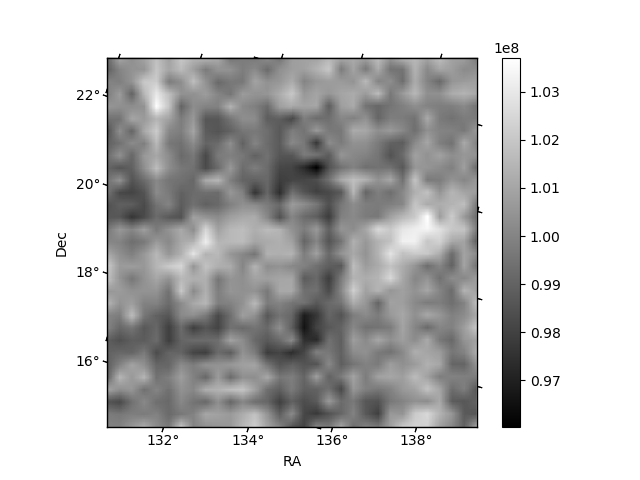
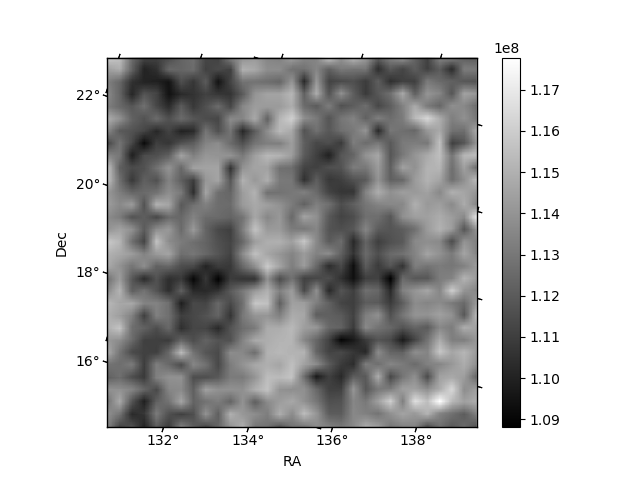
Histogram calculated using DETX and DETY for each event in the final _common_clean file
| Quadrant A | 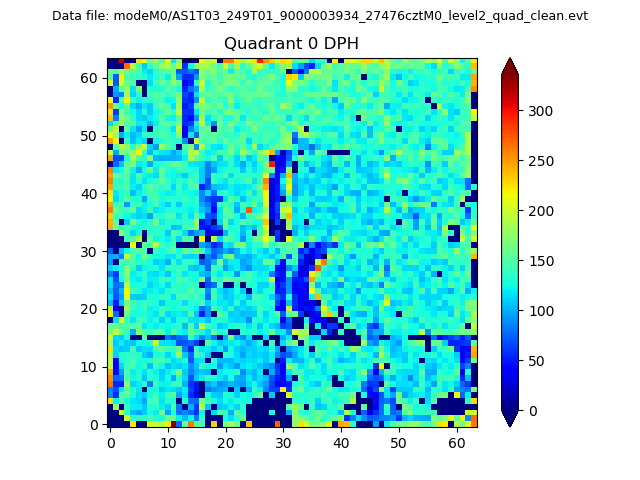 |
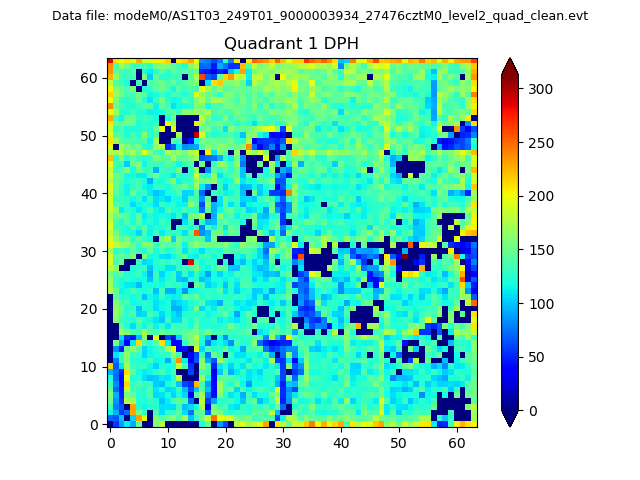 |
Quadrant B |
|---|---|---|---|
| Quadrant D | 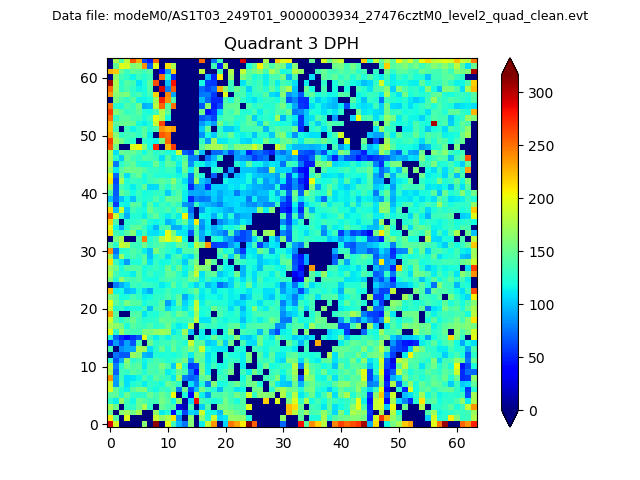 |
 |
Quadrant C |
| Plot type | Count rate plots | Images |
|---|---|---|
| Comparison with Poisson distribution Blue bars denote a histogram of data divided into 1 sec bins. Red curve is a Poisson curve with rate = median count rate of data. |
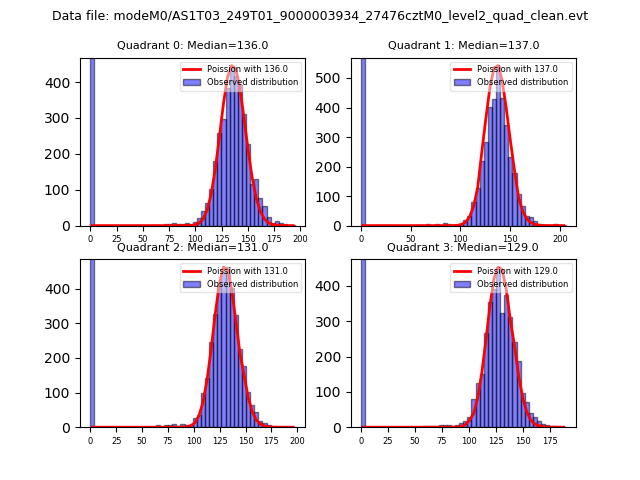 |
 |
| Quadrant-wise count rates Data is divided into 100 sec bins |
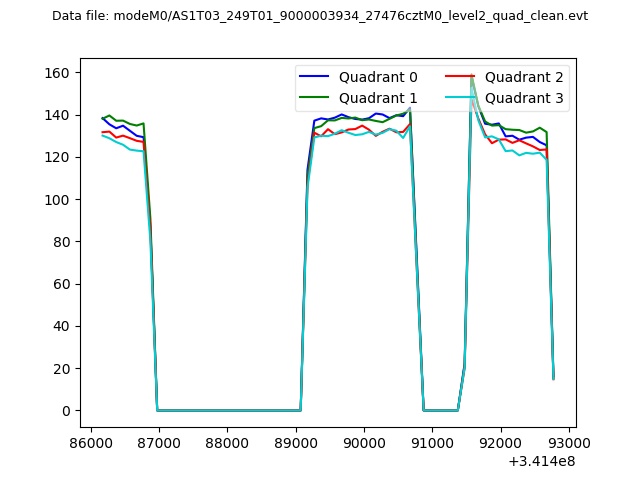 |
|
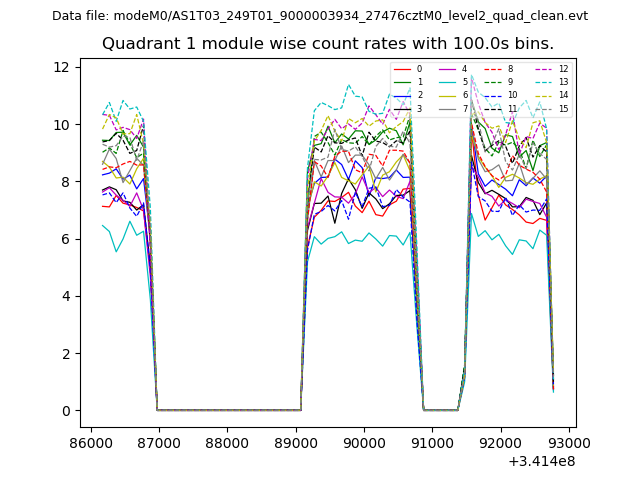
| Module-wise count rates for Quadrant A Data is divided into 100 sec bins |
 |
 |
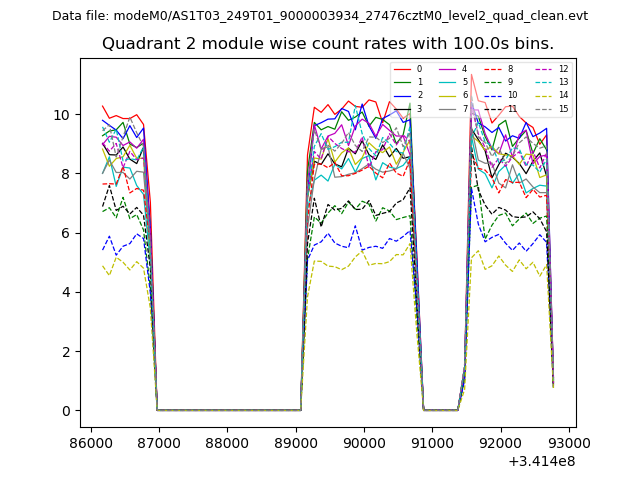
| Module-wise count rates for Quadrant B Data is divided into 100 sec bins |
 |
 |
| Module-wise count rates for Quadrant C Data is divided into 100 sec bins |
 |
 |
| Module-wise count rates for Quadrant D Data is divided into 100 sec bins |
 |
 |
| Parameter | Plot |
|---|---|
| CZT HV Monitor |  |
| D_VDD | 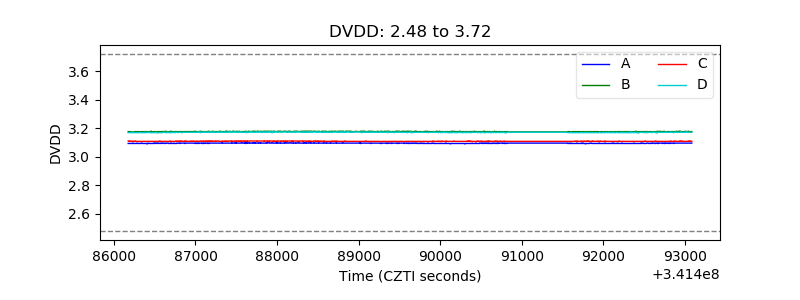 |
| Temperature 1 | 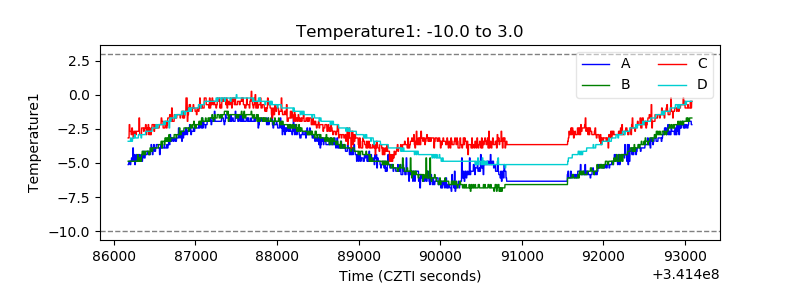 |
| Veto HV Monitor | 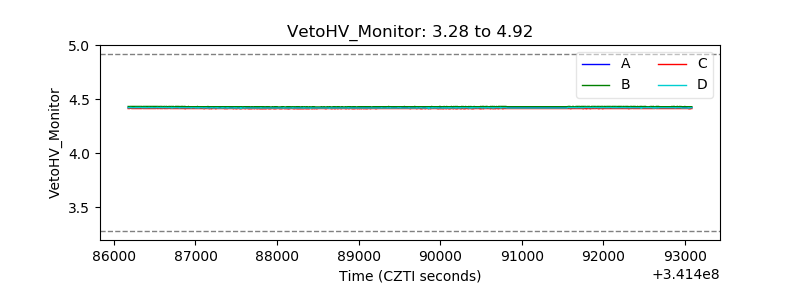 |
| Veto LLD | 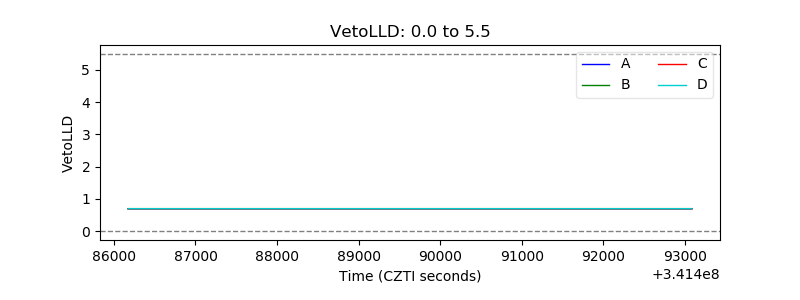 |
| Alpha Counter | 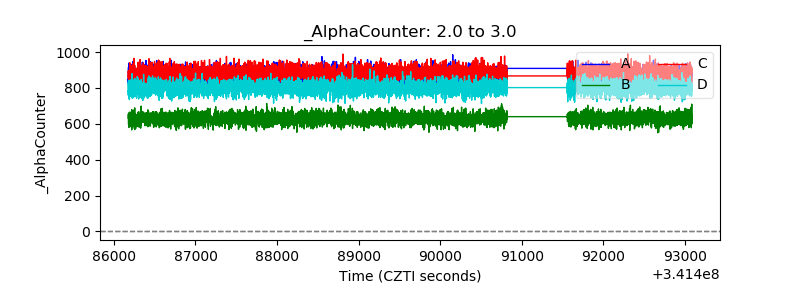 |
| _CPM_Rate | 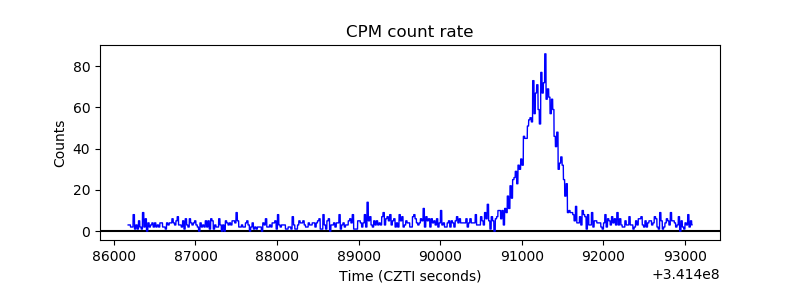 |
| CZT Counter | 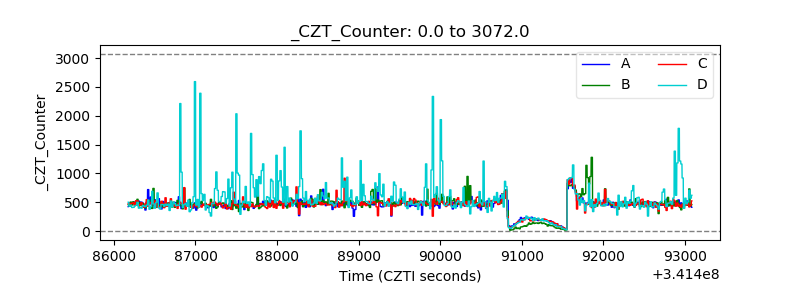 |
| +2.5 Volts monitor |  |
| +5 Volts monitor |  |
| _ROLL_ROT | 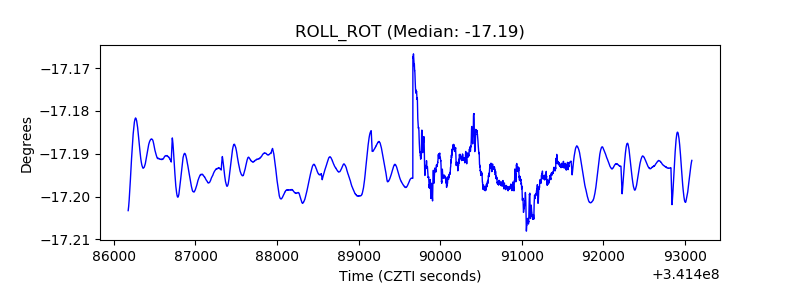 |
| _Roll_DEC | 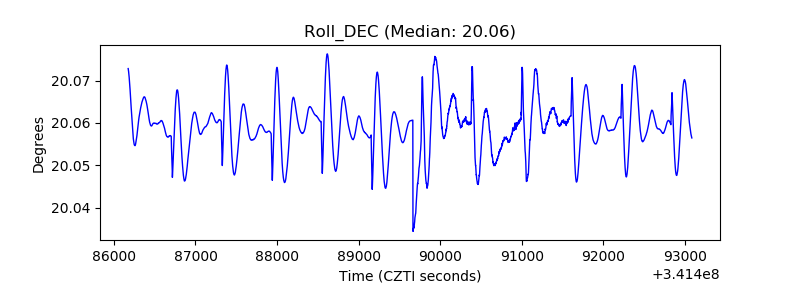 |
| _Roll_RA | 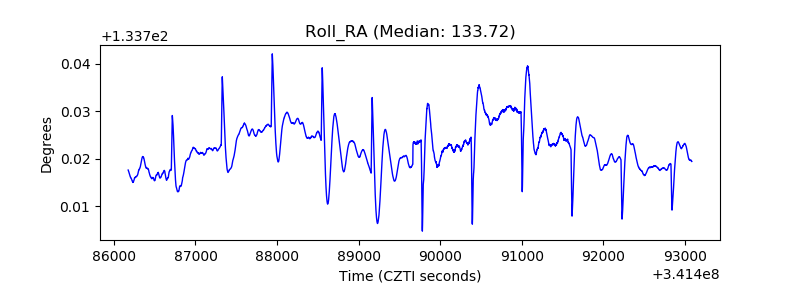 |
| Veto Counter | 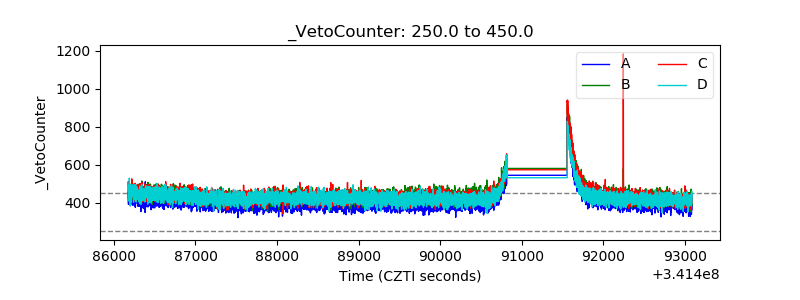 |