| Param | Original file | Final file |
|---|---|---|
| Filename | modeM0/AS1T03_249T01_9000003934_27477cztM0_level2.evt | modeM0/AS1T03_249T01_9000003934_27477cztM0_level2_quad_clean.evt |
| Size (bytes) | 529,741,440 | 91,324,800 |
| Size | 505.2 MB | 87.1 MB |
| Events in quadrant A | 3,531,564 | 576,451 |
| Events in quadrant B | 3,657,669 | 581,676 |
| Events in quadrant C | 3,550,894 | 555,402 |
| Events in quadrant D | 4,808,426 | 544,402 |
| Mode M0 | |||
|---|---|---|---|
| Quadrant | BADHDUFLAG | Total packets | Discarded packets |
| A | 0 | 15068 | 0 |
| B | 0 | 15338 | 0 |
| C | 0 | 15054 | 0 |
| D | 0 | 19142 | 0 |
| Mode M9 | |||
|---|---|---|---|
| Quadrant | BADHDUFLAG | Total packets | Discarded packets |
| A | 0 | 3 | 0 |
| B | 0 | 3 | 0 |
| C | 0 | 3 | 0 |
| D | 0 | 3 | 0 |
| Quadrant | Total seconds | Saturated seconds | Saturation percentage |
|---|---|---|---|
| A | 7285 | 184 | 2.525738% |
| B | 7286 | 208 | 2.854790% |
| C | 7286 | 246 | 3.376338% |
| D | 7286 | 275 | 3.774362% |
Noise dominated data is calculated using 1-second bins in cleaned event files. If a bin has >2000 counts, and if more than 50% of those come from <1% of pixels, then it is considered to be noise-dominated and hence unusable.
| Quadrant | # 1 sec bins | Bins with >0 counts | Bins with >2000 counts | High rate bins dominated by noise | Noise dominated (total time) | Noise dominated (detector-on time) | Marked lightcurve |
|---|---|---|---|---|---|---|---|
| A | 7530 | 7285 | 0 | 0 | 0.00% | 0.00% | 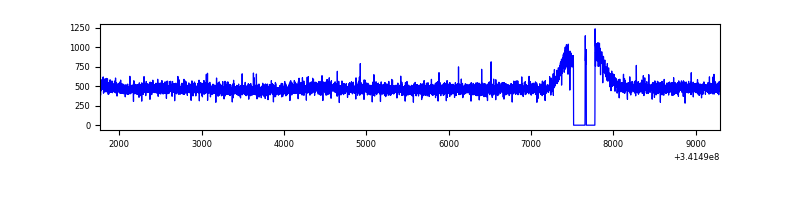 |
| B | 7531 | 7286 | 1 | 1 | 0.01% | 0.01% | 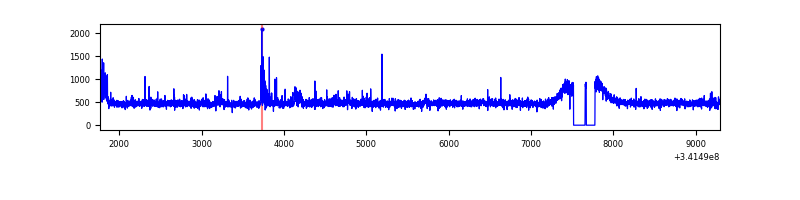 |
| C | 7531 | 7286 | 0 | 0 | 0.00% | 0.00% | 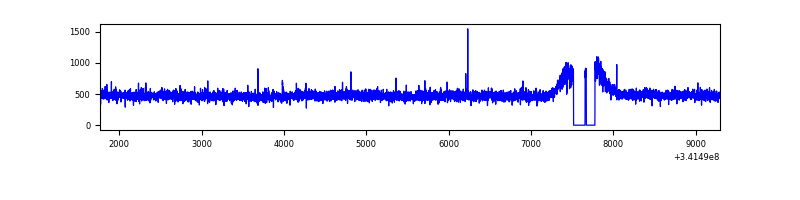 |
| D | 7531 | 7286 | 76 | 76 | 1.01% | 1.04% | 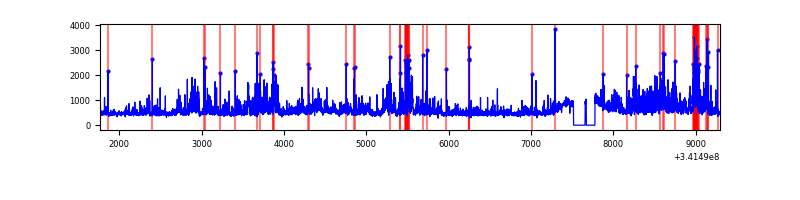 |
Top three noisy pixels from each quadrant. If the there are fewer than three noisy pixels in the level2.evt file, extra rows are filled as -1
| Pixel properties | Quadrant properties | ||||||
|---|---|---|---|---|---|---|---|
| Quadrant | DetID | PixID | Counts | Sigma | Mean | Median | Sigma |
| A | 13 | 254 | 12656 | 63.45 | 914 | 894 | 185.4 |
| A | 3 | 137 | 8827 | 42.79 | 914 | 894 | 185.4 |
| A | 0 | 226 | 7883 | 37.7 | 914 | 894 | 185.4 |
| B | 3 | 64 | 78303 | 441.17 | 901 | 877 | 175.5 |
| B | 15 | 32 | 22194 | 121.46 | 901 | 877 | 175.5 |
| B | 12 | 111 | 21781 | 119.11 | 901 | 877 | 175.5 |
| C | 14 | 238 | 137307 | 660.2 | 872 | 876 | 206.6 |
| C | 15 | 208 | 8604 | 37.4 | 872 | 876 | 206.6 |
| C | 2 | 16 | 7860 | 33.8 | 872 | 876 | 206.6 |
| D | 1 | 52 | 1126529 | 5323.79 | 883 | 858 | 211.4 |
| D | 2 | 250 | 139590 | 656.12 | 883 | 858 | 211.4 |
| D | 14 | 35 | 125671 | 590.29 | 883 | 858 | 211.4 |
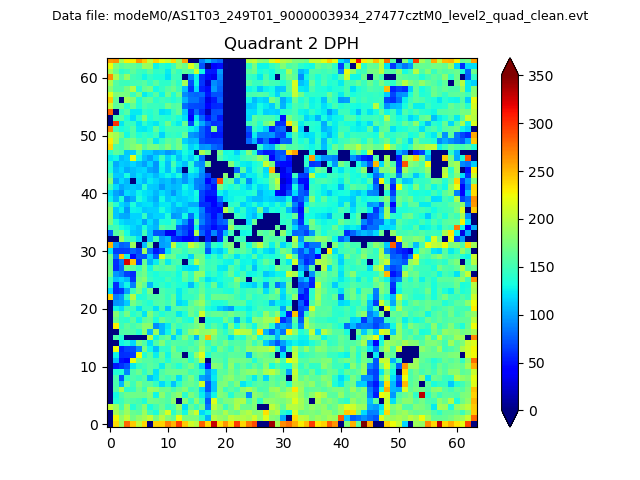
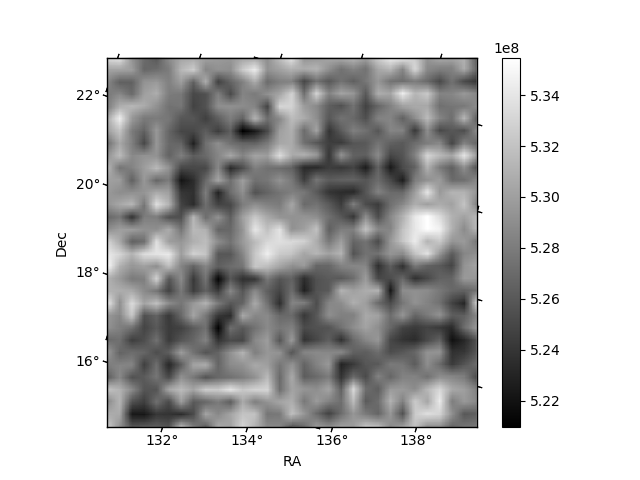
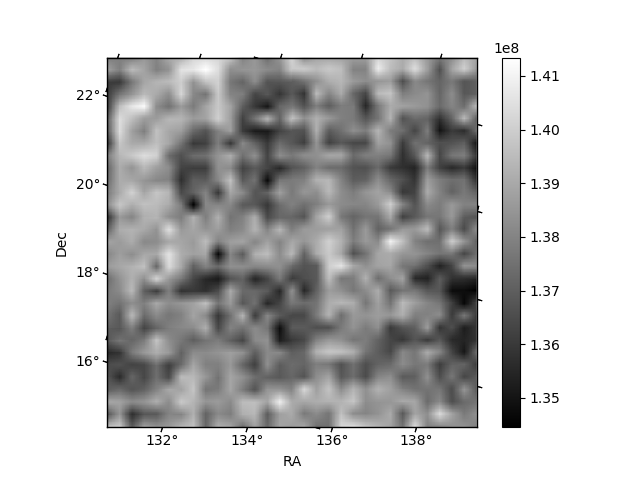
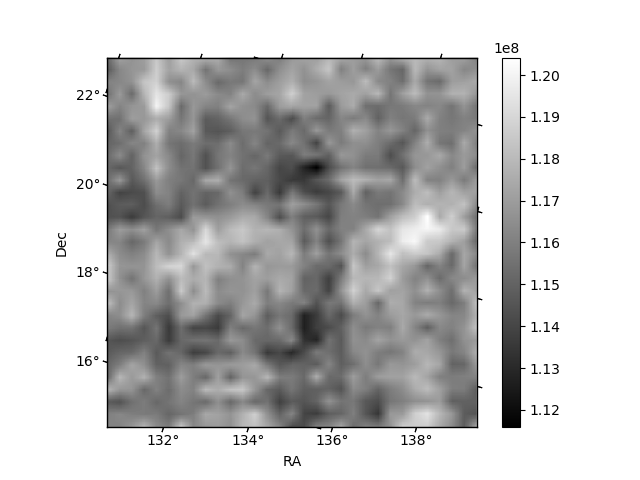
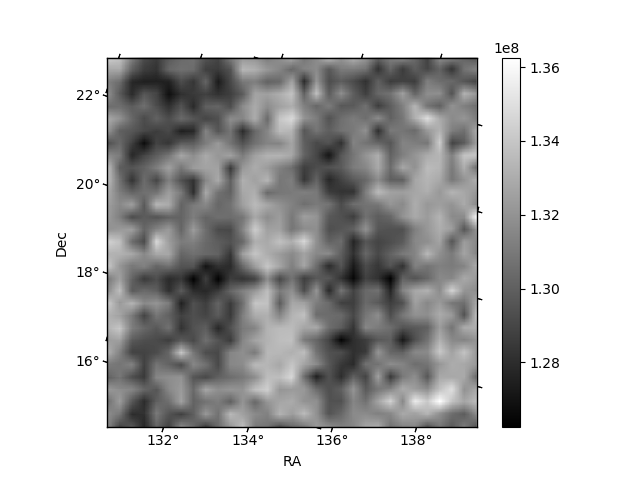
Histogram calculated using DETX and DETY for each event in the final _common_clean file
| Quadrant A | 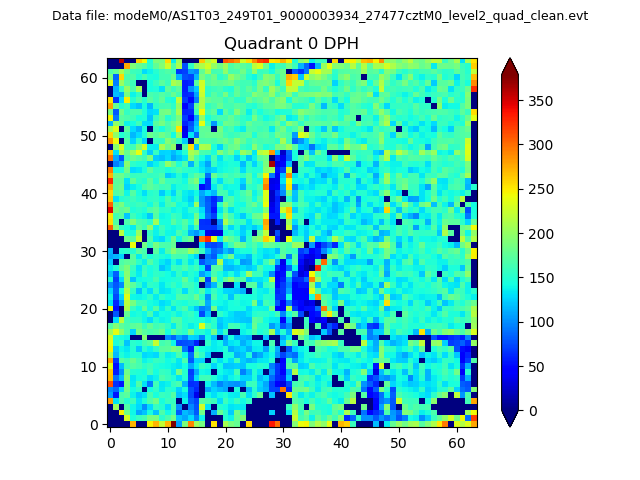 |
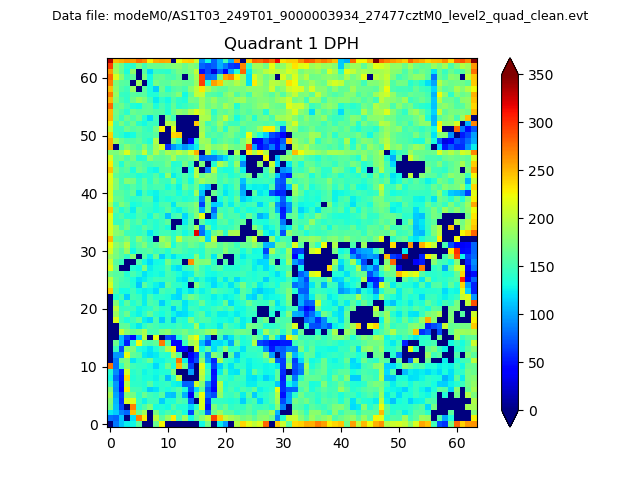 |
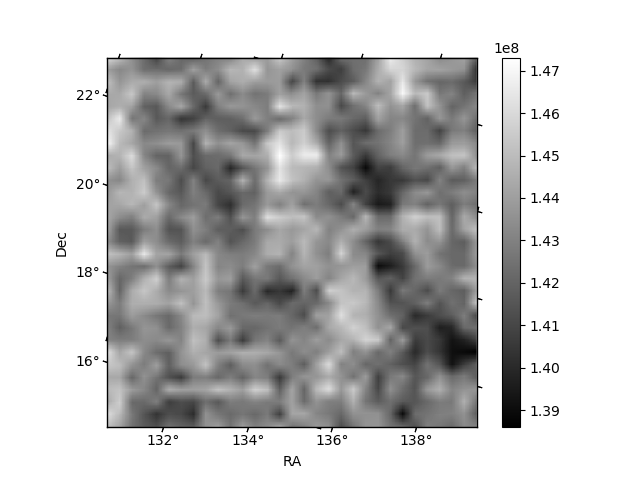
Quadrant B |
|---|---|---|---|
| Quadrant D | 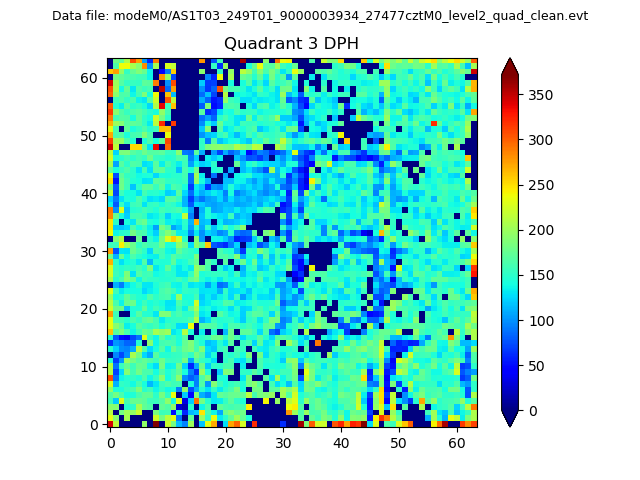 |
 |
Quadrant C |
| Plot type | Count rate plots | Images |
|---|---|---|
| Comparison with Poisson distribution Blue bars denote a histogram of data divided into 1 sec bins. Red curve is a Poisson curve with rate = median count rate of data. |
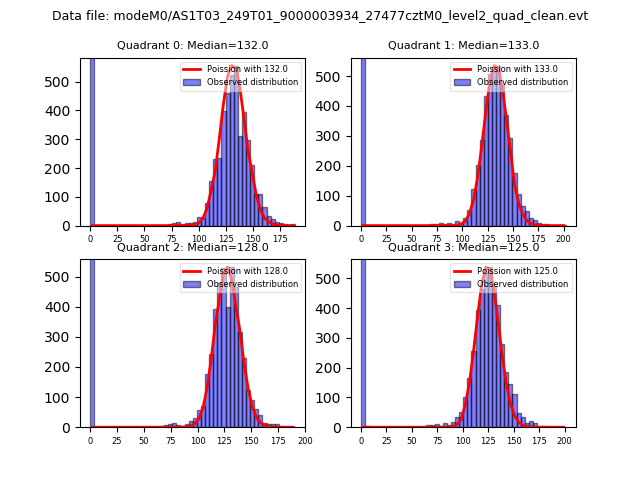 |
 |
| Quadrant-wise count rates Data is divided into 100 sec bins |
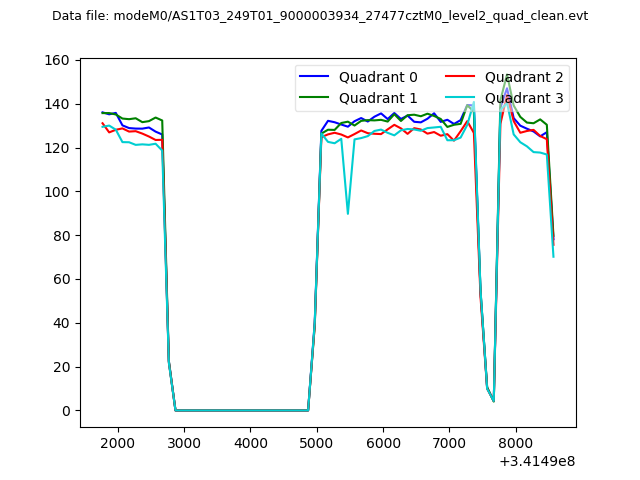 |
|
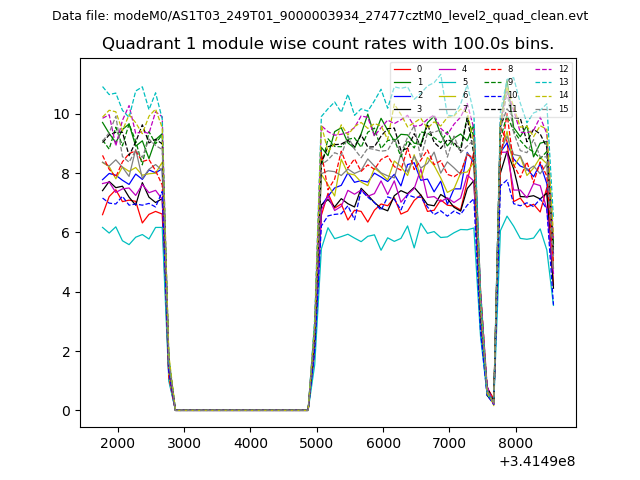
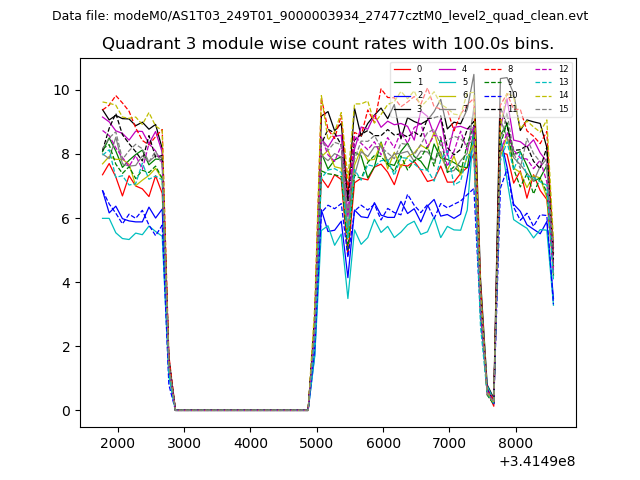
| Module-wise count rates for Quadrant A Data is divided into 100 sec bins |
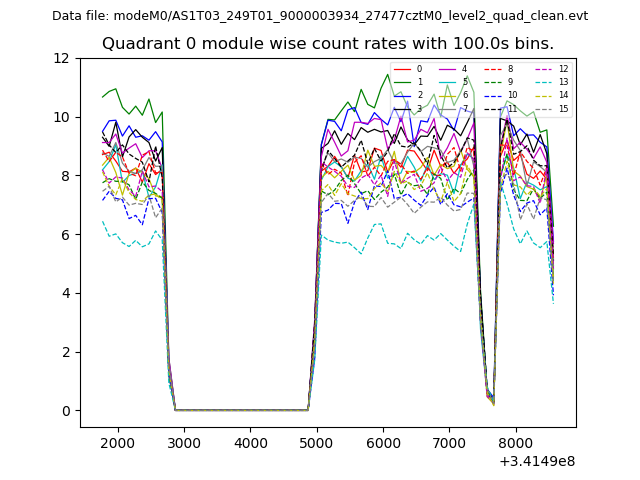 |
 |
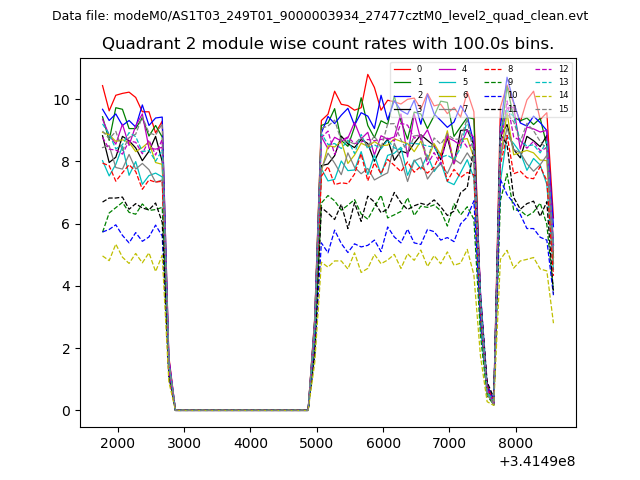
| Module-wise count rates for Quadrant B Data is divided into 100 sec bins |
 |
 |
| Module-wise count rates for Quadrant C Data is divided into 100 sec bins |
 |
 |
| Module-wise count rates for Quadrant D Data is divided into 100 sec bins |
 |
 |
| Parameter | Plot |
|---|---|
| CZT HV Monitor | 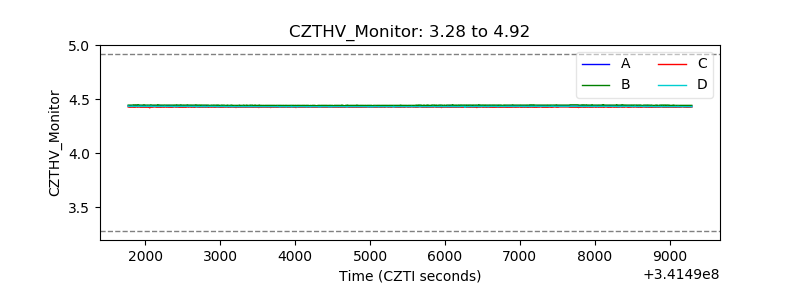 |
| D_VDD | 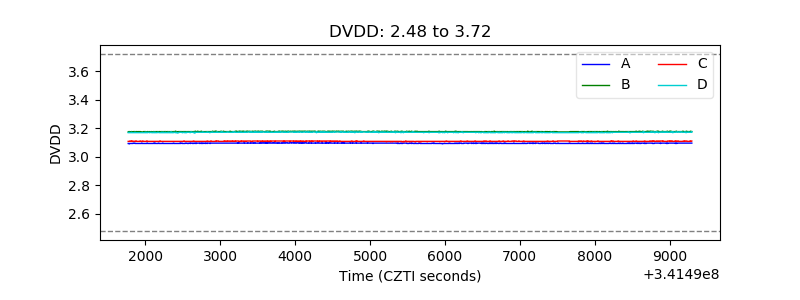 |
| Temperature 1 | 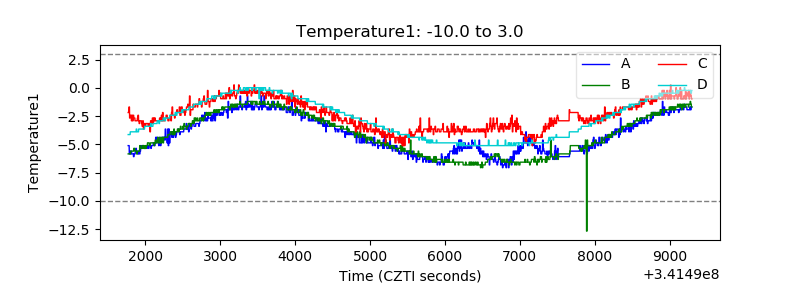 |
| Veto HV Monitor | 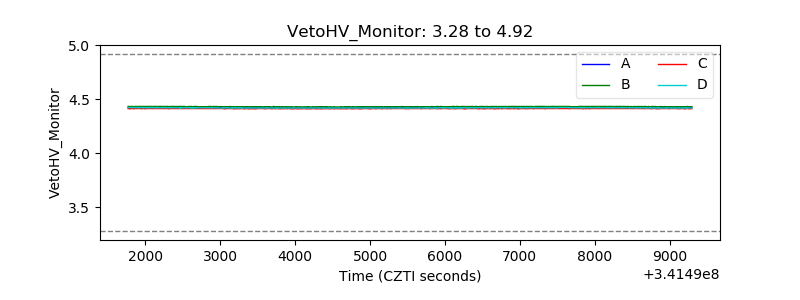 |
| Veto LLD | 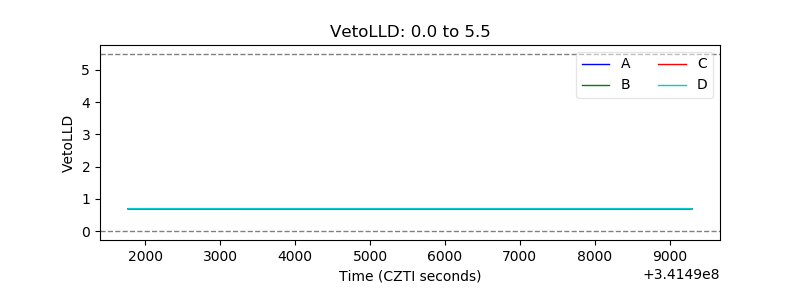 |
| Alpha Counter | 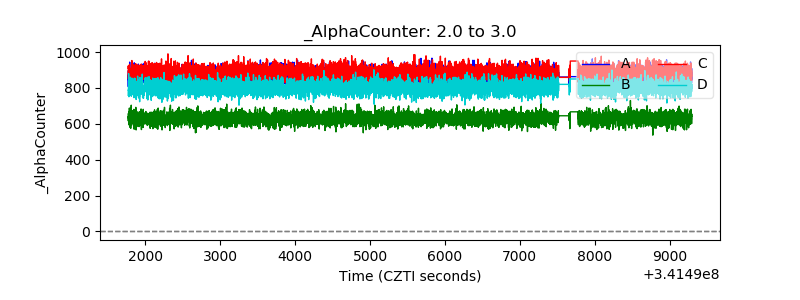 |
| _CPM_Rate | 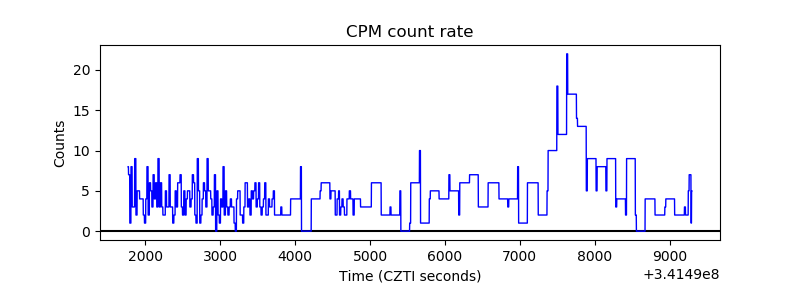 |
| CZT Counter | 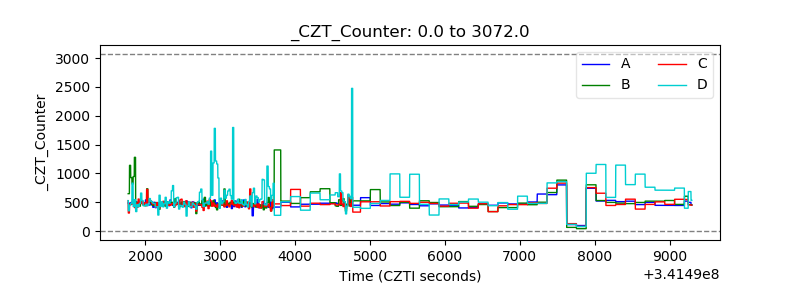 |
| +2.5 Volts monitor | 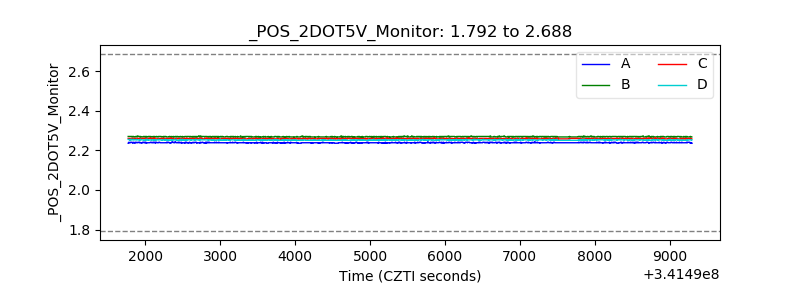 |
| +5 Volts monitor |  |
| _ROLL_ROT | 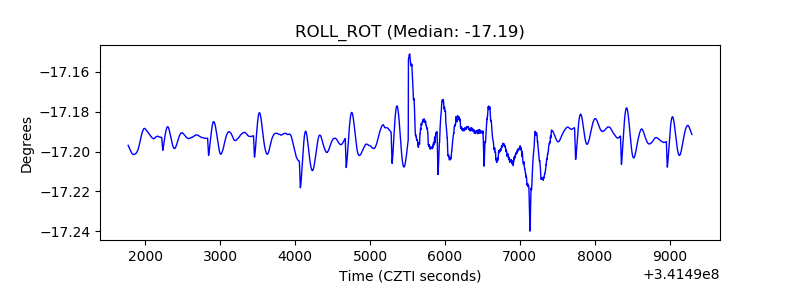 |
| _Roll_DEC | 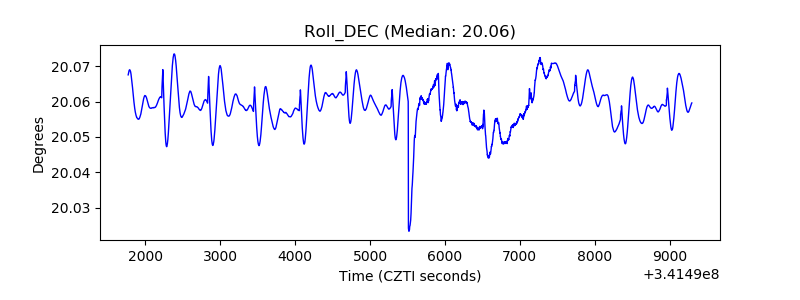 |
| _Roll_RA | 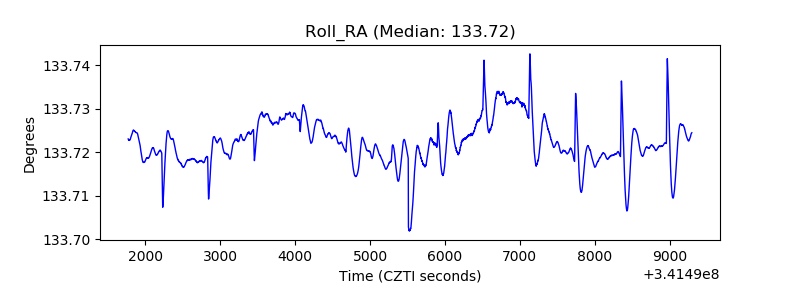 |
| Veto Counter |  |