| Param | Original file | Final file |
|---|---|---|
| Filename | modeM0/AS1T03_249T01_9000003934_27478cztM0_level2.evt | modeM0/AS1T03_249T01_9000003934_27478cztM0_level2_quad_clean.evt |
| Size (bytes) | 551,076,480 | 83,761,920 |
| Size | 525.5 MB | 79.9 MB |
| Events in quadrant A | 3,567,921 | 517,877 |
| Events in quadrant B | 3,617,899 | 518,899 |
| Events in quadrant C | 3,570,187 | 495,366 |
| Events in quadrant D | 5,429,782 | 487,640 |
| Mode M0 | |||
|---|---|---|---|
| Quadrant | BADHDUFLAG | Total packets | Discarded packets |
| A | 0 | 15265 | 0 |
| B | 0 | 15325 | 0 |
| C | 0 | 15265 | 0 |
| D | 0 | 21130 | 0 |
| Mode M9 | |||
|---|---|---|---|
| Quadrant | BADHDUFLAG | Total packets | Discarded packets |
| A | 0 | 2 | 0 |
| B | 0 | 2 | 0 |
| C | 0 | 2 | 0 |
| D | 0 | 2 | 0 |
| Quadrant | Total seconds | Saturated seconds | Saturation percentage |
|---|---|---|---|
| A | 7414 | 126 | 1.699487% |
| B | 7415 | 127 | 1.712744% |
| C | 7415 | 167 | 2.252192% |
| D | 7415 | 330 | 4.450438% |
Noise dominated data is calculated using 1-second bins in cleaned event files. If a bin has >2000 counts, and if more than 50% of those come from <1% of pixels, then it is considered to be noise-dominated and hence unusable.
| Quadrant | # 1 sec bins | Bins with >0 counts | Bins with >2000 counts | High rate bins dominated by noise | Noise dominated (total time) | Noise dominated (detector-on time) | Marked lightcurve |
|---|---|---|---|---|---|---|---|
| A | 7649 | 7415 | 2 | 2 | 0.03% | 0.03% | 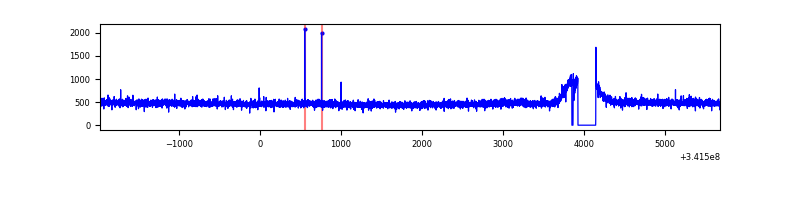 |
| B | 7650 | 7416 | 2 | 2 | 0.03% | 0.03% | 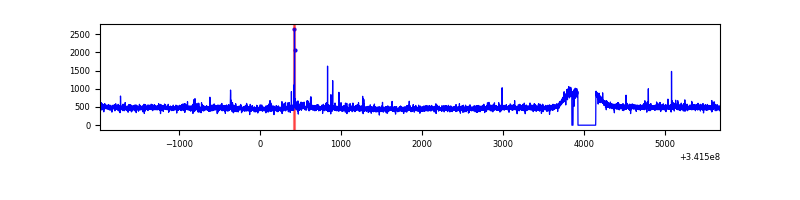 |
| C | 7650 | 7415 | 0 | 0 | 0.00% | 0.00% | 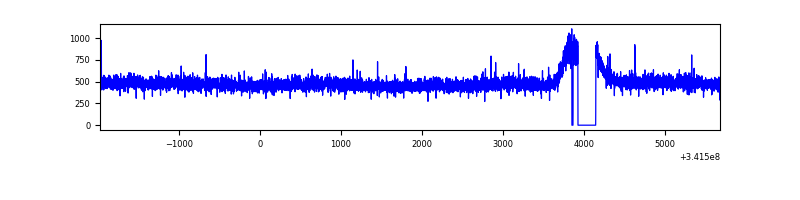 |
| D | 7649 | 7414 | 177 | 177 | 2.31% | 2.39% | 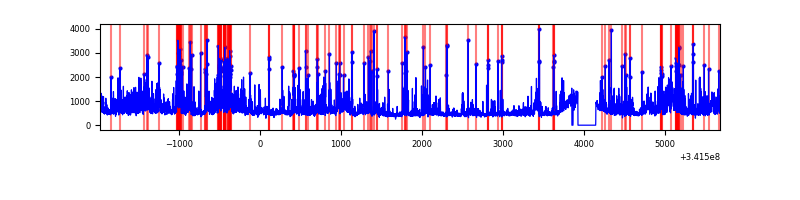 |
Top three noisy pixels from each quadrant. If the there are fewer than three noisy pixels in the level2.evt file, extra rows are filled as -1
| Pixel properties | Quadrant properties | ||||||
|---|---|---|---|---|---|---|---|
| Quadrant | DetID | PixID | Counts | Sigma | Mean | Median | Sigma |
| A | 13 | 254 | 12769 | 63.4 | 922 | 902 | 187.2 |
| A | 3 | 137 | 8972 | 43.11 | 922 | 902 | 187.2 |
| A | 0 | 226 | 7757 | 36.62 | 922 | 902 | 187.2 |
| B | 0 | 230 | 25806 | 141.7 | 908 | 885 | 175.9 |
| B | 12 | 111 | 21916 | 119.58 | 908 | 885 | 175.9 |
| B | 11 | 111 | 19903 | 108.14 | 908 | 885 | 175.9 |
| C | 14 | 238 | 138875 | 668.08 | 878 | 881 | 206.6 |
| C | 13 | 61 | 6023 | 24.89 | 878 | 881 | 206.6 |
| C | 2 | 16 | 5149 | 20.66 | 878 | 881 | 206.6 |
| D | 1 | 52 | 1646815 | 7720.86 | 885 | 858 | 213.2 |
| D | 12 | 33 | 151834 | 708.2 | 885 | 858 | 213.2 |
| D | 14 | 35 | 105068 | 488.83 | 885 | 858 | 213.2 |
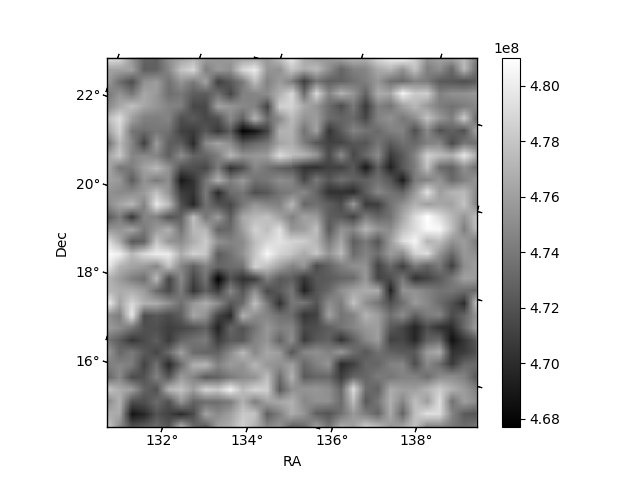
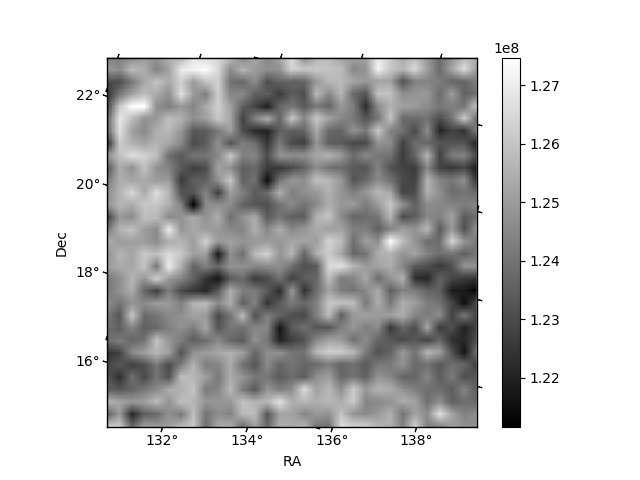
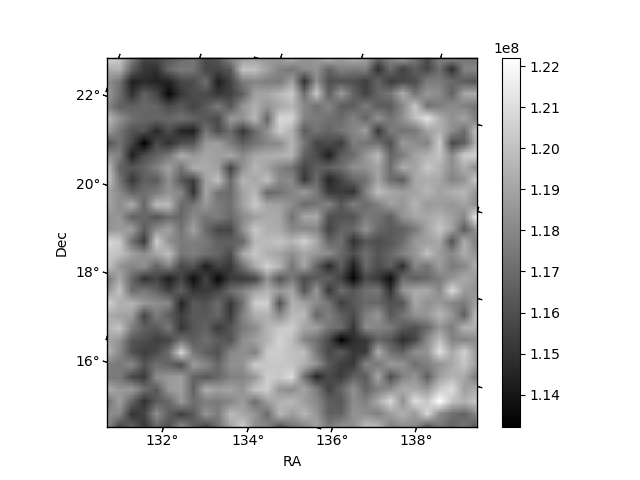
Histogram calculated using DETX and DETY for each event in the final _common_clean file
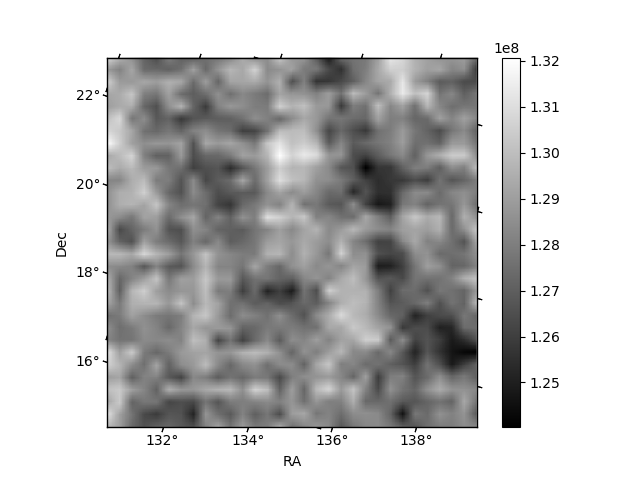
| Quadrant A | 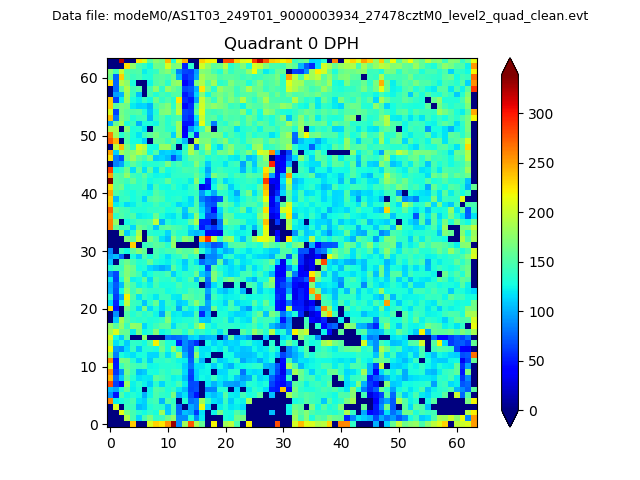 |
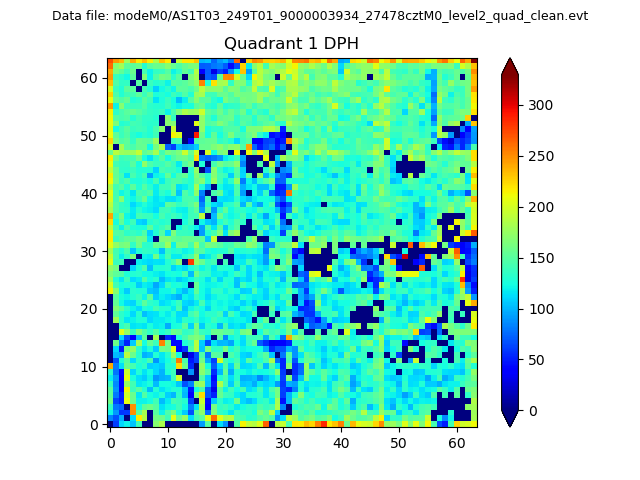 |
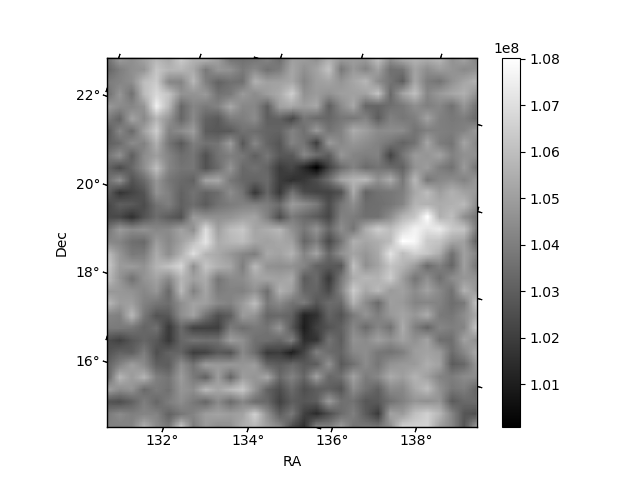
Quadrant B |
|---|---|---|---|
| Quadrant D | 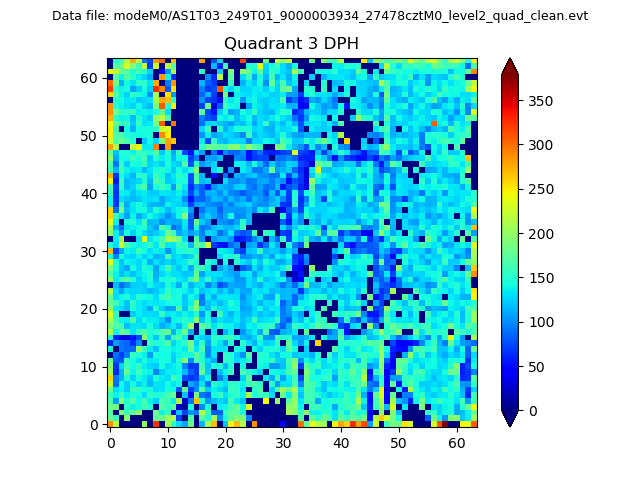 |
 |
Quadrant C |
| Plot type | Count rate plots | Images |
|---|---|---|
| Comparison with Poisson distribution Blue bars denote a histogram of data divided into 1 sec bins. Red curve is a Poisson curve with rate = median count rate of data. |
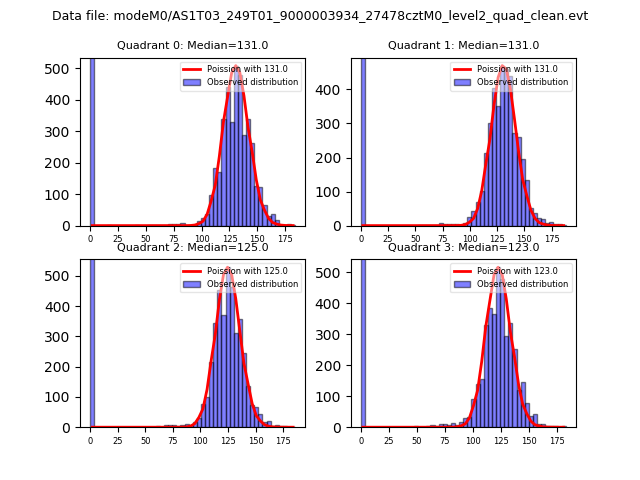 |
 |
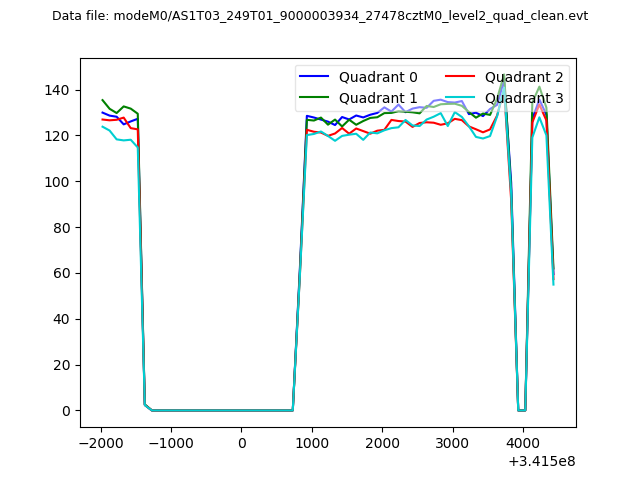
| Quadrant-wise count rates Data is divided into 100 sec bins |
 |
|
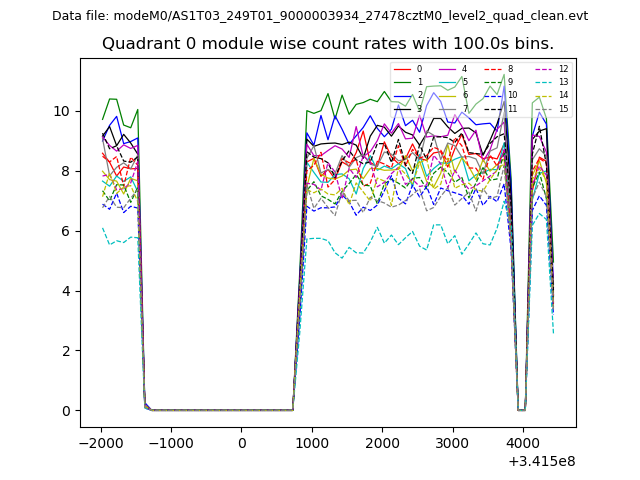
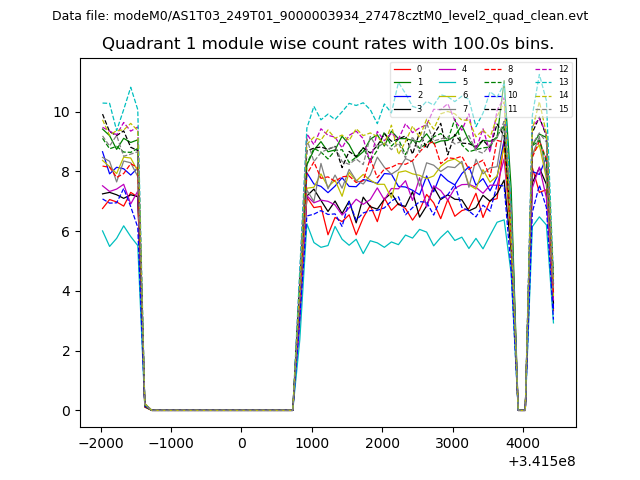
| Module-wise count rates for Quadrant A Data is divided into 100 sec bins |
 |
 |
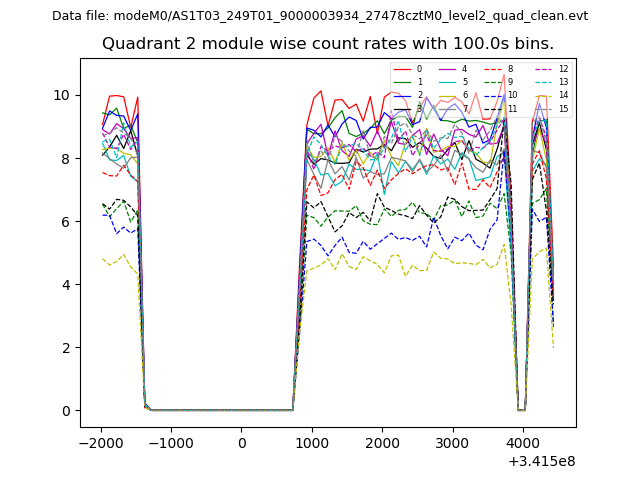
| Module-wise count rates for Quadrant B Data is divided into 100 sec bins |
 |
 |
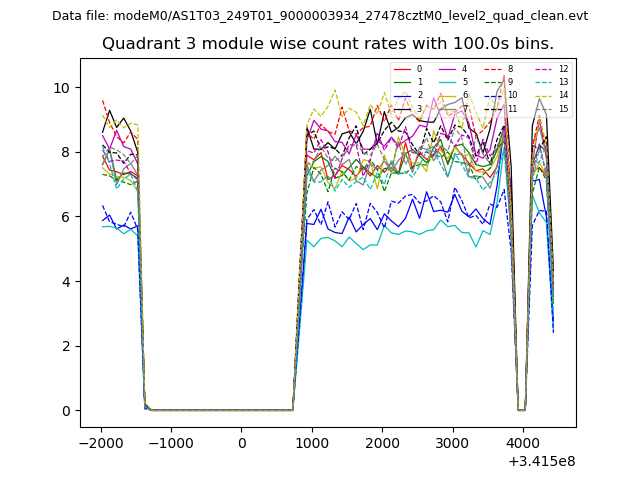
| Module-wise count rates for Quadrant C Data is divided into 100 sec bins |
 |
 |
| Module-wise count rates for Quadrant D Data is divided into 100 sec bins |
 |
 |
| Parameter | Plot |
|---|---|
| CZT HV Monitor | 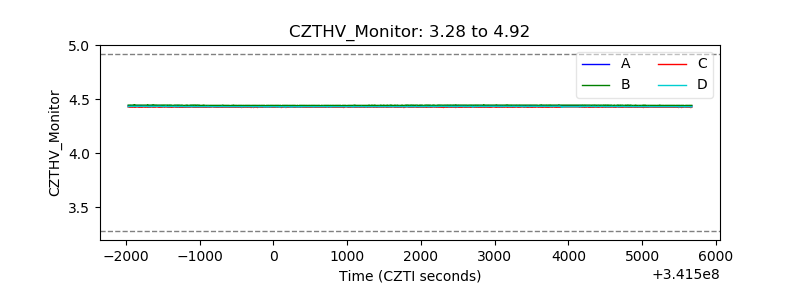 |
| D_VDD | 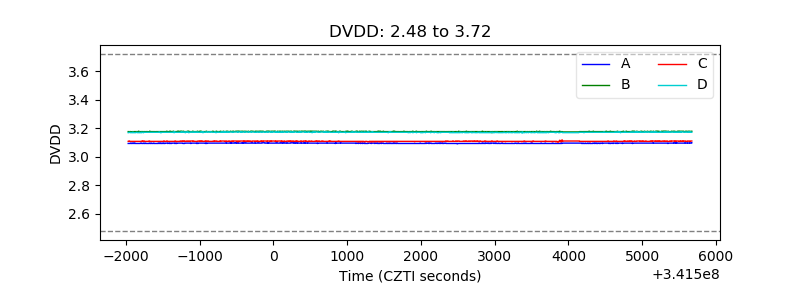 |
| Temperature 1 | 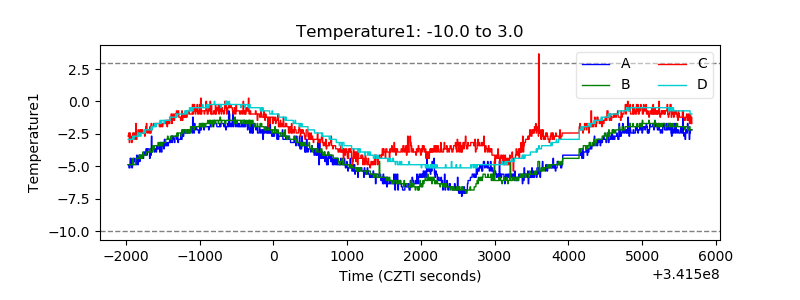 |
| Veto HV Monitor | 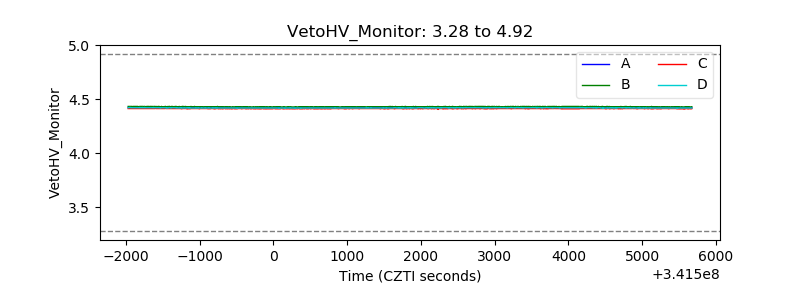 |
| Veto LLD | 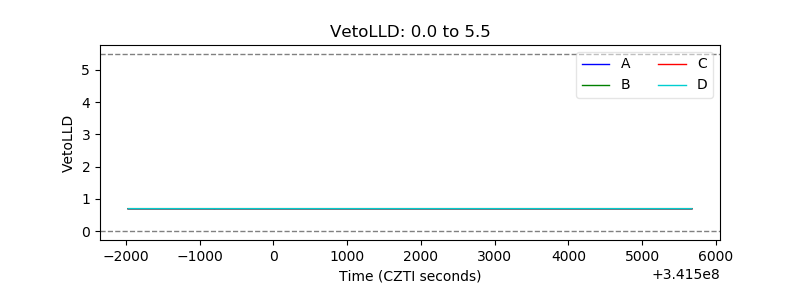 |
| Alpha Counter | 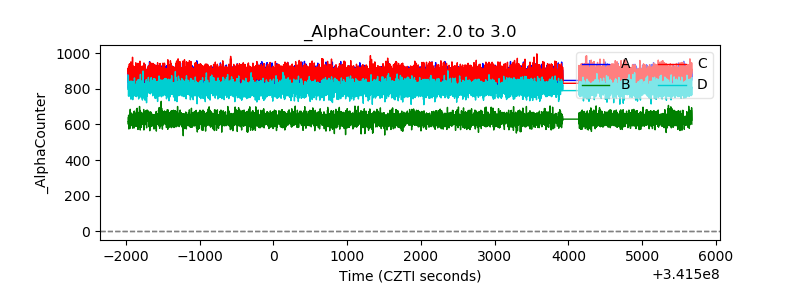 |
| _CPM_Rate | 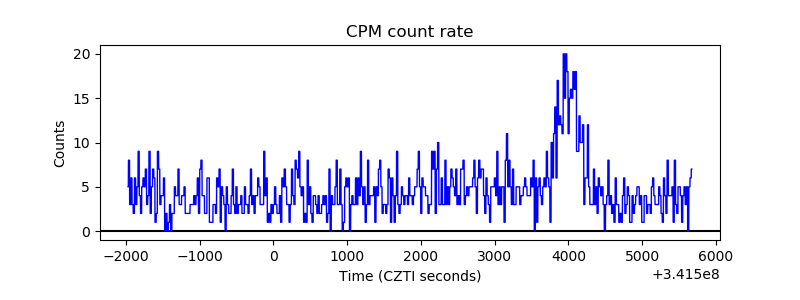 |
| CZT Counter | 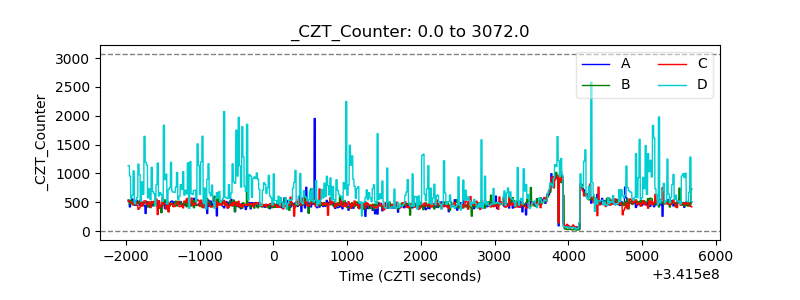 |
| +2.5 Volts monitor |  |
| +5 Volts monitor |  |
| _ROLL_ROT | 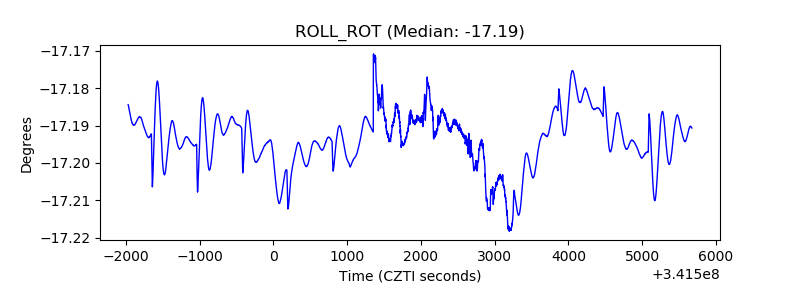 |
| _Roll_DEC | 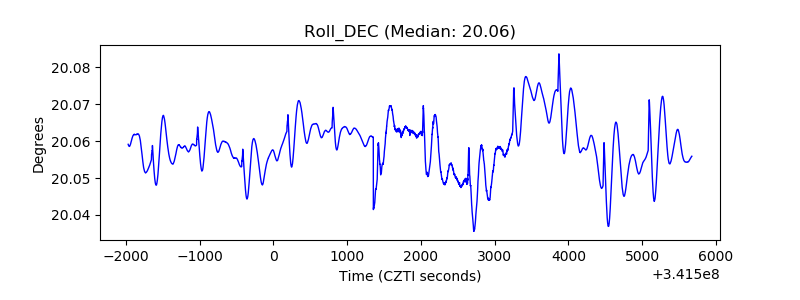 |
| _Roll_RA | 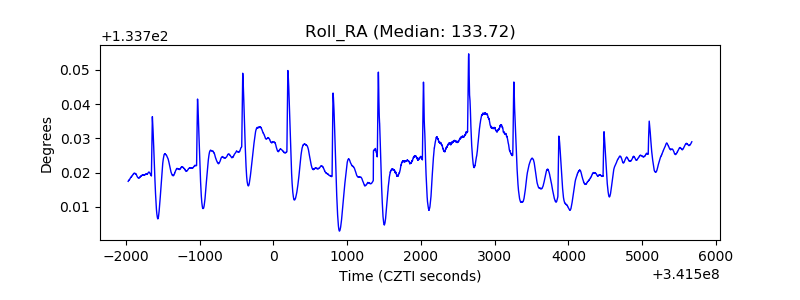 |
| Veto Counter |  |