| Param | Original file | Final file |
|---|---|---|
| Filename | modeM0/AS1T03_249T01_9000003934_27479cztM0_level2.evt | modeM0/AS1T03_249T01_9000003934_27479cztM0_level2_quad_clean.evt |
| Size (bytes) | 539,527,680 | 77,221,440 |
| Size | 514.5 MB | 73.6 MB |
| Events in quadrant A | 3,556,498 | 468,735 |
| Events in quadrant B | 3,766,667 | 464,650 |
| Events in quadrant C | 3,572,954 | 446,805 |
| Events in quadrant D | 4,941,620 | 443,263 |
| Mode M0 | |||
|---|---|---|---|
| Quadrant | BADHDUFLAG | Total packets | Discarded packets |
| A | 0 | 15220 | 0 |
| B | 0 | 15704 | 0 |
| C | 0 | 15236 | 0 |
| D | 0 | 19572 | 0 |
| Mode M9 | |||
|---|---|---|---|
| Quadrant | BADHDUFLAG | Total packets | Discarded packets |
| A | 0 | 3 | 0 |
| B | 0 | 3 | 0 |
| C | 0 | 3 | 0 |
| D | 0 | 3 | 0 |
| Quadrant | Total seconds | Saturated seconds | Saturation percentage |
|---|---|---|---|
| A | 7394 | 95 | 1.284826% |
| B | 7395 | 127 | 1.717377% |
| C | 7395 | 132 | 1.784990% |
| D | 7395 | 207 | 2.799189% |
Noise dominated data is calculated using 1-second bins in cleaned event files. If a bin has >2000 counts, and if more than 50% of those come from <1% of pixels, then it is considered to be noise-dominated and hence unusable.
| Quadrant | # 1 sec bins | Bins with >0 counts | Bins with >2000 counts | High rate bins dominated by noise | Noise dominated (total time) | Noise dominated (detector-on time) | Marked lightcurve |
|---|---|---|---|---|---|---|---|
| A | 7749 | 7394 | 0 | 0 | 0.00% | 0.00% |  |
| B | 7750 | 7395 | 22 | 22 | 0.28% | 0.30% | 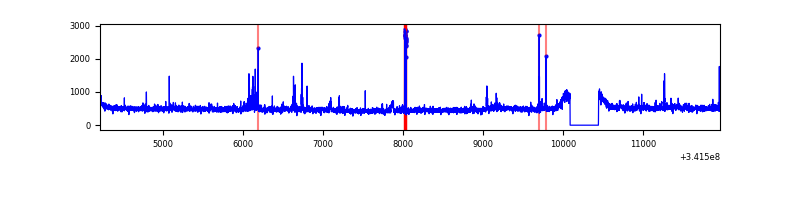 |
| C | 7750 | 7395 | 1 | 1 | 0.01% | 0.01% | 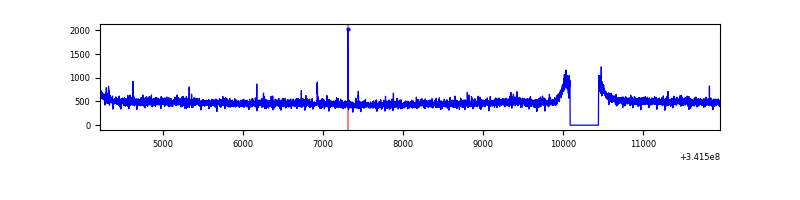 |
| D | 7750 | 7395 | 120 | 120 | 1.55% | 1.62% | 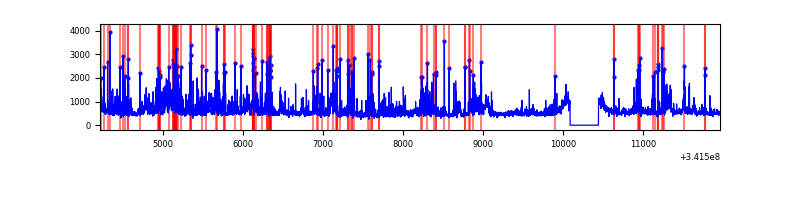 |
Top three noisy pixels from each quadrant. If the there are fewer than three noisy pixels in the level2.evt file, extra rows are filled as -1
| Pixel properties | Quadrant properties | ||||||
|---|---|---|---|---|---|---|---|
| Quadrant | DetID | PixID | Counts | Sigma | Mean | Median | Sigma |
| A | 13 | 254 | 11927 | 59.07 | 920 | 900 | 186.7 |
| A | 3 | 137 | 8910 | 42.91 | 920 | 900 | 186.7 |
| A | 0 | 226 | 7962 | 37.83 | 920 | 900 | 186.7 |
| B | 3 | 64 | 142603 | 803.13 | 905 | 884 | 176.5 |
| B | 0 | 230 | 28166 | 154.61 | 905 | 884 | 176.5 |
| B | 12 | 111 | 22068 | 120.05 | 905 | 884 | 176.5 |
| C | 14 | 238 | 140693 | 672.35 | 877 | 882 | 207.9 |
| C | 2 | 16 | 8736 | 37.77 | 877 | 882 | 207.9 |
| C | 10 | 22 | 6667 | 27.82 | 877 | 882 | 207.9 |
| D | 1 | 52 | 1286027 | 6005.92 | 887 | 861 | 214.0 |
| D | 14 | 35 | 111049 | 514.94 | 887 | 861 | 214.0 |
| D | 2 | 250 | 110028 | 510.16 | 887 | 861 | 214.0 |
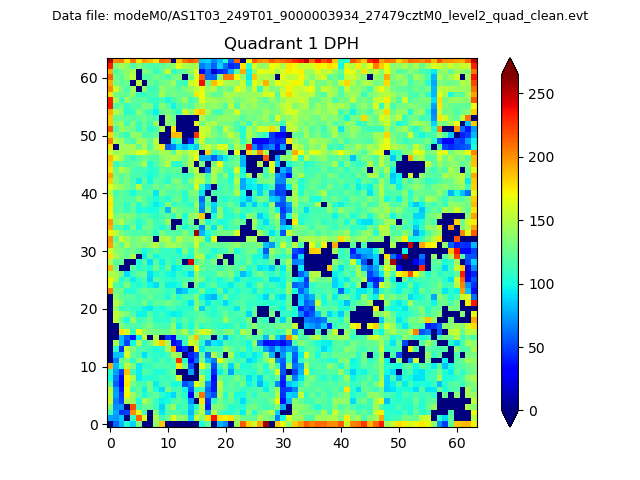
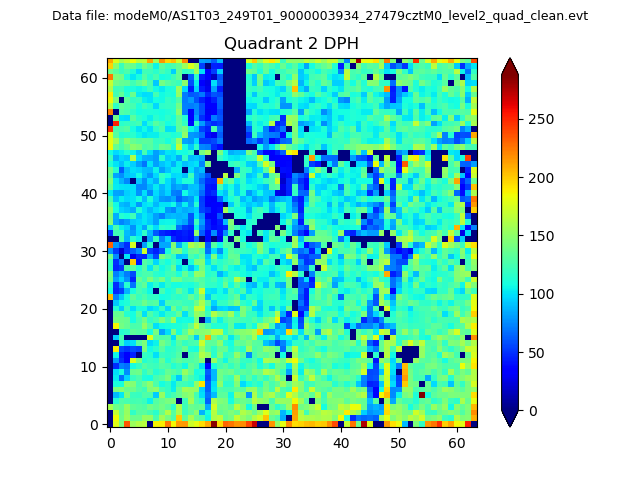
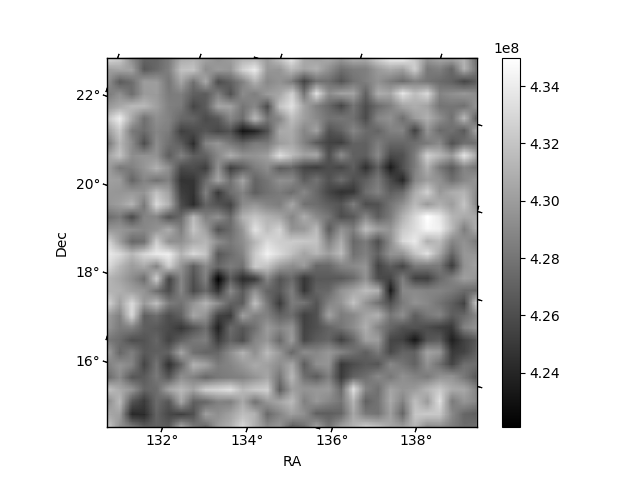
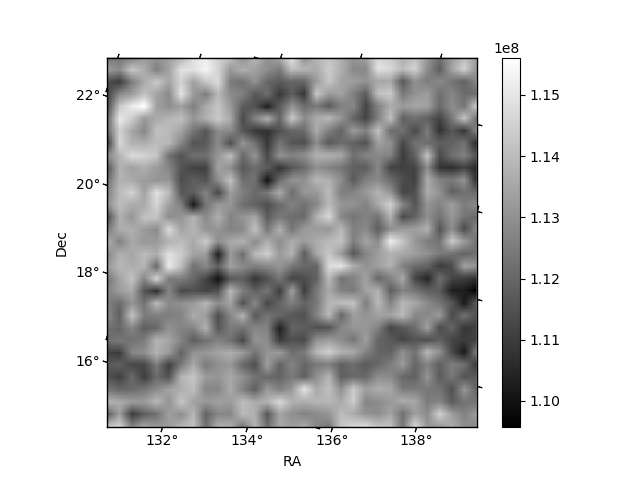
Histogram calculated using DETX and DETY for each event in the final _common_clean file
| Quadrant A | 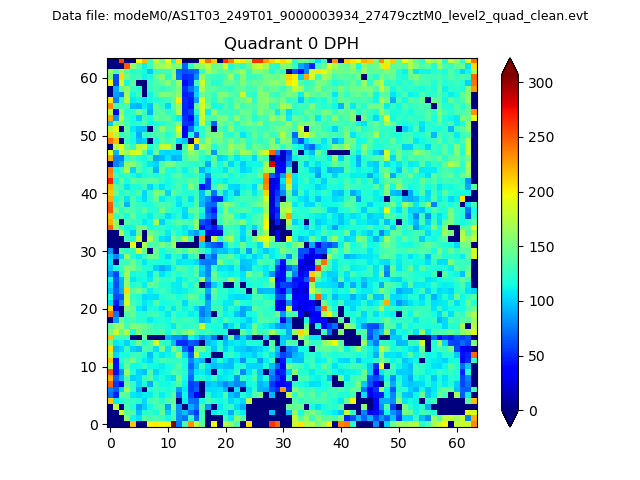 |
 |
Quadrant B |
|---|---|---|---|
| Quadrant D | 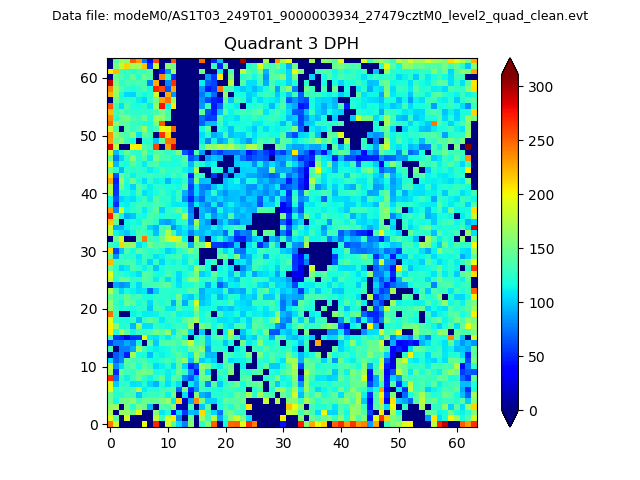 |
 |
Quadrant C |
| Plot type | Count rate plots | Images |
|---|---|---|
| Comparison with Poisson distribution Blue bars denote a histogram of data divided into 1 sec bins. Red curve is a Poisson curve with rate = median count rate of data. |
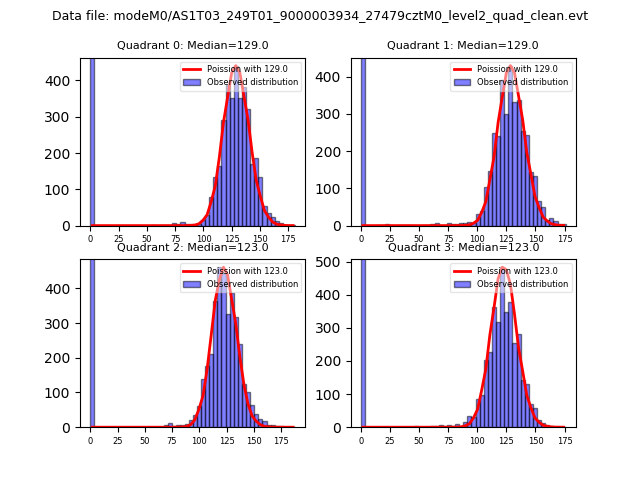 |
 |
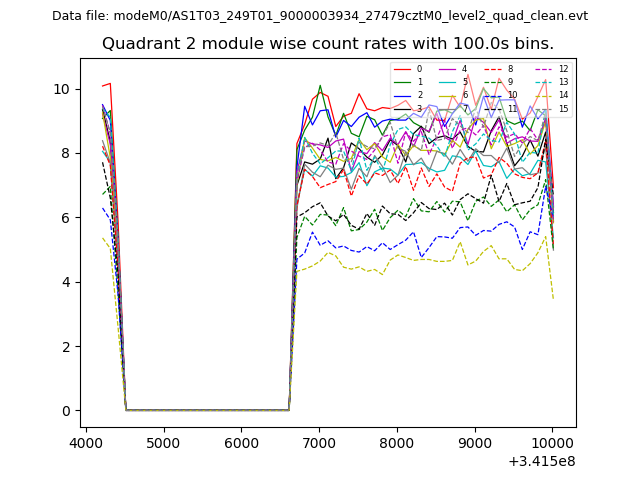
| Quadrant-wise count rates Data is divided into 100 sec bins |
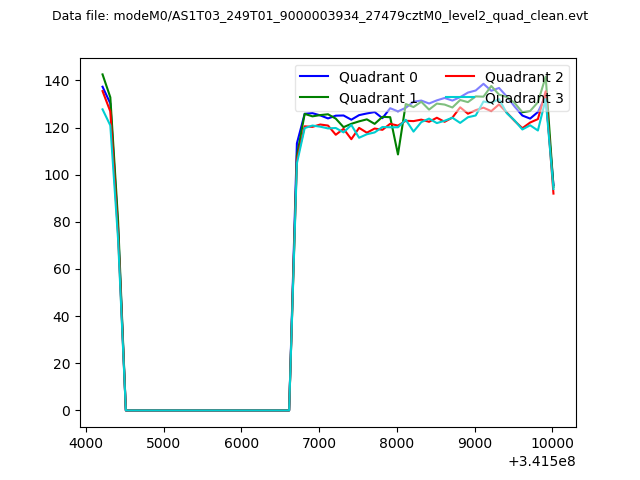 |
|
| Module-wise count rates for Quadrant A Data is divided into 100 sec bins |
 |
 |
| Module-wise count rates for Quadrant B Data is divided into 100 sec bins |
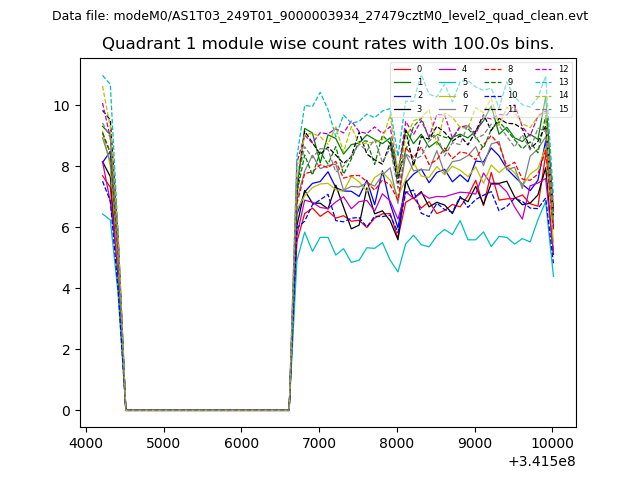 |
 |
| Module-wise count rates for Quadrant C Data is divided into 100 sec bins |
 |
 |
| Module-wise count rates for Quadrant D Data is divided into 100 sec bins |
 |
 |
| Parameter | Plot |
|---|---|
| CZT HV Monitor |  |
| D_VDD | 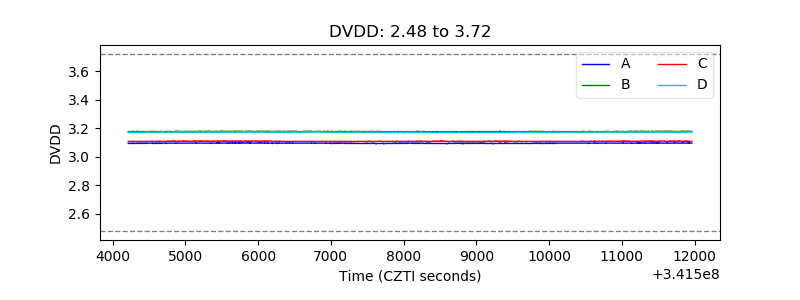 |
| Temperature 1 | 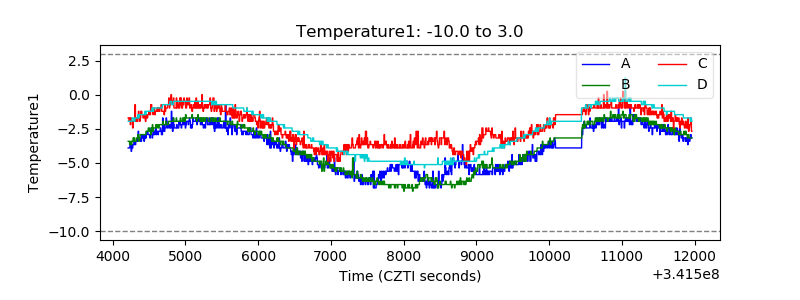 |
| Veto HV Monitor | 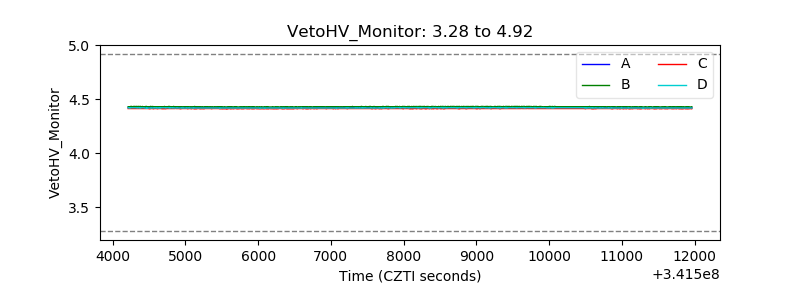 |
| Veto LLD | 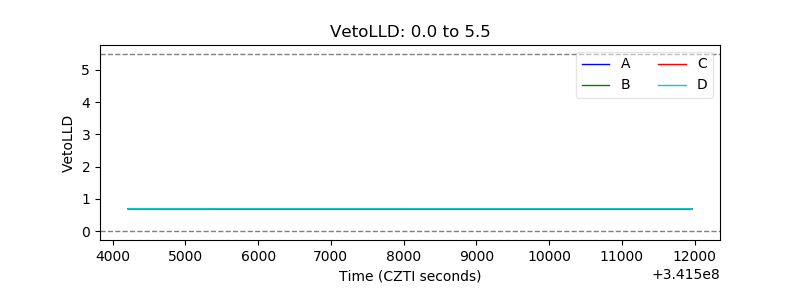 |
| Alpha Counter | 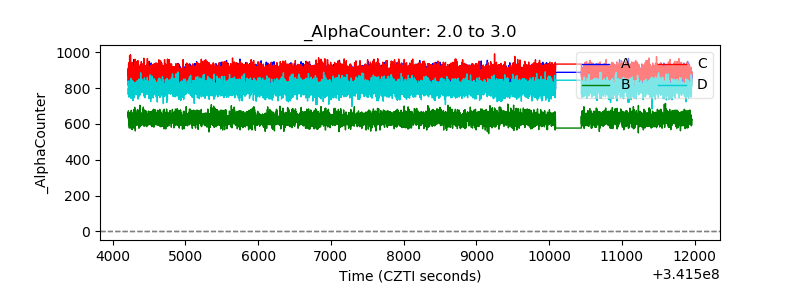 |
| _CPM_Rate | 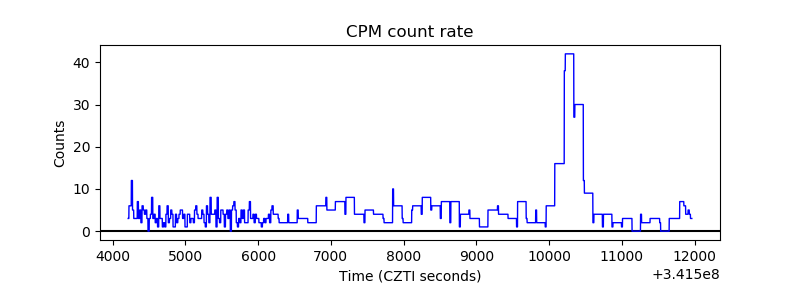 |
| CZT Counter | 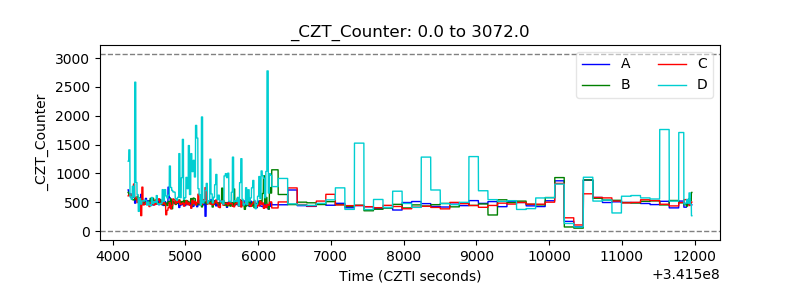 |
| +2.5 Volts monitor |  |
| +5 Volts monitor |  |
| _ROLL_ROT |  |
| _Roll_DEC | 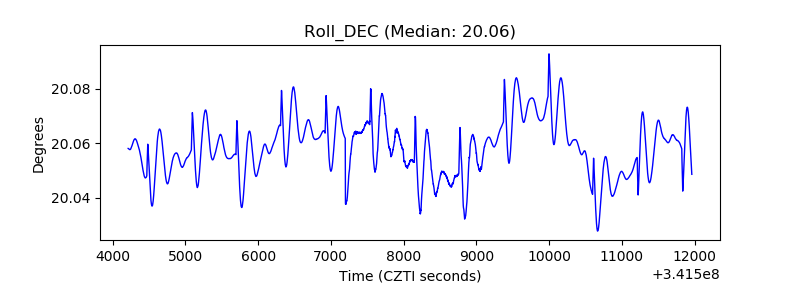 |
| _Roll_RA | 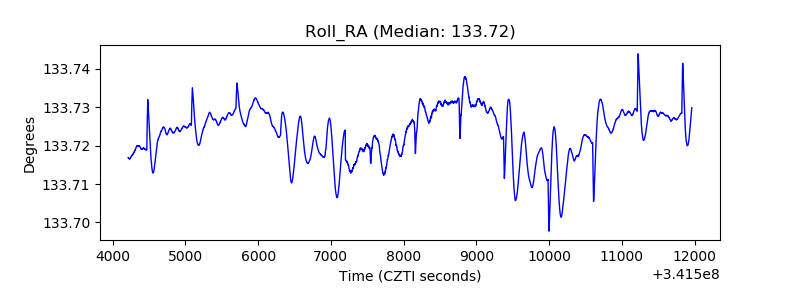 |
| Veto Counter | 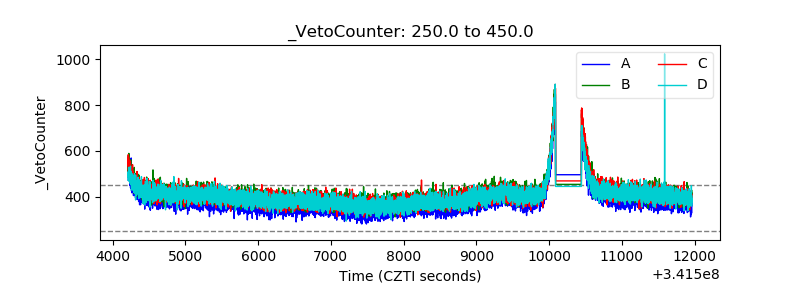 |