| Param | Original file | Final file |
|---|---|---|
| Filename | modeM0/AS1T03_249T01_9000003934_27485cztM0_level2.evt | modeM0/AS1T03_249T01_9000003934_27485cztM0_level2_quad_clean.evt |
| Size (bytes) | 449,576,640 | 103,242,240 |
| Size | 428.7 MB | 98.5 MB |
| Events in quadrant A | 3,140,515 | 686,679 |
| Events in quadrant B | 3,254,529 | 700,961 |
| Events in quadrant C | 3,418,732 | 654,067 |
| Events in quadrant D | 3,372,107 | 643,839 |
| Mode M0 | |||
|---|---|---|---|
| Quadrant | BADHDUFLAG | Total packets | Discarded packets |
| A | 0 | 13430 | 0 |
| B | 0 | 13798 | 0 |
| C | 0 | 14187 | 0 |
| D | 0 | 14437 | 0 |
| Mode M9 | |||
|---|---|---|---|
| Quadrant | BADHDUFLAG | Total packets | Discarded packets |
| A | 0 | 23 | 0 |
| B | 0 | 23 | 0 |
| C | 0 | 23 | 0 |
| D | 0 | 23 | 0 |
| Quadrant | Total seconds | Saturated seconds | Saturation percentage |
|---|---|---|---|
| A | 6333 | 49 | 0.773725% |
| B | 6333 | 53 | 0.836886% |
| C | 6333 | 99 | 1.563240% |
| D | 6333 | 57 | 0.900047% |
Noise dominated data is calculated using 1-second bins in cleaned event files. If a bin has >2000 counts, and if more than 50% of those come from <1% of pixels, then it is considered to be noise-dominated and hence unusable.
| Quadrant | # 1 sec bins | Bins with >0 counts | Bins with >2000 counts | High rate bins dominated by noise | Noise dominated (total time) | Noise dominated (detector-on time) | Marked lightcurve |
|---|---|---|---|---|---|---|---|
| A | 8558 | 6334 | 5 | 5 | 0.06% | 0.08% | 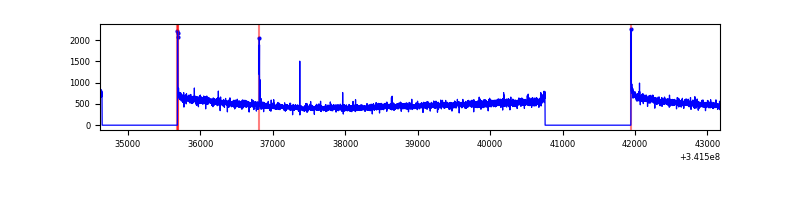 |
| B | 8558 | 6333 | 4 | 4 | 0.05% | 0.06% | 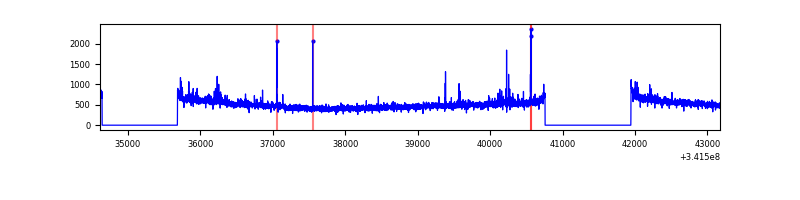 |
| C | 8558 | 6334 | 7 | 7 | 0.08% | 0.11% | 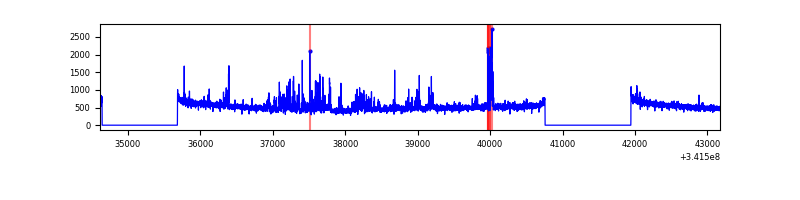 |
| D | 8558 | 6334 | 26 | 26 | 0.30% | 0.41% | 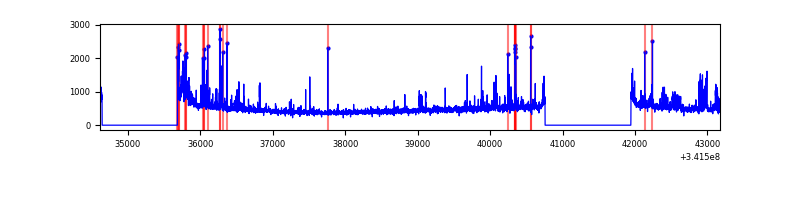 |
Top three noisy pixels from each quadrant. If the there are fewer than three noisy pixels in the level2.evt file, extra rows are filled as -1
| Pixel properties | Quadrant properties | ||||||
|---|---|---|---|---|---|---|---|
| Quadrant | DetID | PixID | Counts | Sigma | Mean | Median | Sigma |
| A | 8 | 192 | 12192 | 70.45 | 808 | 793 | 161.8 |
| A | 13 | 254 | 10837 | 62.08 | 808 | 793 | 161.8 |
| A | 5 | 168 | 8507 | 47.68 | 808 | 793 | 161.8 |
| B | 3 | 64 | 37393 | 241.04 | 810 | 792 | 151.8 |
| B | 12 | 111 | 18599 | 117.27 | 810 | 792 | 151.8 |
| B | 11 | 111 | 16710 | 104.83 | 810 | 792 | 151.8 |
| C | 15 | 208 | 245276 | 1343.45 | 775 | 779 | 182.0 |
| C | 14 | 238 | 125314 | 684.29 | 775 | 779 | 182.0 |
| C | 10 | 22 | 13421 | 69.46 | 775 | 779 | 182.0 |
| D | 1 | 52 | 232251 | 1248.93 | 774 | 754 | 185.4 |
| D | 2 | 250 | 90766 | 485.62 | 774 | 754 | 185.4 |
| D | 12 | 227 | 80657 | 431.08 | 774 | 754 | 185.4 |
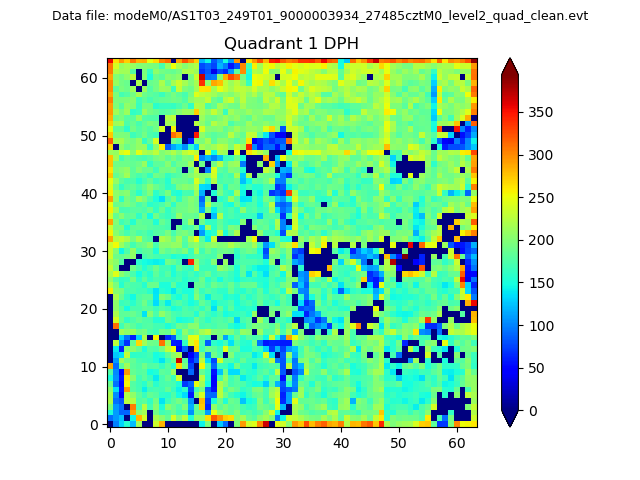
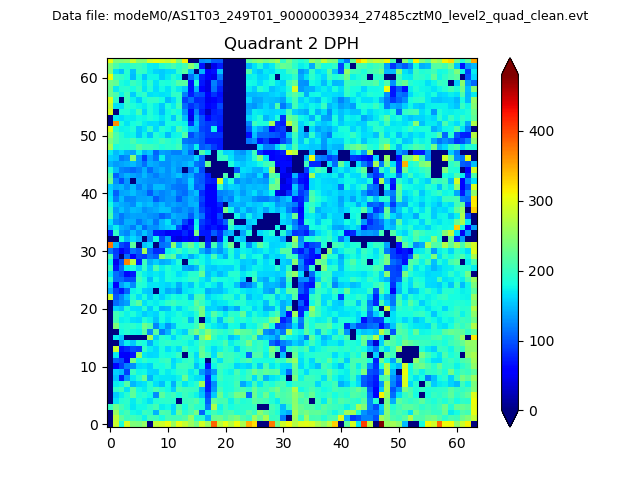
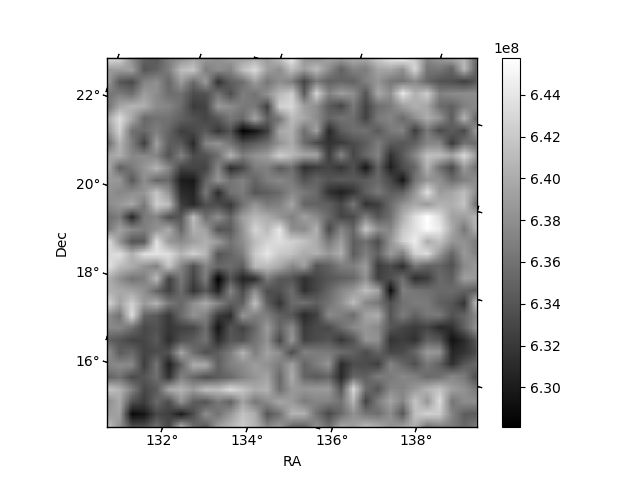
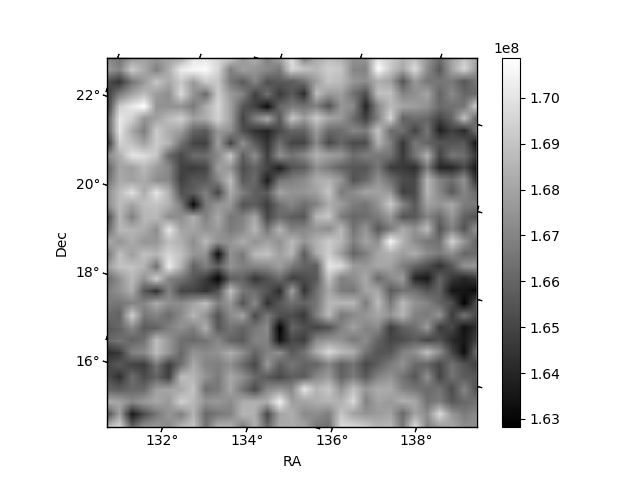
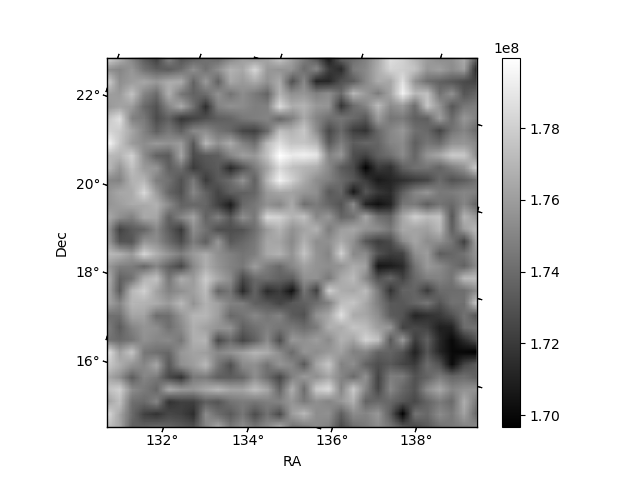
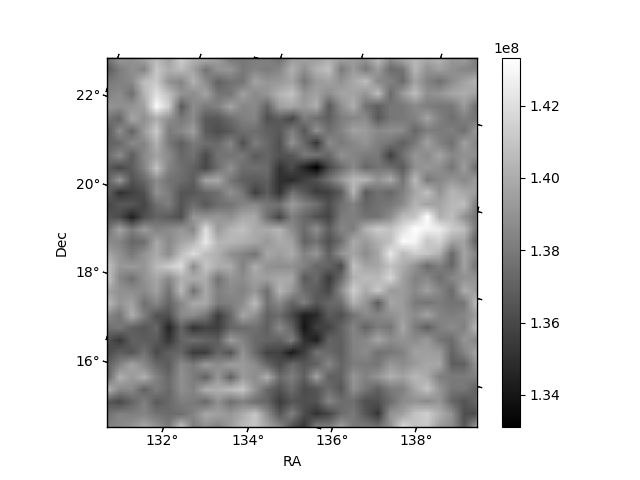
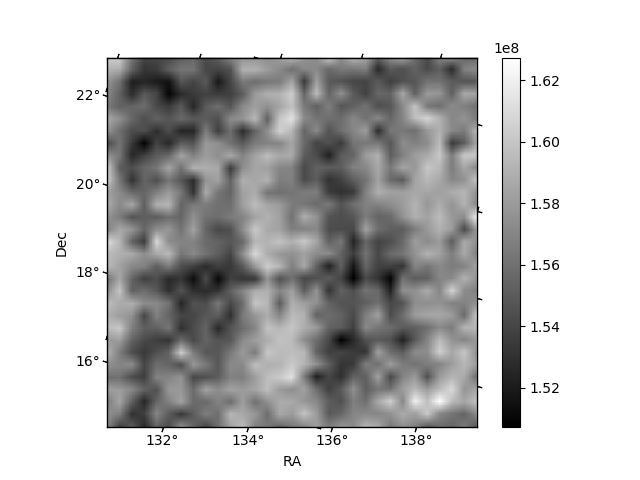
Histogram calculated using DETX and DETY for each event in the final _common_clean file
| Quadrant A |  |
 |
Quadrant B |
|---|---|---|---|
| Quadrant D | 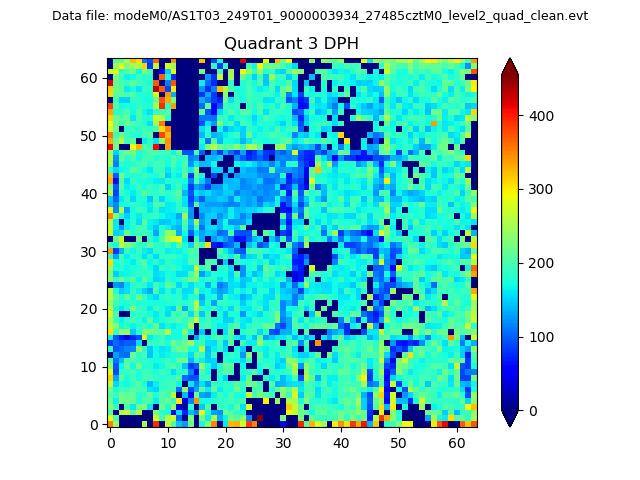 |
 |
Quadrant C |
| Plot type | Count rate plots | Images |
|---|---|---|
| Comparison with Poisson distribution Blue bars denote a histogram of data divided into 1 sec bins. Red curve is a Poisson curve with rate = median count rate of data. |
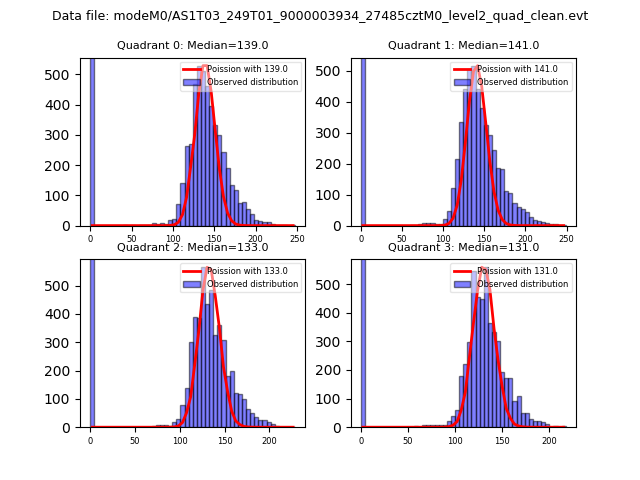 |
 |
| Quadrant-wise count rates Data is divided into 100 sec bins |
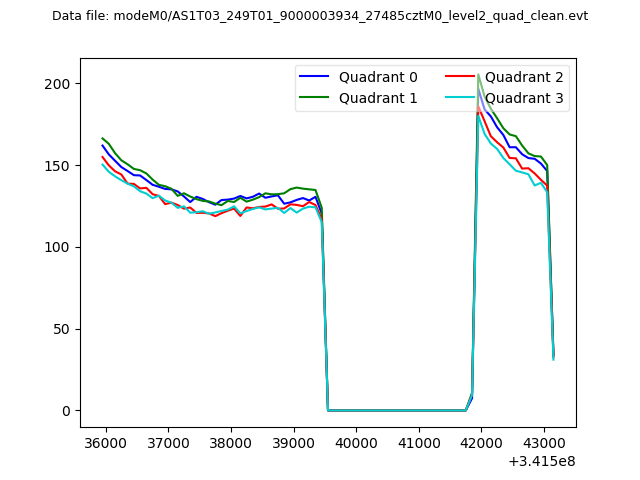 |
|
| Module-wise count rates for Quadrant A Data is divided into 100 sec bins |
 |
 |
| Module-wise count rates for Quadrant B Data is divided into 100 sec bins |
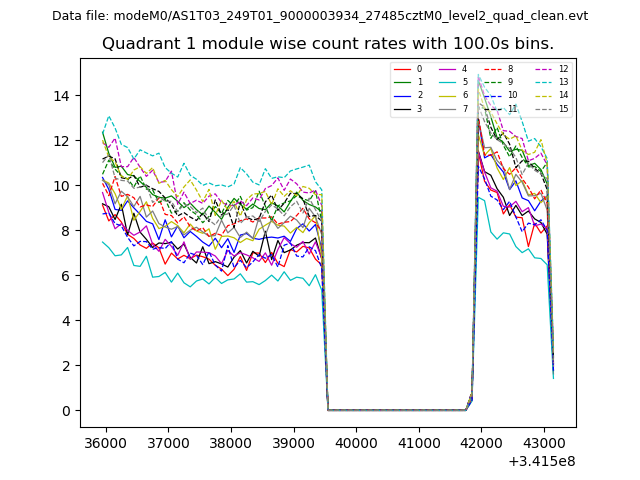 |
 |
| Module-wise count rates for Quadrant C Data is divided into 100 sec bins |
 |
 |
| Module-wise count rates for Quadrant D Data is divided into 100 sec bins |
 |
 |
| Parameter | Plot |
|---|---|
| CZT HV Monitor | 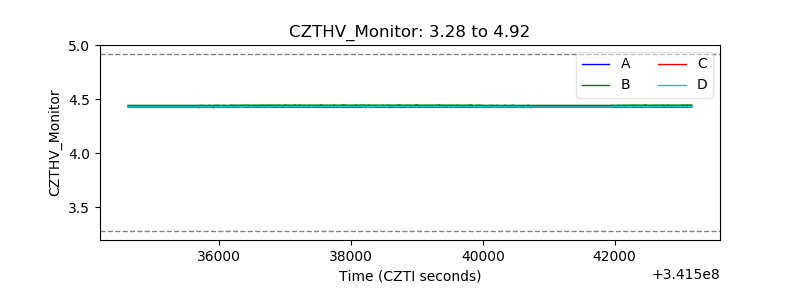 |
| D_VDD | 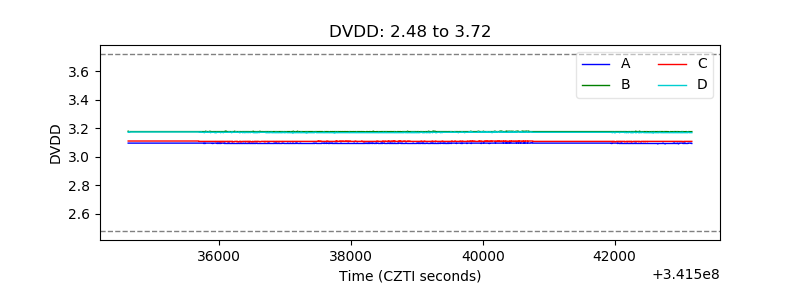 |
| Temperature 1 | 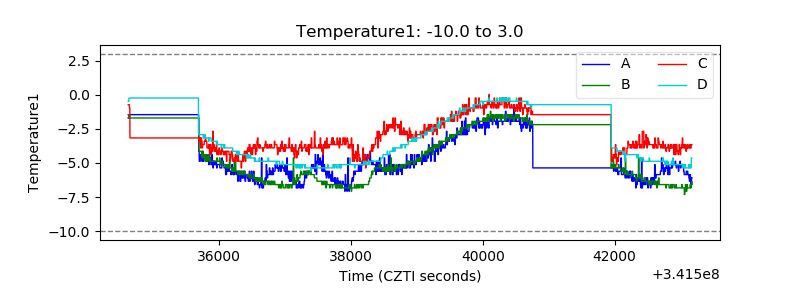 |
| Veto HV Monitor |  |
| Veto LLD | 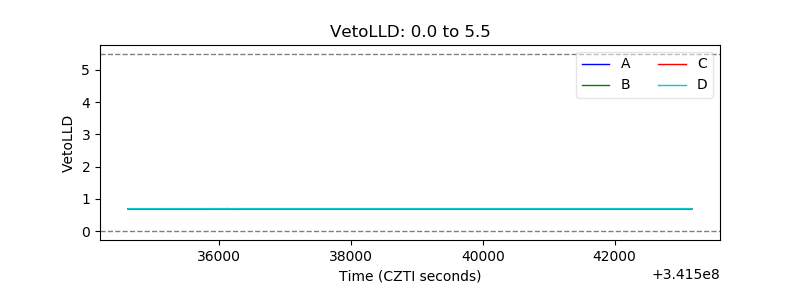 |
| Alpha Counter | 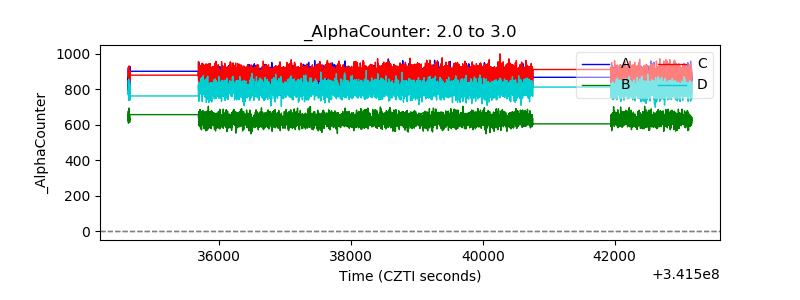 |
| _CPM_Rate | 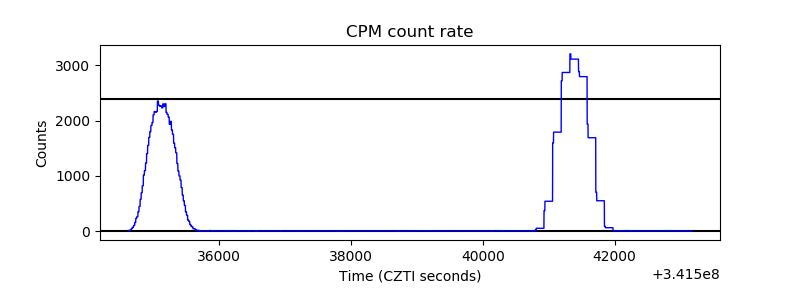 |
| CZT Counter | 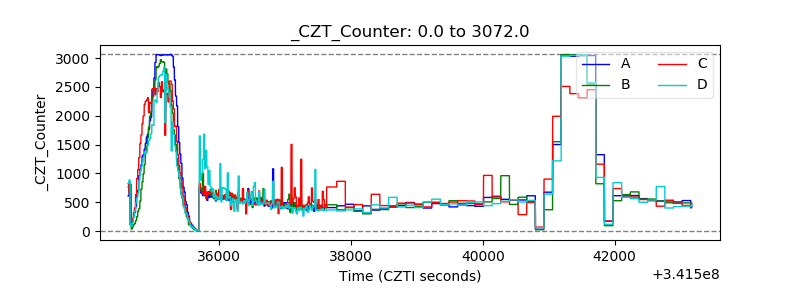 |
| +2.5 Volts monitor | 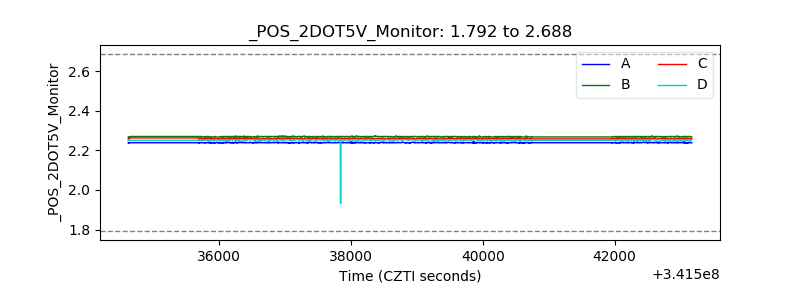 |
| +5 Volts monitor |  |
| _ROLL_ROT | 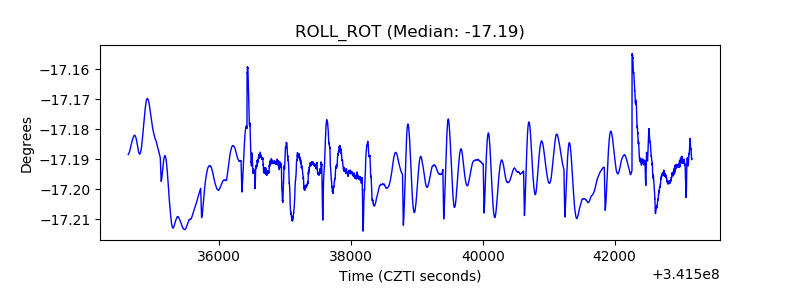 |
| _Roll_DEC |  |
| _Roll_RA | 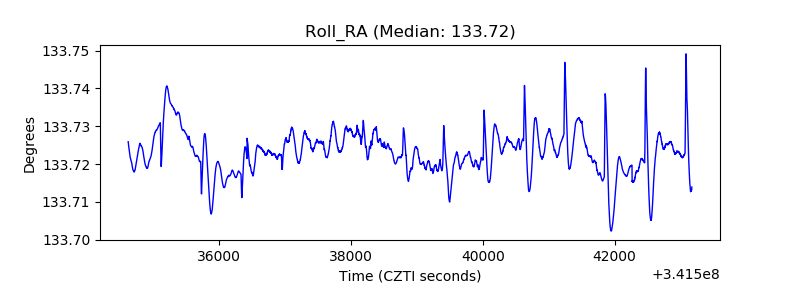 |
| Veto Counter | 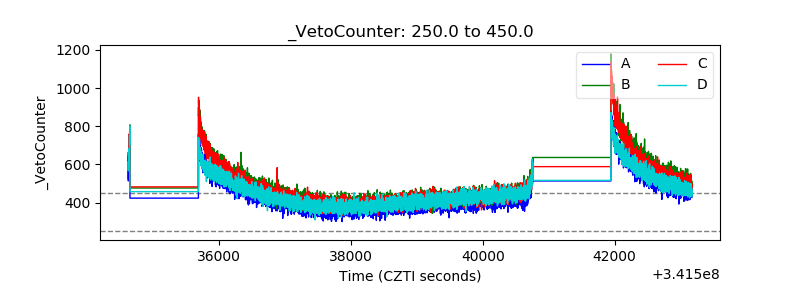 |