| Param | Original file | Final file |
|---|---|---|
| Filename | modeM0/AS1T03_249T01_9000003934_27486cztM0_level2.evt | modeM0/AS1T03_249T01_9000003934_27486cztM0_level2_quad_clean.evt |
| Size (bytes) | 492,603,840 | 114,197,760 |
| Size | 469.8 MB | 108.9 MB |
| Events in quadrant A | 3,330,338 | 768,454 |
| Events in quadrant B | 3,639,908 | 789,161 |
| Events in quadrant C | 3,442,342 | 733,723 |
| Events in quadrant D | 4,058,601 | 707,714 |
| Mode M0 | |||
|---|---|---|---|
| Quadrant | BADHDUFLAG | Total packets | Discarded packets |
| A | 0 | 14002 | 0 |
| B | 0 | 15000 | 0 |
| C | 0 | 14375 | 0 |
| D | 0 | 16451 | 0 |
| Mode M9 | |||
|---|---|---|---|
| Quadrant | BADHDUFLAG | Total packets | Discarded packets |
| A | 0 | 14 | 0 |
| B | 0 | 15 | 0 |
| C | 0 | 15 | 0 |
| D | 0 | 15 | 0 |
| Quadrant | Total seconds | Saturated seconds | Saturation percentage |
|---|---|---|---|
| A | 6591 | 36 | 0.546199% |
| B | 6591 | 60 | 0.910332% |
| C | 6591 | 75 | 1.137915% |
| D | 6591 | 122 | 1.851009% |
Noise dominated data is calculated using 1-second bins in cleaned event files. If a bin has >2000 counts, and if more than 50% of those come from <1% of pixels, then it is considered to be noise-dominated and hence unusable.
| Quadrant | # 1 sec bins | Bins with >0 counts | Bins with >2000 counts | High rate bins dominated by noise | Noise dominated (total time) | Noise dominated (detector-on time) | Marked lightcurve |
|---|---|---|---|---|---|---|---|
| A | 7856 | 6592 | 3 | 3 | 0.04% | 0.05% | 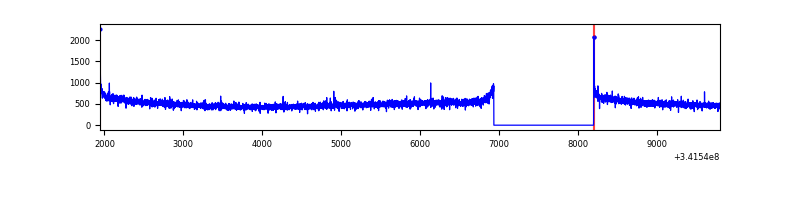 |
| B | 7856 | 6591 | 0 | 0 | 0.00% | 0.00% | 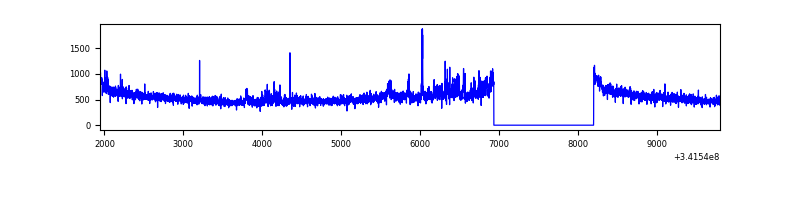 |
| C | 7856 | 6592 | 3 | 3 | 0.04% | 0.05% | 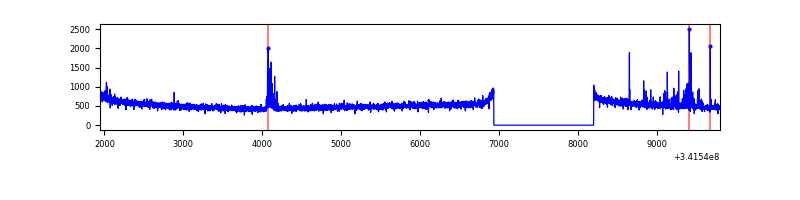 |
| D | 7856 | 6591 | 115 | 115 | 1.46% | 1.74% | 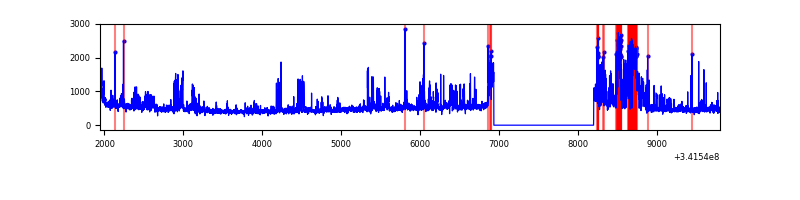 |
Top three noisy pixels from each quadrant. If the there are fewer than three noisy pixels in the level2.evt file, extra rows are filled as -1
| Pixel properties | Quadrant properties | ||||||
|---|---|---|---|---|---|---|---|
| Quadrant | DetID | PixID | Counts | Sigma | Mean | Median | Sigma |
| A | 13 | 254 | 10336 | 55.71 | 859 | 843 | 170.4 |
| A | 8 | 192 | 10239 | 55.14 | 859 | 843 | 170.4 |
| A | 3 | 137 | 7770 | 40.65 | 859 | 843 | 170.4 |
| B | 0 | 189 | 181217 | 1119.52 | 863 | 844 | 161.1 |
| B | 3 | 64 | 52194 | 318.71 | 863 | 844 | 161.1 |
| B | 15 | 32 | 21414 | 127.67 | 863 | 844 | 161.1 |
| C | 14 | 238 | 134632 | 698.11 | 823 | 832 | 191.7 |
| C | 15 | 208 | 94520 | 488.83 | 823 | 832 | 191.7 |
| C | 13 | 61 | 5677 | 25.28 | 823 | 832 | 191.7 |
| D | 1 | 52 | 895415 | 4638.28 | 815 | 793 | 192.9 |
| D | 2 | 250 | 54320 | 277.52 | 815 | 793 | 192.9 |
| D | 2 | 234 | 25405 | 127.6 | 815 | 793 | 192.9 |
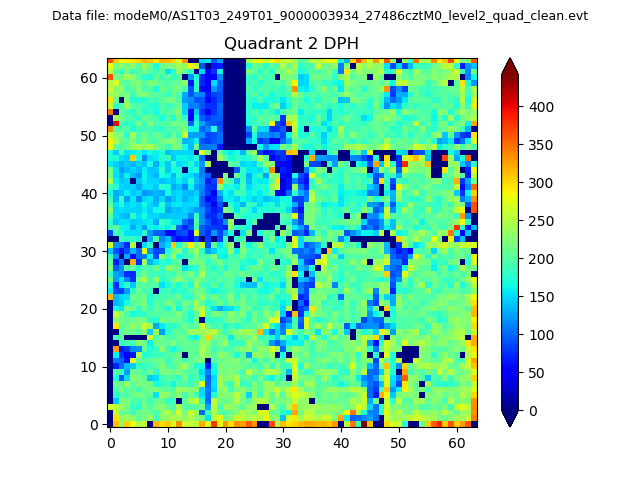
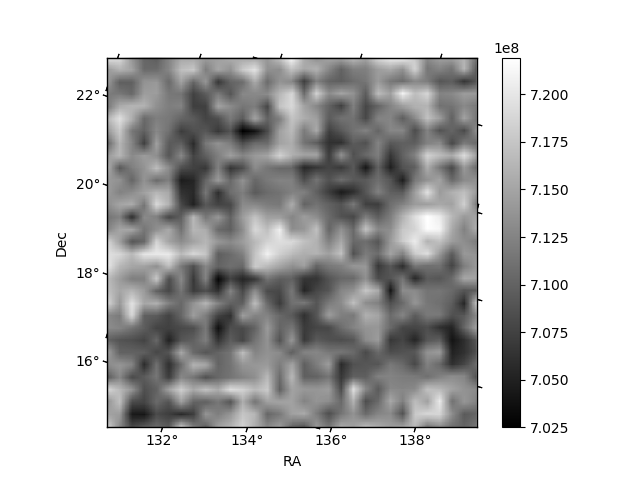
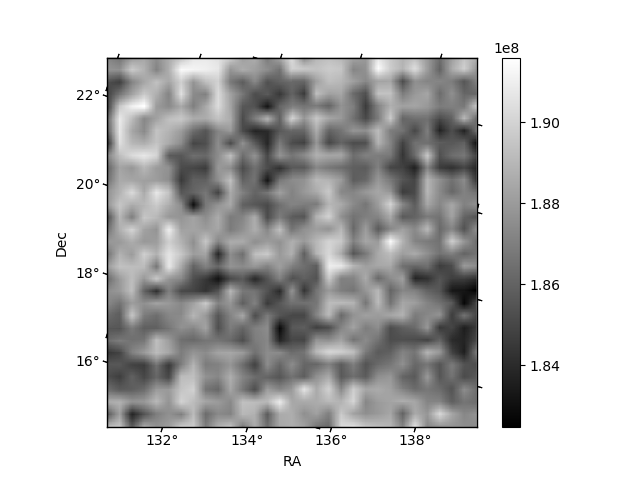
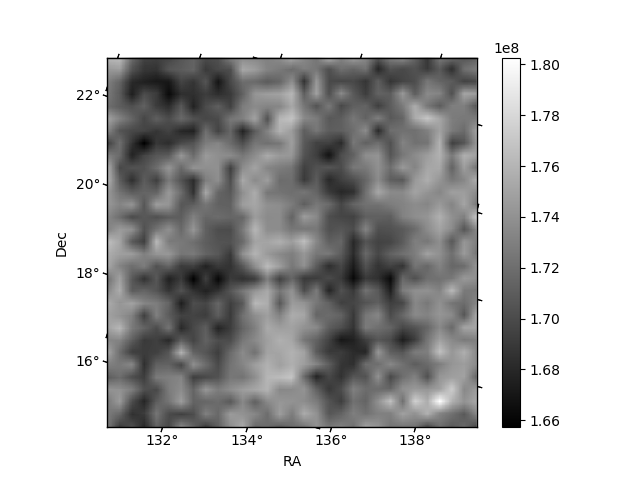
Histogram calculated using DETX and DETY for each event in the final _common_clean file
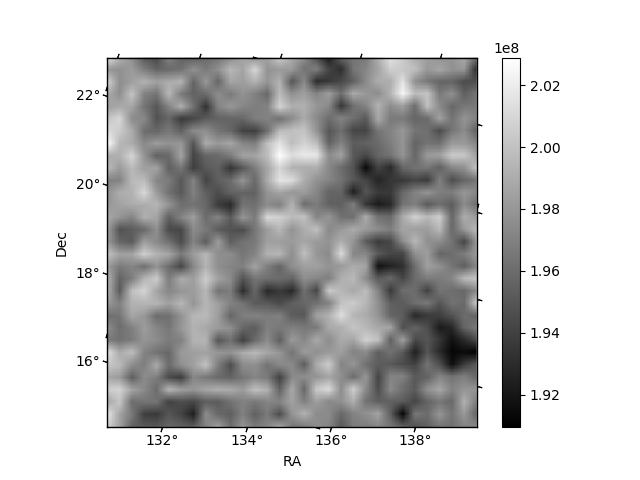
| Quadrant A | 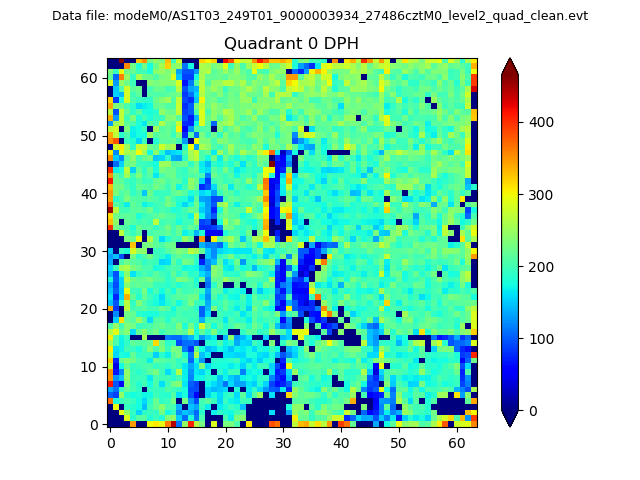 |
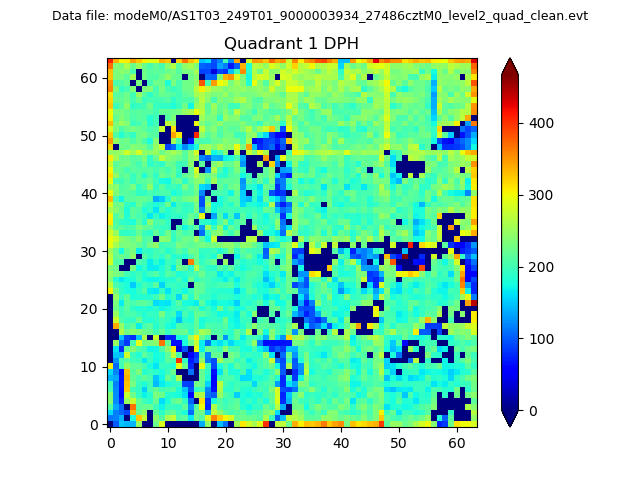 |
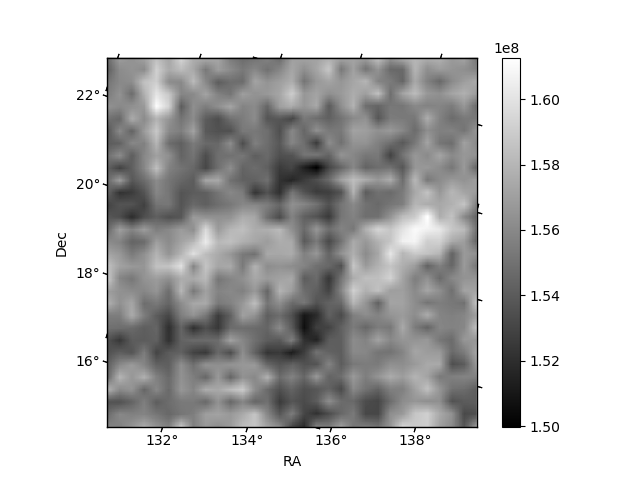
Quadrant B |
|---|---|---|---|
| Quadrant D | 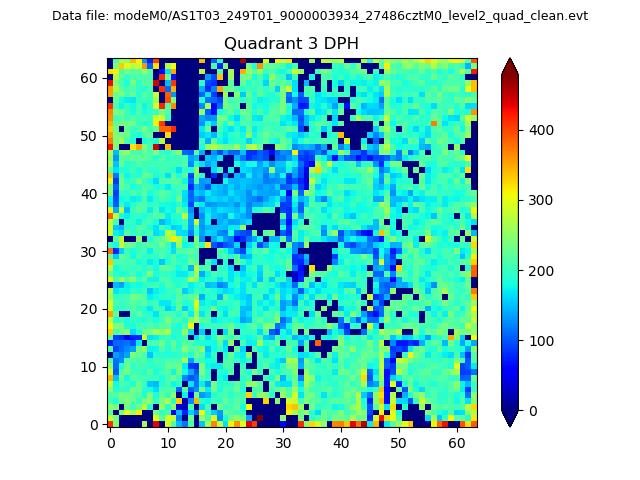 |
 |
Quadrant C |
| Plot type | Count rate plots | Images |
|---|---|---|
| Comparison with Poisson distribution Blue bars denote a histogram of data divided into 1 sec bins. Red curve is a Poisson curve with rate = median count rate of data. |
 |
 |
| Quadrant-wise count rates Data is divided into 100 sec bins |
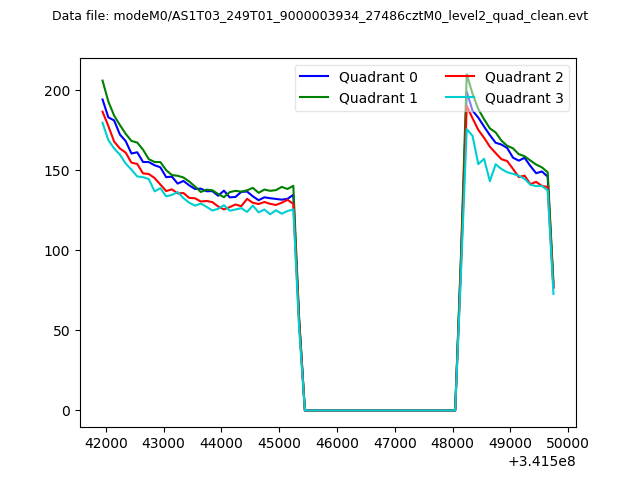 |
|
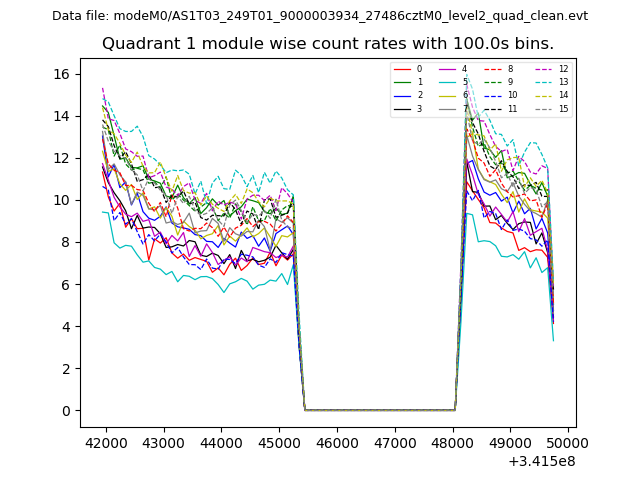
| Module-wise count rates for Quadrant A Data is divided into 100 sec bins |
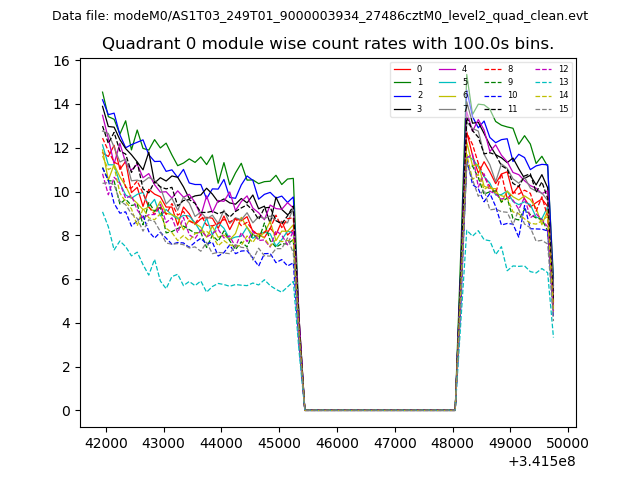 |
 |
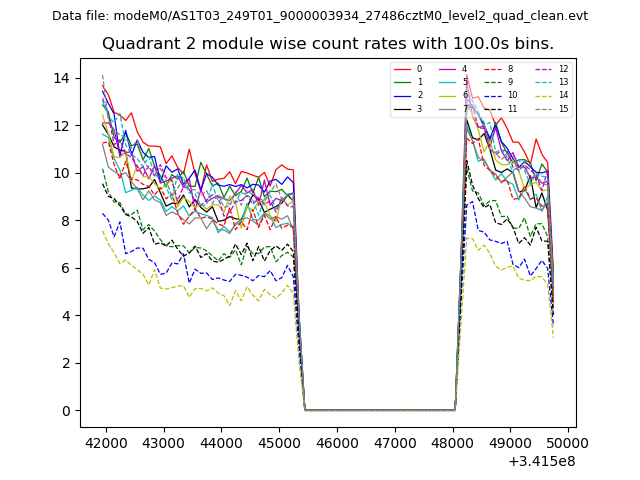
| Module-wise count rates for Quadrant B Data is divided into 100 sec bins |
 |
 |
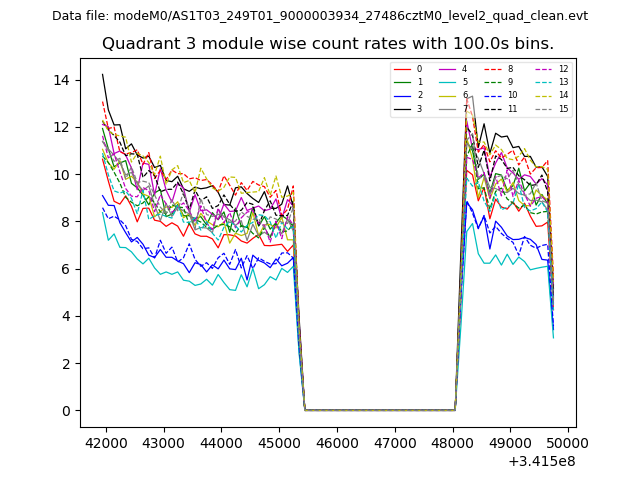
| Module-wise count rates for Quadrant C Data is divided into 100 sec bins |
 |
 |
| Module-wise count rates for Quadrant D Data is divided into 100 sec bins |
 |
 |
| Parameter | Plot |
|---|---|
| CZT HV Monitor | 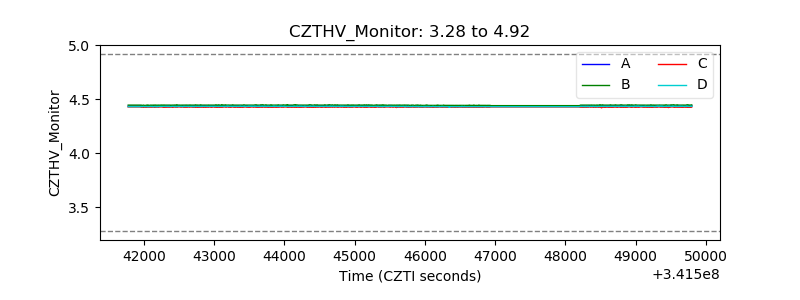 |
| D_VDD | 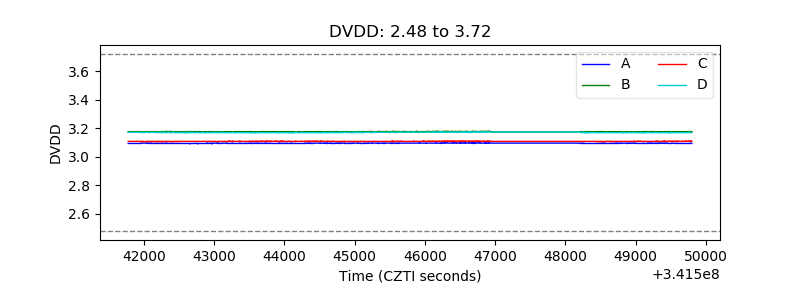 |
| Temperature 1 | 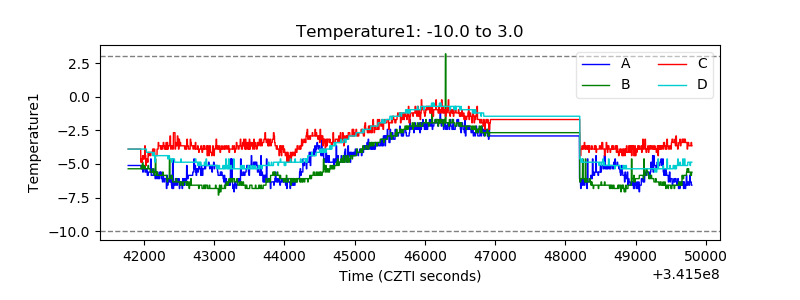 |
| Veto HV Monitor | 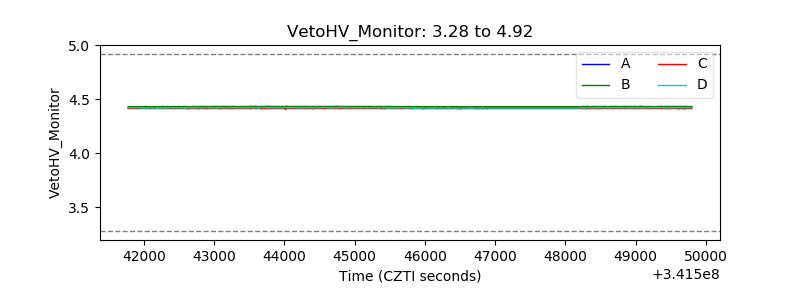 |
| Veto LLD | 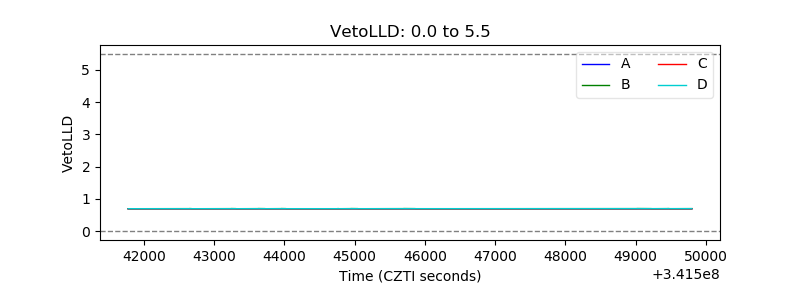 |
| Alpha Counter | 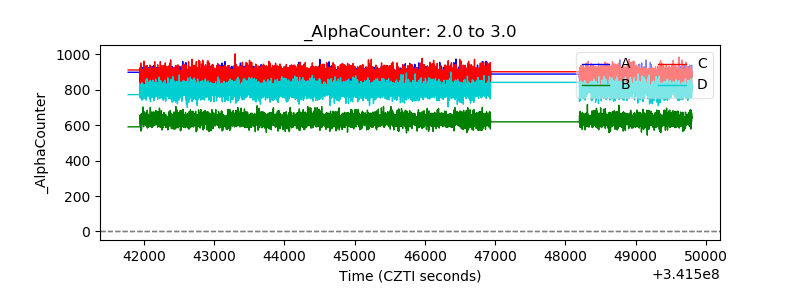 |
| _CPM_Rate | 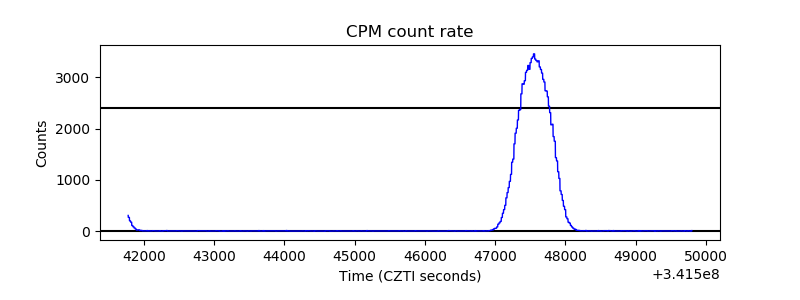 |
| CZT Counter | 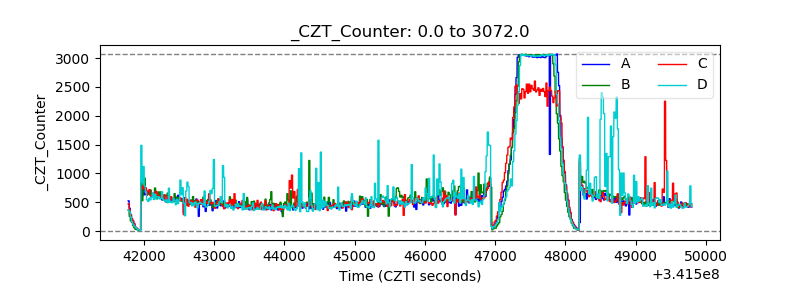 |
| +2.5 Volts monitor |  |
| +5 Volts monitor | 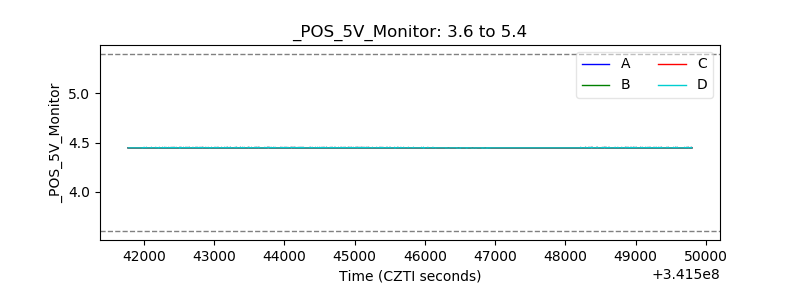 |
| _ROLL_ROT | 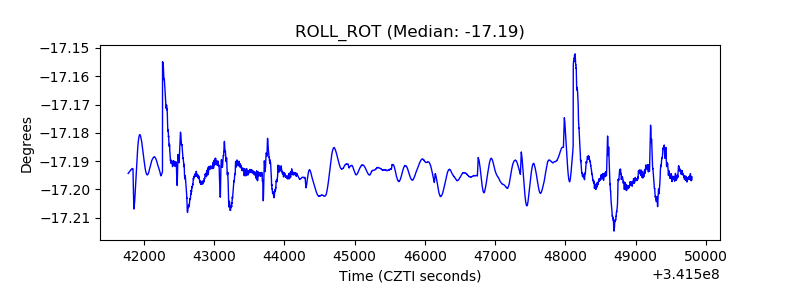 |
| _Roll_DEC | 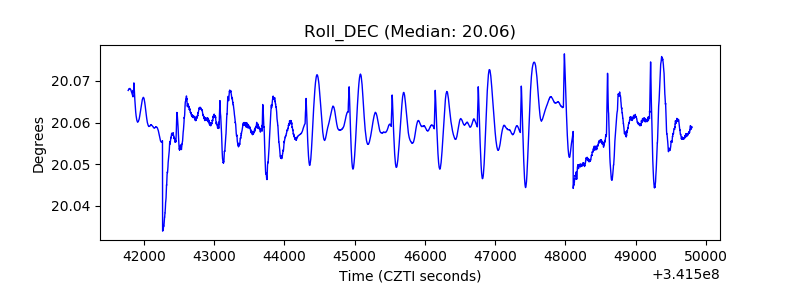 |
| _Roll_RA | 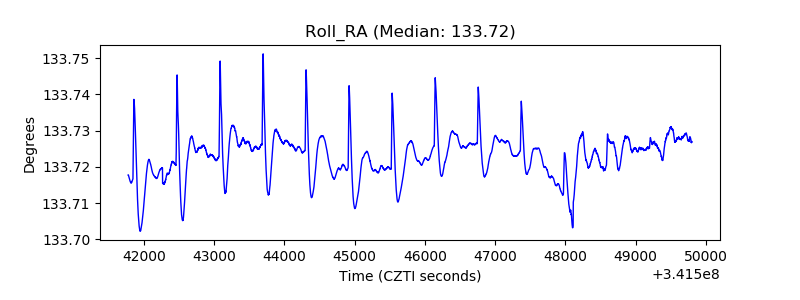 |
| Veto Counter | 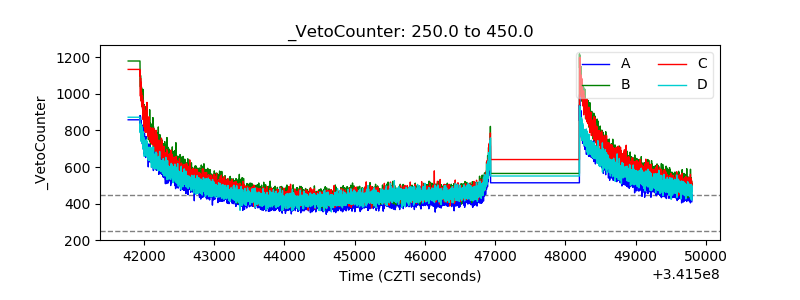 |