| Param | Original file | Final file |
|---|---|---|
| Filename | modeM0/AS1T03_249T01_9000003934_27487cztM0_level2.evt | modeM0/AS1T03_249T01_9000003934_27487cztM0_level2_quad_clean.evt |
| Size (bytes) | 503,046,720 | 109,814,400 |
| Size | 479.7 MB | 104.7 MB |
| Events in quadrant A | 3,394,893 | 736,835 |
| Events in quadrant B | 3,688,734 | 753,047 |
| Events in quadrant C | 3,458,152 | 703,563 |
| Events in quadrant D | 4,248,945 | 675,912 |
| Mode M0 | |||
|---|---|---|---|
| Quadrant | BADHDUFLAG | Total packets | Discarded packets |
| A | 0 | 13971 | 0 |
| B | 0 | 14960 | 0 |
| C | 0 | 14253 | 0 |
| D | 0 | 16978 | 0 |
| Mode M9 | |||
|---|---|---|---|
| Quadrant | BADHDUFLAG | Total packets | Discarded packets |
| A | 0 | 16 | 0 |
| B | 0 | 17 | 0 |
| C | 0 | 17 | 0 |
| D | 0 | 17 | 0 |
| Quadrant | Total seconds | Saturated seconds | Saturation percentage |
|---|---|---|---|
| A | 6552 | 48 | 0.732601% |
| B | 6552 | 130 | 1.984127% |
| C | 6551 | 101 | 1.541749% |
| D | 6551 | 105 | 1.602809% |
Noise dominated data is calculated using 1-second bins in cleaned event files. If a bin has >2000 counts, and if more than 50% of those come from <1% of pixels, then it is considered to be noise-dominated and hence unusable.
| Quadrant | # 1 sec bins | Bins with >0 counts | Bins with >2000 counts | High rate bins dominated by noise | Noise dominated (total time) | Noise dominated (detector-on time) | Marked lightcurve |
|---|---|---|---|---|---|---|---|
| A | 7852 | 6553 | 2 | 2 | 0.03% | 0.03% | 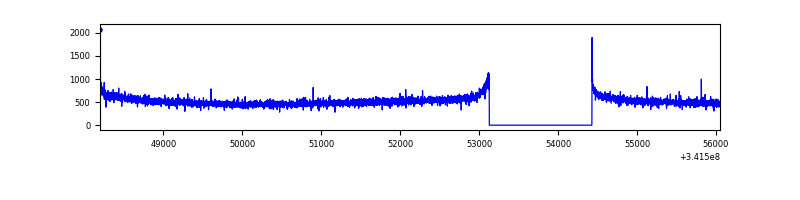 |
| B | 7852 | 6552 | 49 | 49 | 0.62% | 0.75% | 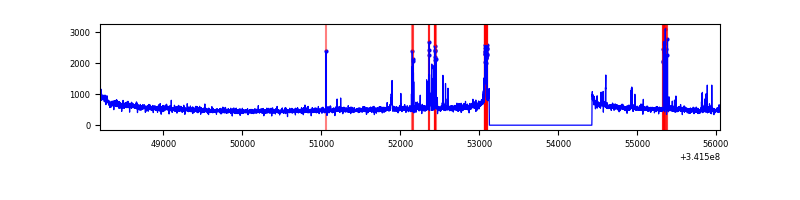 |
| C | 7851 | 6551 | 4 | 4 | 0.05% | 0.06% | 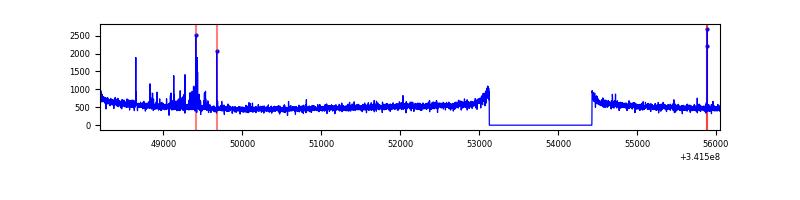 |
| D | 7851 | 6551 | 124 | 124 | 1.58% | 1.89% | 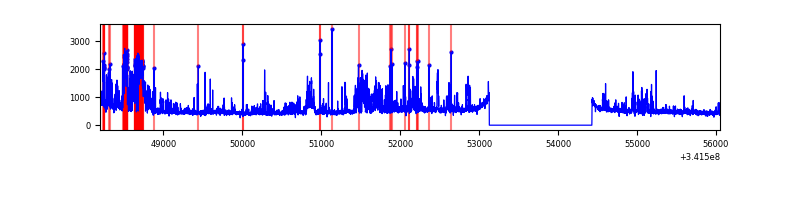 |
Top three noisy pixels from each quadrant. If the there are fewer than three noisy pixels in the level2.evt file, extra rows are filled as -1
| Pixel properties | Quadrant properties | ||||||
|---|---|---|---|---|---|---|---|
| Quadrant | DetID | PixID | Counts | Sigma | Mean | Median | Sigma |
| A | 13 | 254 | 9864 | 51.99 | 877 | 863 | 173.1 |
| A | 8 | 192 | 9856 | 51.95 | 877 | 863 | 173.1 |
| A | 3 | 137 | 7684 | 39.4 | 877 | 863 | 173.1 |
| B | 3 | 64 | 223538 | 1370.4 | 869 | 849 | 162.5 |
| B | 0 | 189 | 44964 | 271.48 | 869 | 849 | 162.5 |
| B | 12 | 111 | 19314 | 113.63 | 869 | 849 | 162.5 |
| C | 14 | 238 | 137250 | 702.82 | 835 | 843 | 194.1 |
| C | 15 | 208 | 57041 | 289.55 | 835 | 843 | 194.1 |
| C | 13 | 61 | 5721 | 25.13 | 835 | 843 | 194.1 |
| D | 1 | 52 | 1045702 | 5338.66 | 831 | 812 | 195.7 |
| D | 2 | 250 | 31411 | 156.34 | 831 | 812 | 195.7 |
| D | 2 | 234 | 22638 | 111.51 | 831 | 812 | 195.7 |
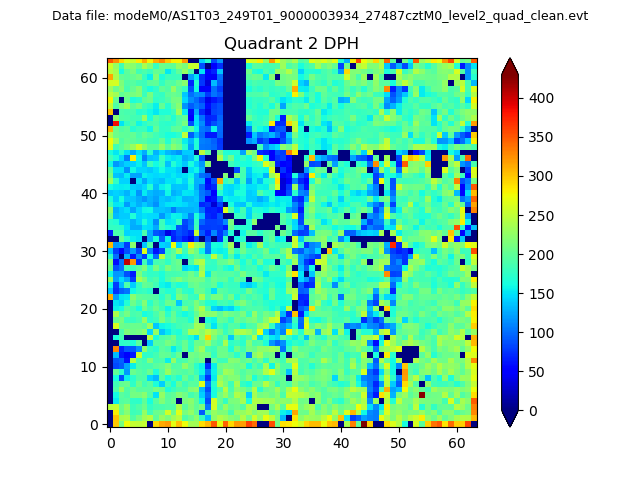
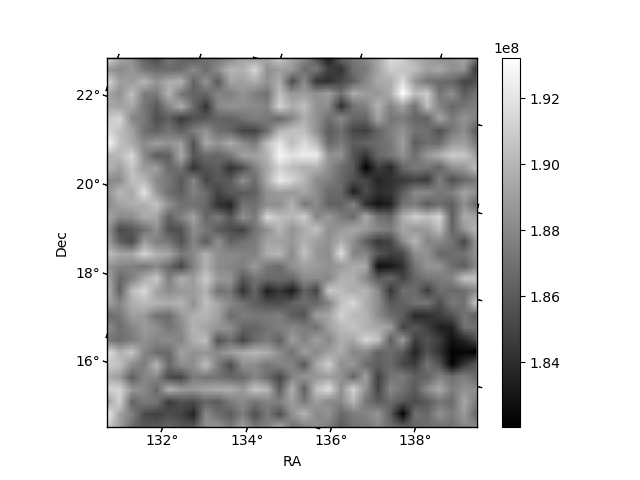
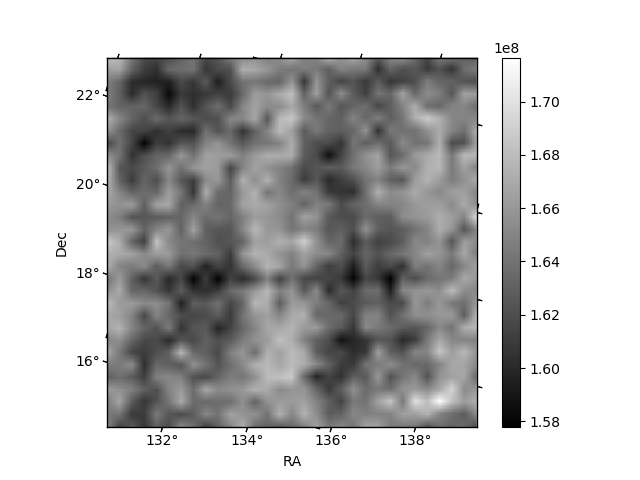
Histogram calculated using DETX and DETY for each event in the final _common_clean file
| Quadrant A | 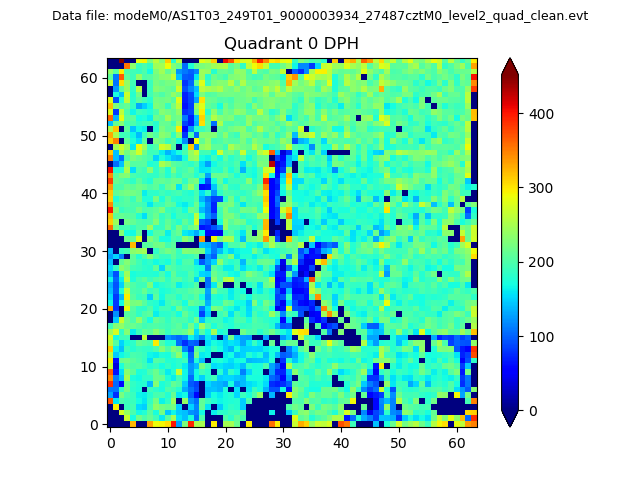 |
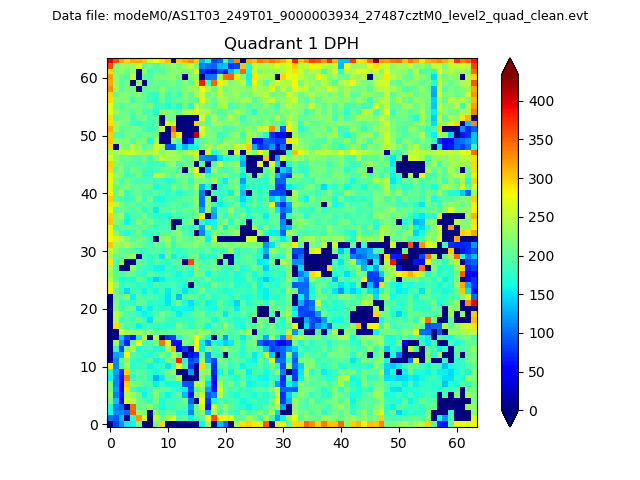 |
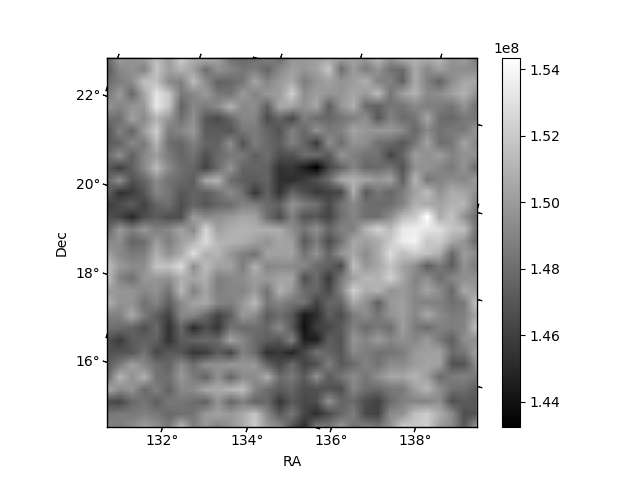
Quadrant B |
|---|---|---|---|
| Quadrant D | 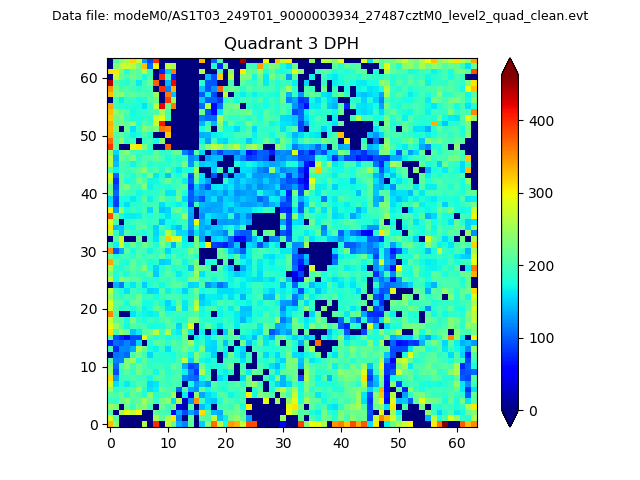 |
 |
Quadrant C |
| Plot type | Count rate plots | Images |
|---|---|---|
| Comparison with Poisson distribution Blue bars denote a histogram of data divided into 1 sec bins. Red curve is a Poisson curve with rate = median count rate of data. |
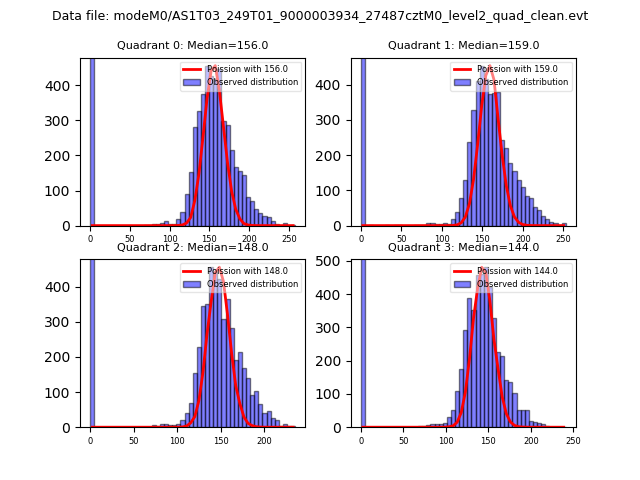 |
 |
| Quadrant-wise count rates Data is divided into 100 sec bins |
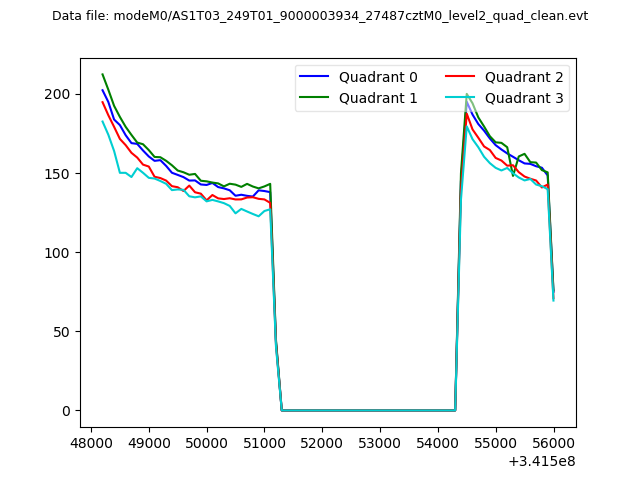 |
|
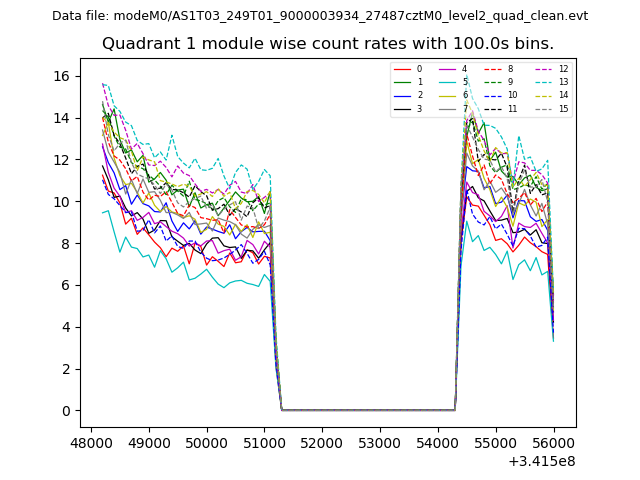
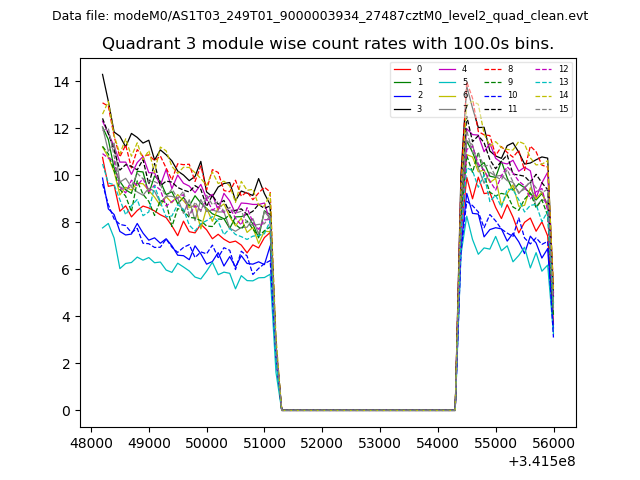
| Module-wise count rates for Quadrant A Data is divided into 100 sec bins |
 |
 |
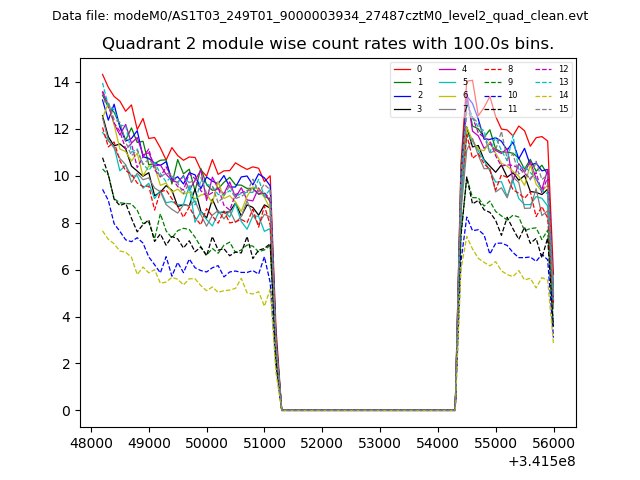
| Module-wise count rates for Quadrant B Data is divided into 100 sec bins |
 |
 |
| Module-wise count rates for Quadrant C Data is divided into 100 sec bins |
 |
 |
| Module-wise count rates for Quadrant D Data is divided into 100 sec bins |
 |
 |
| Parameter | Plot |
|---|---|
| CZT HV Monitor | 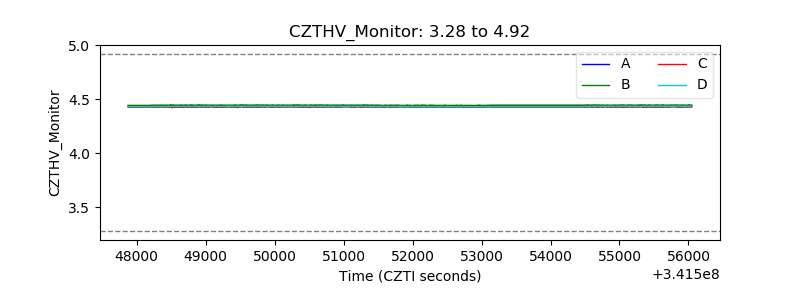 |
| D_VDD | 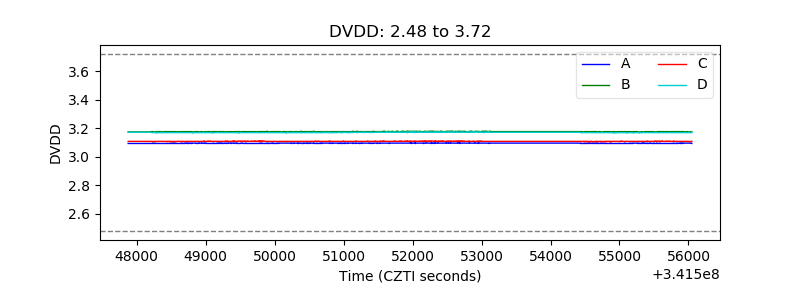 |
| Temperature 1 | 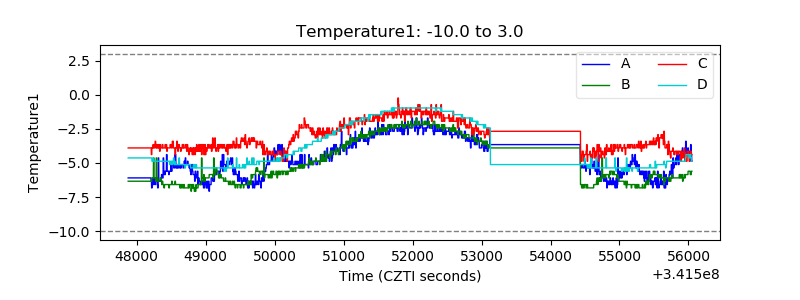 |
| Veto HV Monitor | 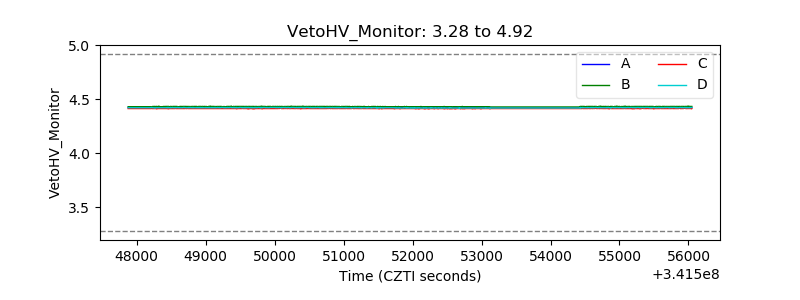 |
| Veto LLD | 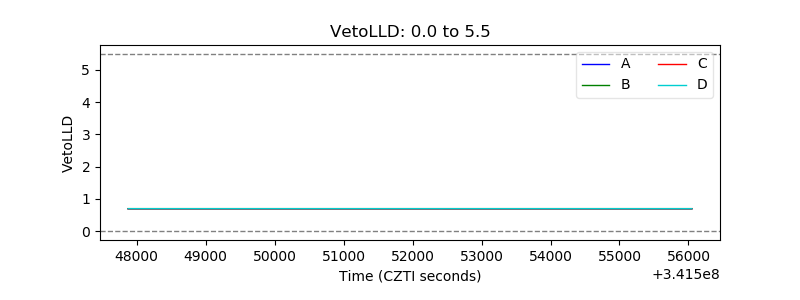 |
| Alpha Counter | 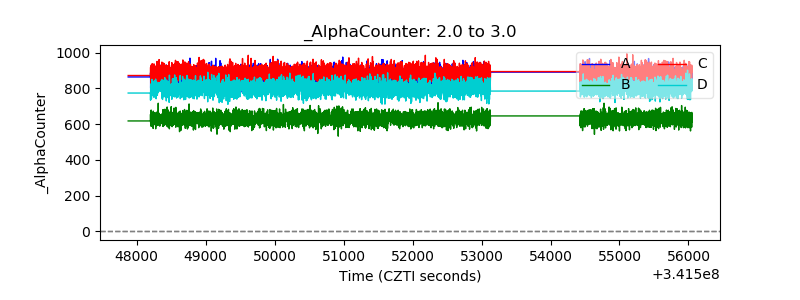 |
| _CPM_Rate | 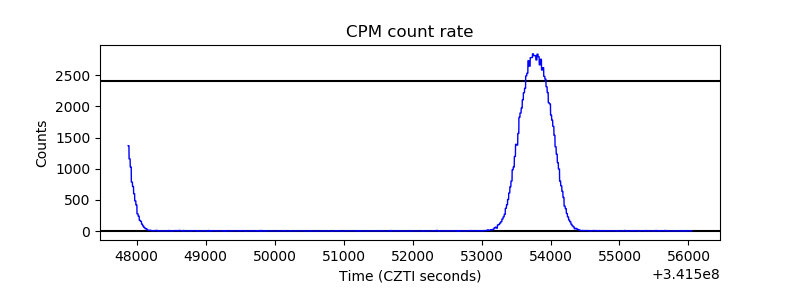 |
| CZT Counter | 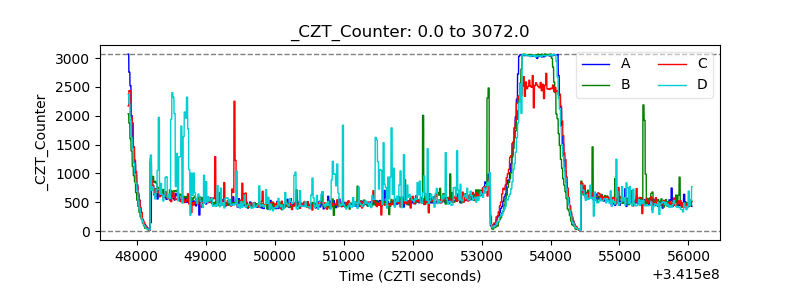 |
| +2.5 Volts monitor |  |
| +5 Volts monitor |  |
| _ROLL_ROT |  |
| _Roll_DEC | 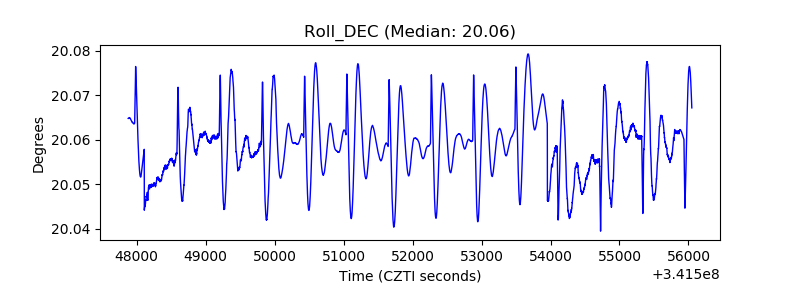 |
| _Roll_RA | 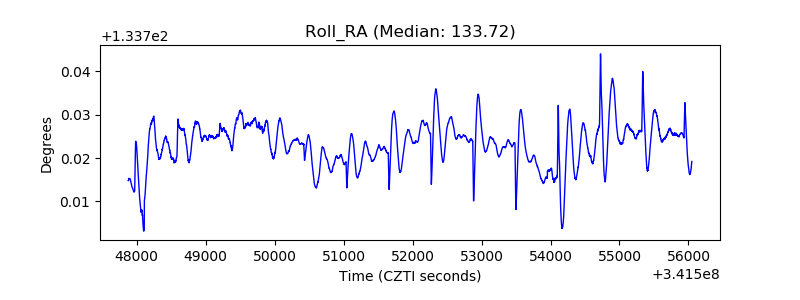 |
| Veto Counter | 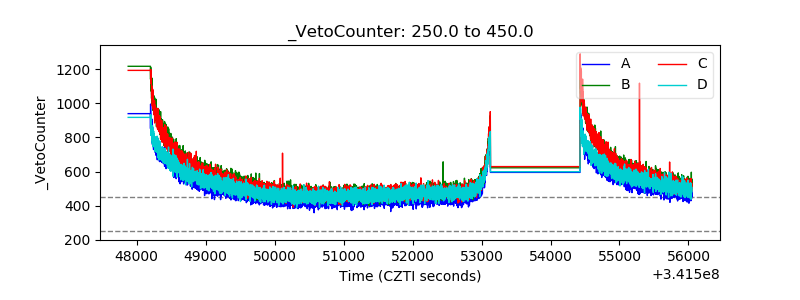 |