| Param | Original file | Final file |
|---|---|---|
| Filename | modeM0/AS1T03_249T01_9000003934_27488cztM0_level2.evt | modeM0/AS1T03_249T01_9000003934_27488cztM0_level2_quad_clean.evt |
| Size (bytes) | 497,623,680 | 90,990,720 |
| Size | 474.6 MB | 86.8 MB |
| Events in quadrant A | 3,120,075 | 600,122 |
| Events in quadrant B | 3,277,594 | 608,416 |
| Events in quadrant C | 3,219,956 | 571,883 |
| Events in quadrant D | 5,037,895 | 547,841 |
| Mode M0 | |||
|---|---|---|---|
| Quadrant | BADHDUFLAG | Total packets | Discarded packets |
| A | 0 | 12774 | 0 |
| B | 0 | 13271 | 0 |
| C | 0 | 13101 | 0 |
| D | 0 | 19010 | 0 |
| Mode M9 | |||
|---|---|---|---|
| Quadrant | BADHDUFLAG | Total packets | Discarded packets |
| A | 0 | 13 | 0 |
| B | 0 | 13 | 0 |
| C | 0 | 13 | 0 |
| D | 0 | 13 | 0 |
| Quadrant | Total seconds | Saturated seconds | Saturation percentage |
|---|---|---|---|
| A | 6122 | 20 | 0.326691% |
| B | 6122 | 64 | 1.045410% |
| C | 6122 | 91 | 1.486442% |
| D | 6122 | 422 | 6.893172% |
Noise dominated data is calculated using 1-second bins in cleaned event files. If a bin has >2000 counts, and if more than 50% of those come from <1% of pixels, then it is considered to be noise-dominated and hence unusable.
| Quadrant | # 1 sec bins | Bins with >0 counts | Bins with >2000 counts | High rate bins dominated by noise | Noise dominated (total time) | Noise dominated (detector-on time) | Marked lightcurve |
|---|---|---|---|---|---|---|---|
| A | 7452 | 6123 | 0 | 0 | 0.00% | 0.00% | 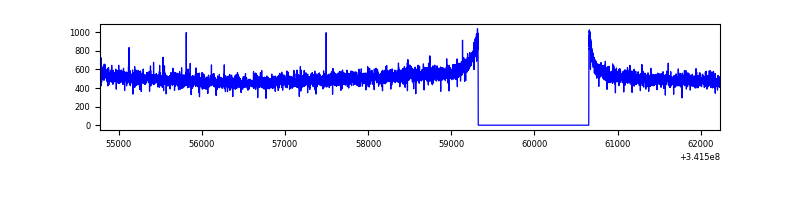 |
| B | 7452 | 6123 | 15 | 15 | 0.20% | 0.24% | 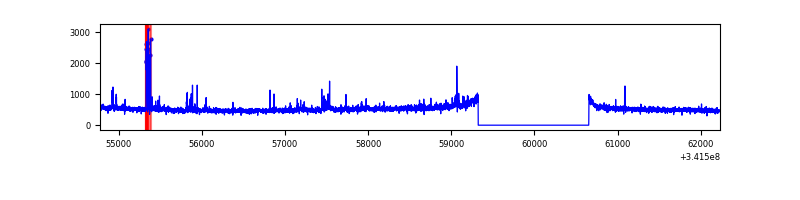 |
| C | 7452 | 6123 | 14 | 14 | 0.19% | 0.23% | 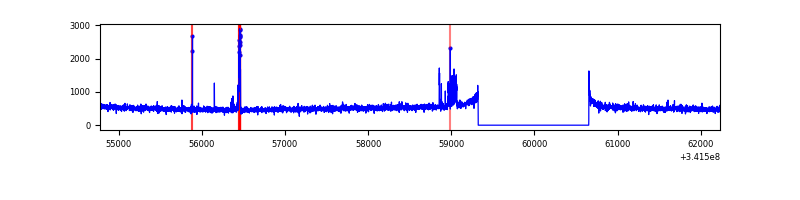 |
| D | 7452 | 6123 | 351 | 351 | 4.71% | 5.73% | 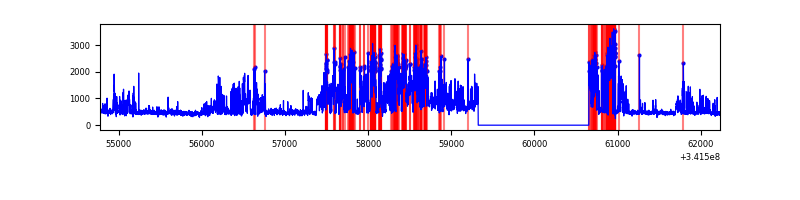 |
Top three noisy pixels from each quadrant. If the there are fewer than three noisy pixels in the level2.evt file, extra rows are filled as -1
| Pixel properties | Quadrant properties | ||||||
|---|---|---|---|---|---|---|---|
| Quadrant | DetID | PixID | Counts | Sigma | Mean | Median | Sigma |
| A | 13 | 254 | 9386 | 53.38 | 807 | 794 | 161.0 |
| A | 0 | 13 | 8739 | 49.36 | 807 | 794 | 161.0 |
| A | 3 | 137 | 7183 | 39.69 | 807 | 794 | 161.0 |
| B | 3 | 64 | 106555 | 703.3 | 800 | 779 | 150.4 |
| B | 0 | 230 | 17759 | 112.9 | 800 | 779 | 150.4 |
| B | 12 | 111 | 17687 | 112.42 | 800 | 779 | 150.4 |
| C | 14 | 238 | 125831 | 697.81 | 767 | 773 | 179.2 |
| C | 15 | 208 | 47601 | 261.3 | 767 | 773 | 179.2 |
| C | 10 | 22 | 41444 | 226.94 | 767 | 773 | 179.2 |
| D | 1 | 52 | 2109921 | 11866.03 | 758 | 741 | 177.7 |
| D | 2 | 250 | 25711 | 140.48 | 758 | 741 | 177.7 |
| D | 2 | 234 | 21399 | 116.22 | 758 | 741 | 177.7 |
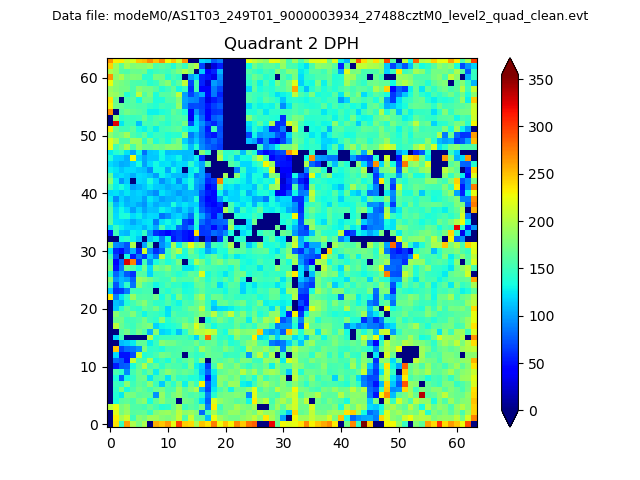
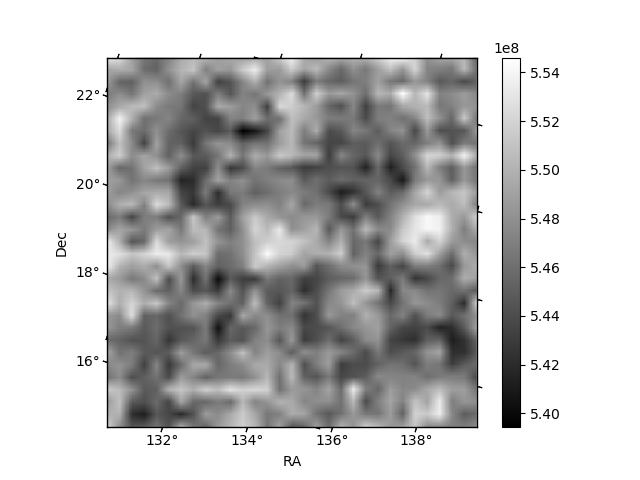
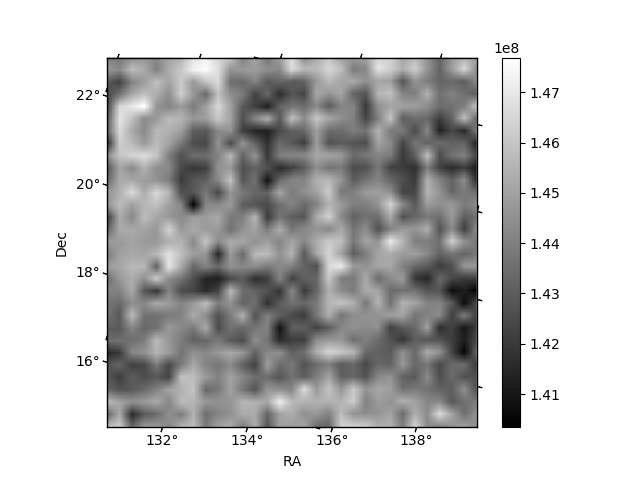
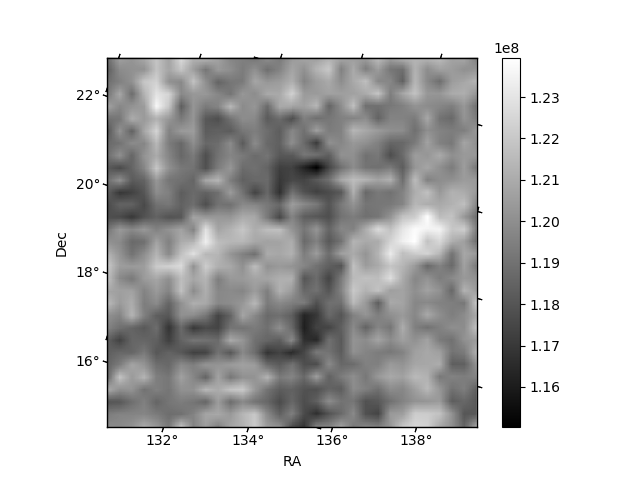
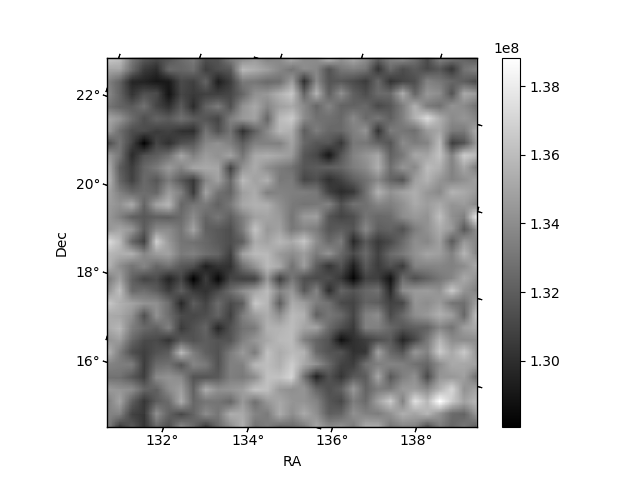
Histogram calculated using DETX and DETY for each event in the final _common_clean file
| Quadrant A | 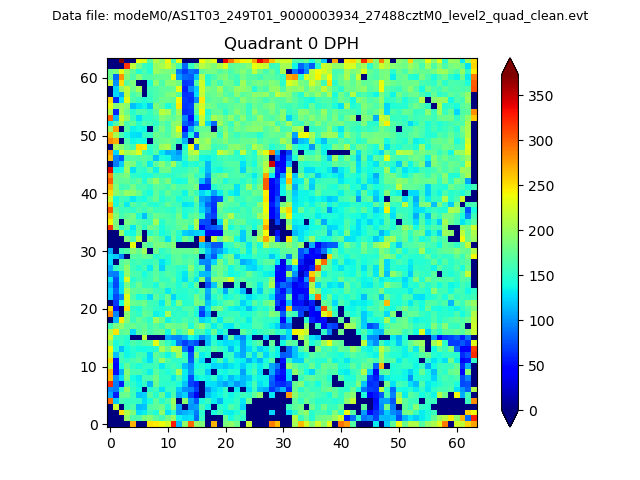 |
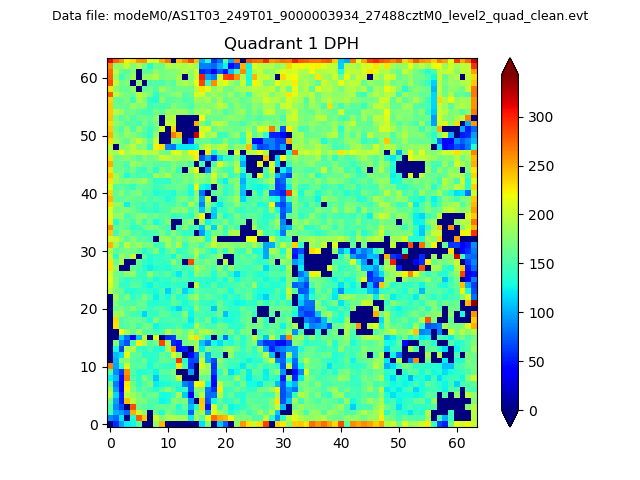 |
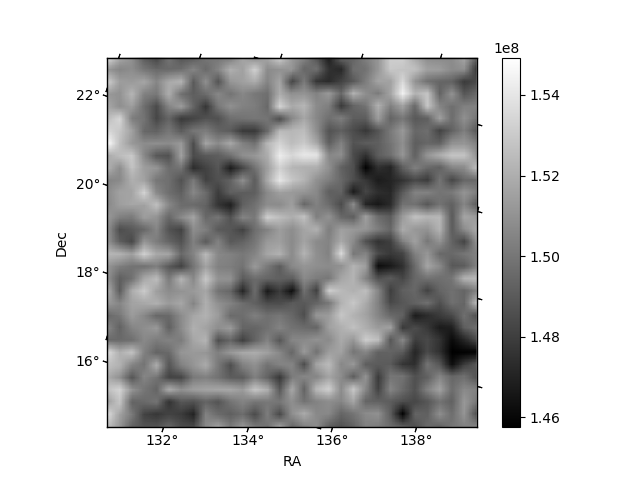
Quadrant B |
|---|---|---|---|
| Quadrant D | 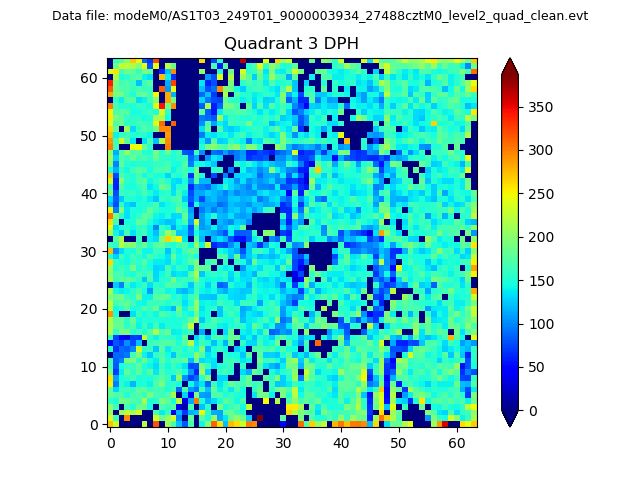 |
 |
Quadrant C |
| Plot type | Count rate plots | Images |
|---|---|---|
| Comparison with Poisson distribution Blue bars denote a histogram of data divided into 1 sec bins. Red curve is a Poisson curve with rate = median count rate of data. |
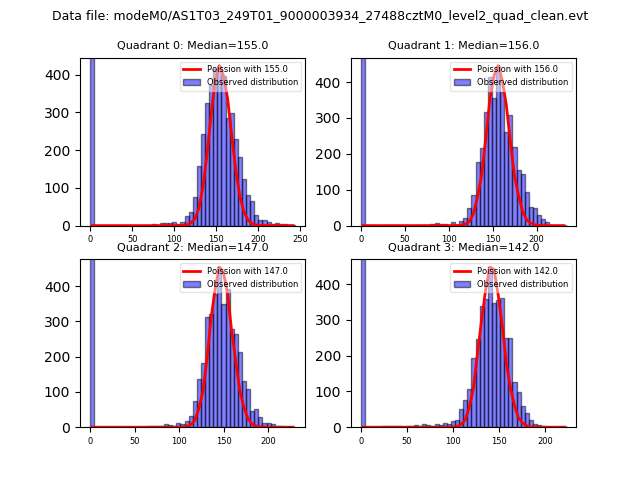 |
 |
| Quadrant-wise count rates Data is divided into 100 sec bins |
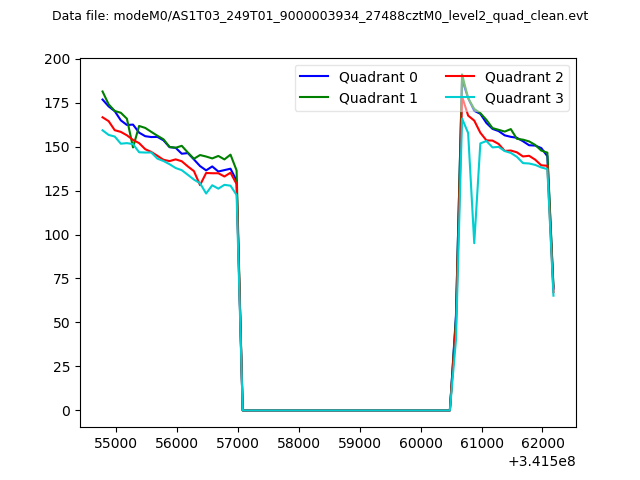 |
|
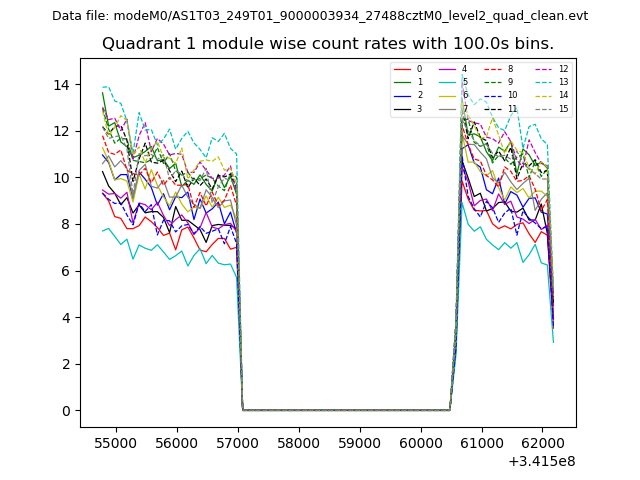
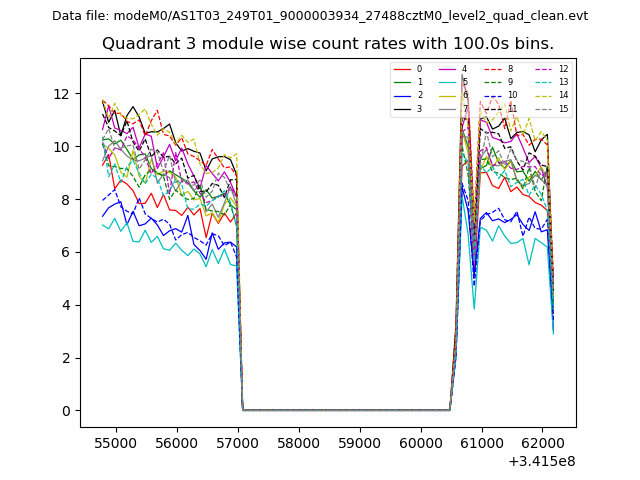
| Module-wise count rates for Quadrant A Data is divided into 100 sec bins |
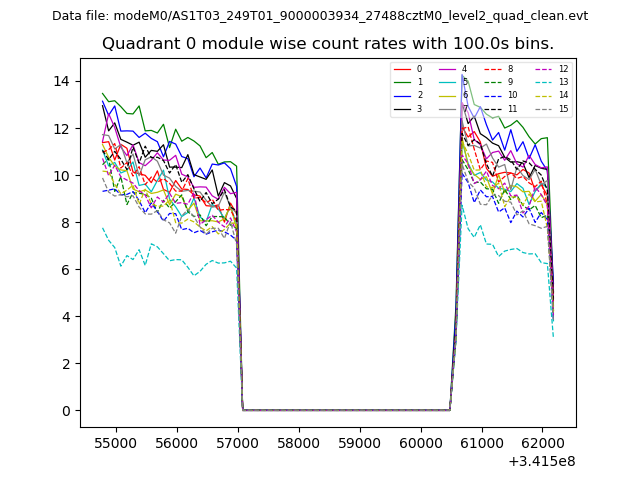 |
 |
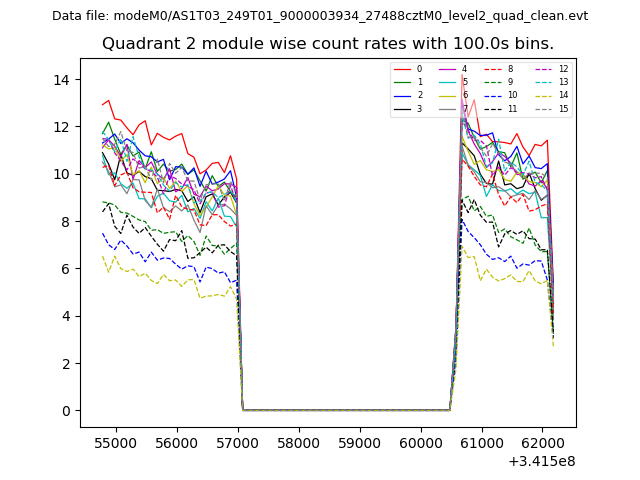
| Module-wise count rates for Quadrant B Data is divided into 100 sec bins |
 |
 |
| Module-wise count rates for Quadrant C Data is divided into 100 sec bins |
 |
 |
| Module-wise count rates for Quadrant D Data is divided into 100 sec bins |
 |
 |
| Parameter | Plot |
|---|---|
| CZT HV Monitor | 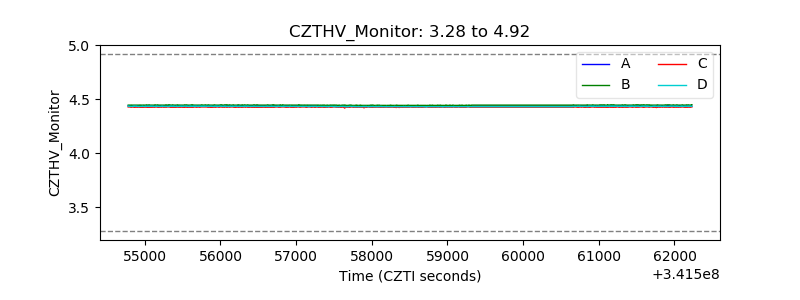 |
| D_VDD | 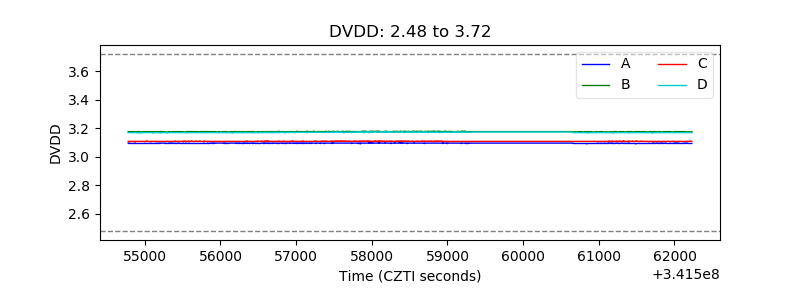 |
| Temperature 1 | 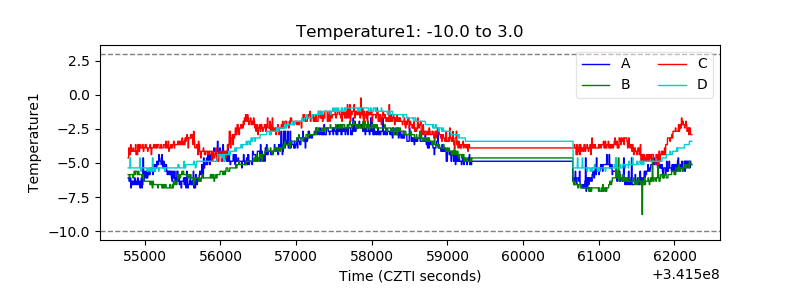 |
| Veto HV Monitor |  |
| Veto LLD | 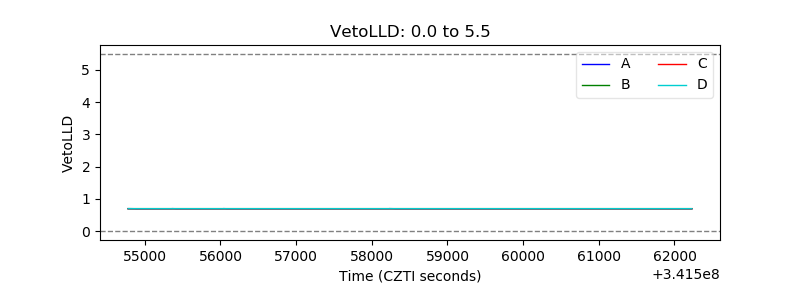 |
| Alpha Counter | 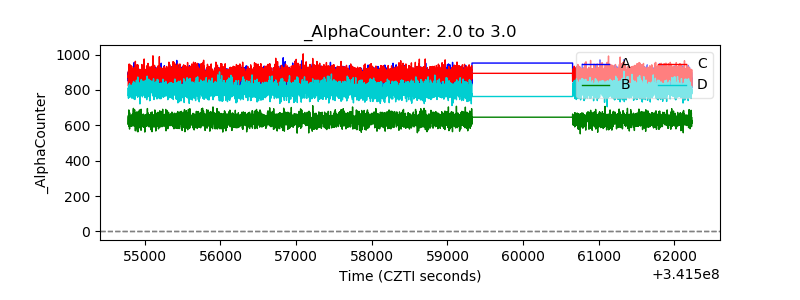 |
| _CPM_Rate | 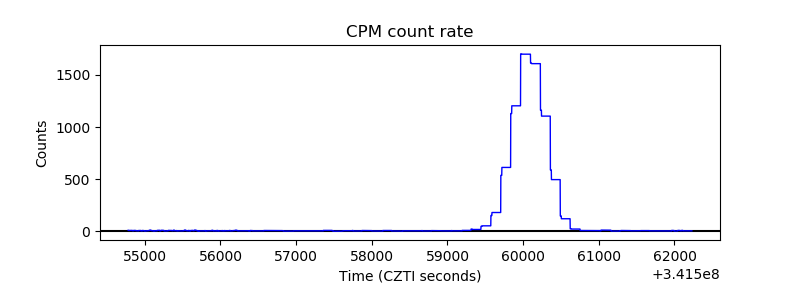 |
| CZT Counter | 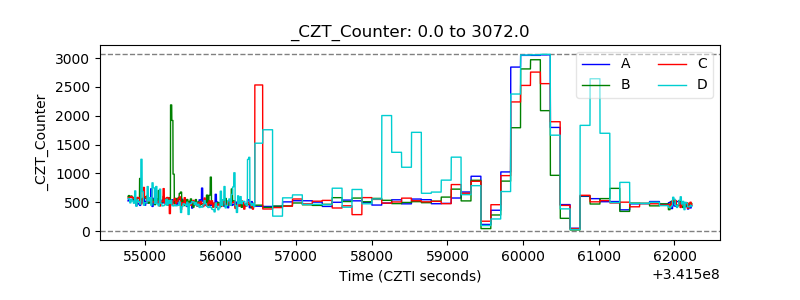 |
| +2.5 Volts monitor |  |
| +5 Volts monitor |  |
| _ROLL_ROT |  |
| _Roll_DEC | 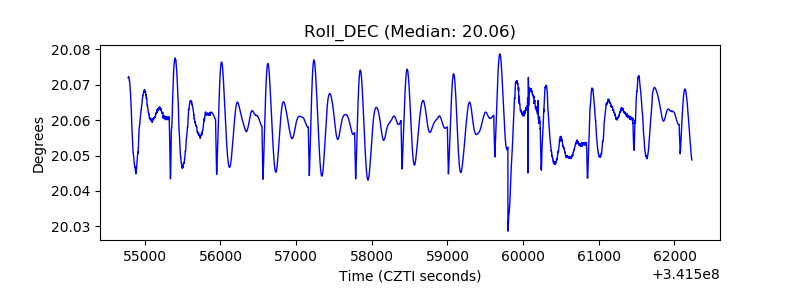 |
| _Roll_RA | 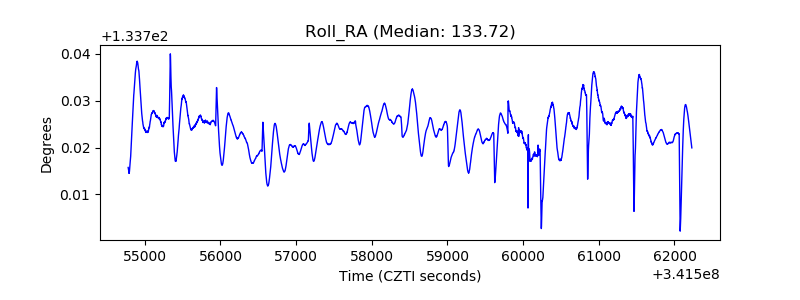 |
| Veto Counter |  |