| Param | Original file | Final file |
|---|---|---|
| Filename | modeM0/AS1T03_249T01_9000003934_27489cztM0_level2.evt | modeM0/AS1T03_249T01_9000003934_27489cztM0_level2_quad_clean.evt |
| Size (bytes) | 419,912,640 | 77,466,240 |
| Size | 400.5 MB | 73.9 MB |
| Events in quadrant A | 2,860,194 | 498,896 |
| Events in quadrant B | 3,060,882 | 504,714 |
| Events in quadrant C | 2,944,820 | 476,969 |
| Events in quadrant D | 3,466,816 | 469,538 |
| Mode M0 | |||
|---|---|---|---|
| Quadrant | BADHDUFLAG | Total packets | Discarded packets |
| A | 0 | 11787 | 0 |
| B | 0 | 12523 | 0 |
| C | 0 | 12064 | 0 |
| D | 0 | 13974 | 0 |
| Mode M9 | |||
|---|---|---|---|
| Quadrant | BADHDUFLAG | Total packets | Discarded packets |
| A | 0 | 12 | 0 |
| B | 0 | 12 | 0 |
| C | 0 | 12 | 0 |
| D | 0 | 12 | 0 |
| Quadrant | Total seconds | Saturated seconds | Saturation percentage |
|---|---|---|---|
| A | 5653 | 38 | 0.672209% |
| B | 5653 | 68 | 1.202901% |
| C | 5654 | 94 | 1.662540% |
| D | 5654 | 62 | 1.096569% |
Noise dominated data is calculated using 1-second bins in cleaned event files. If a bin has >2000 counts, and if more than 50% of those come from <1% of pixels, then it is considered to be noise-dominated and hence unusable.
| Quadrant | # 1 sec bins | Bins with >0 counts | Bins with >2000 counts | High rate bins dominated by noise | Noise dominated (total time) | Noise dominated (detector-on time) | Marked lightcurve |
|---|---|---|---|---|---|---|---|
| A | 6858 | 5654 | 0 | 0 | 0.00% | 0.00% | 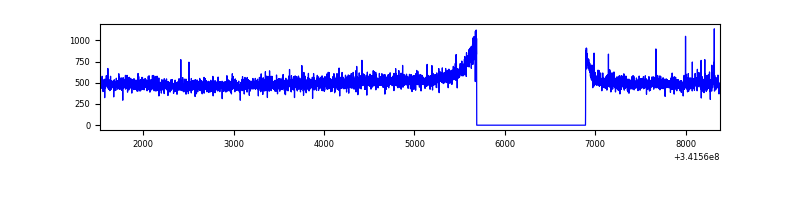 |
| B | 6858 | 5653 | 3 | 3 | 0.04% | 0.05% | 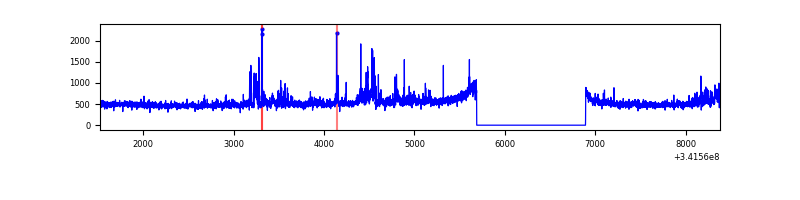 |
| C | 6859 | 5655 | 12 | 12 | 0.17% | 0.21% | 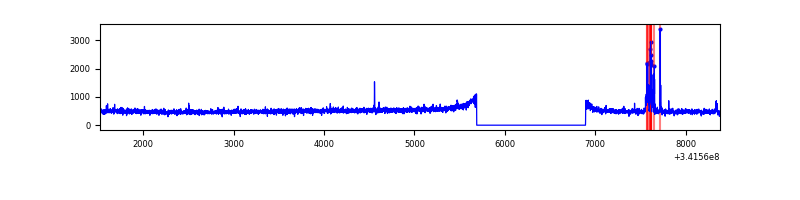 |
| D | 6859 | 5655 | 52 | 52 | 0.76% | 0.92% | 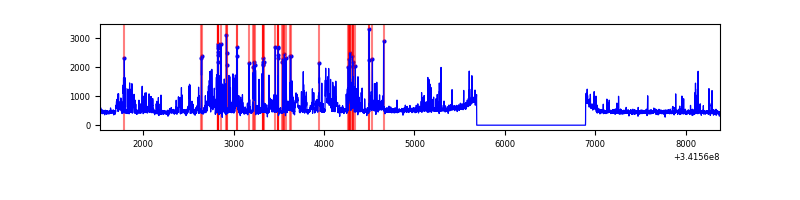 |
Top three noisy pixels from each quadrant. If the there are fewer than three noisy pixels in the level2.evt file, extra rows are filled as -1
| Pixel properties | Quadrant properties | ||||||
|---|---|---|---|---|---|---|---|
| Quadrant | DetID | PixID | Counts | Sigma | Mean | Median | Sigma |
| A | 6 | 16 | 14296 | 92.19 | 738 | 724 | 147.2 |
| A | 13 | 254 | 9158 | 57.29 | 738 | 724 | 147.2 |
| A | 3 | 137 | 6681 | 40.46 | 738 | 724 | 147.2 |
| B | 3 | 64 | 204980 | 1481.91 | 724 | 706 | 137.8 |
| B | 12 | 111 | 16585 | 115.19 | 724 | 706 | 137.8 |
| B | 11 | 111 | 15072 | 104.21 | 724 | 706 | 137.8 |
| C | 14 | 238 | 114067 | 687.72 | 701 | 707 | 164.8 |
| C | 10 | 5 | 76553 | 460.13 | 701 | 707 | 164.8 |
| C | 15 | 208 | 17920 | 104.43 | 701 | 707 | 164.8 |
| D | 1 | 52 | 713257 | 4276.92 | 708 | 690 | 166.6 |
| D | 2 | 250 | 21472 | 124.74 | 708 | 690 | 166.6 |
| D | 2 | 234 | 20420 | 118.42 | 708 | 690 | 166.6 |
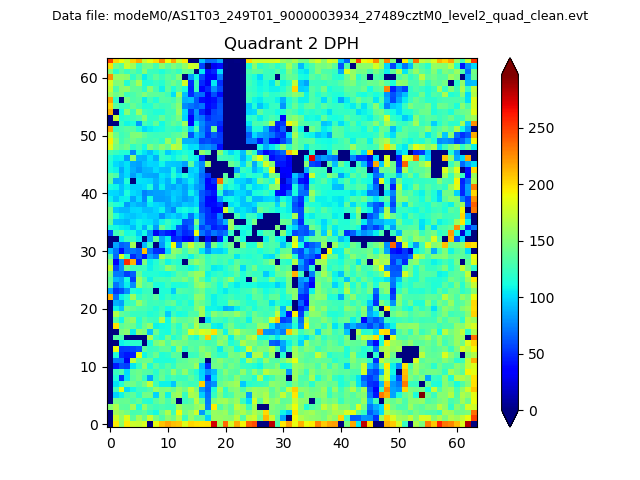
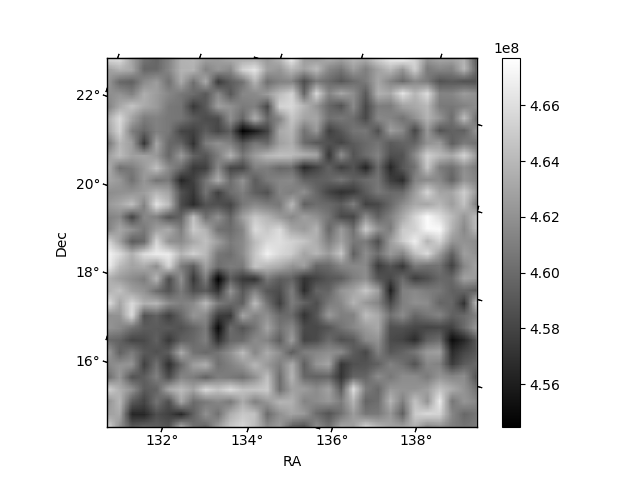
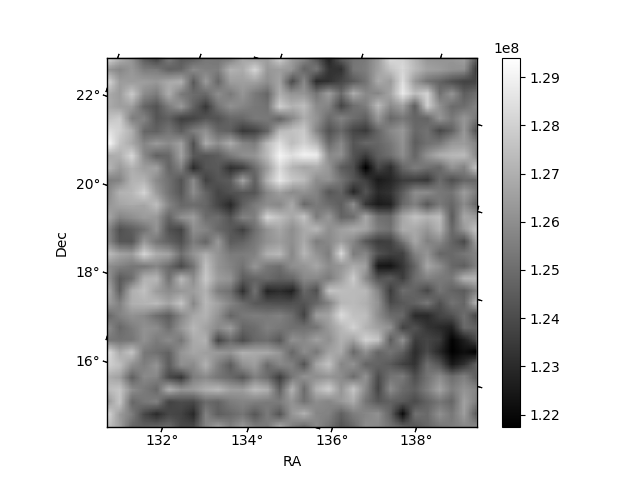
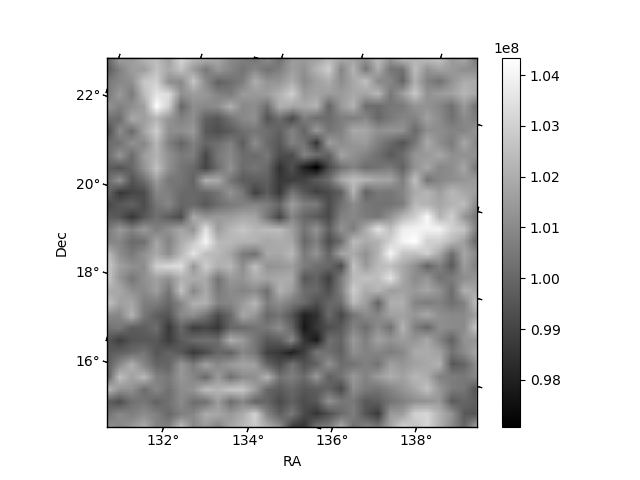
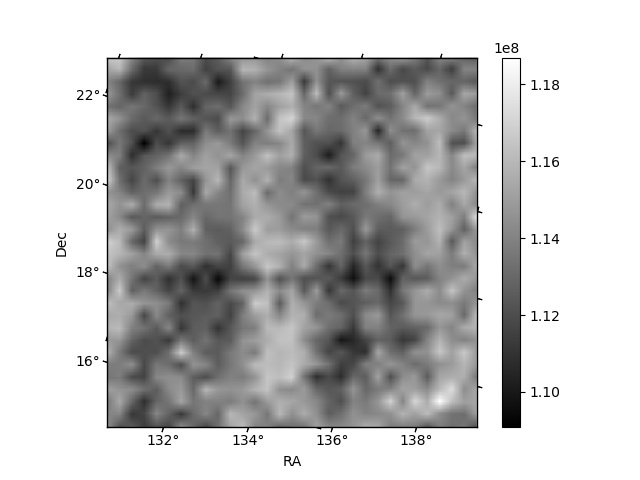
Histogram calculated using DETX and DETY for each event in the final _common_clean file
| Quadrant A | 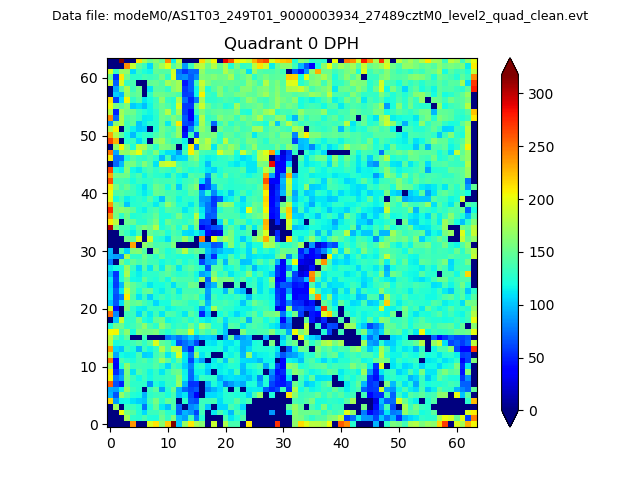 |
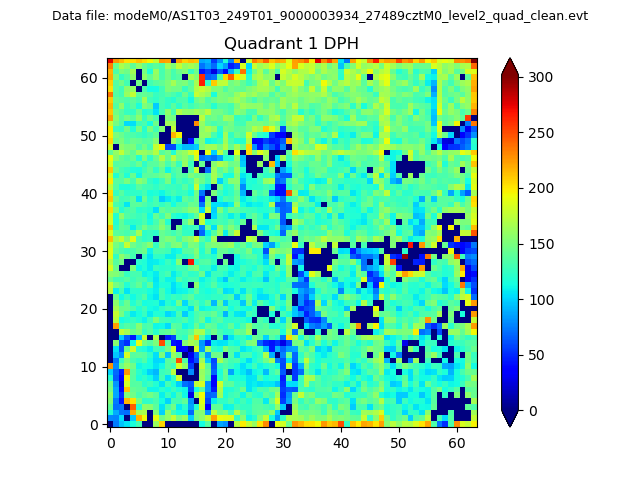 |
Quadrant B |
|---|---|---|---|
| Quadrant D | 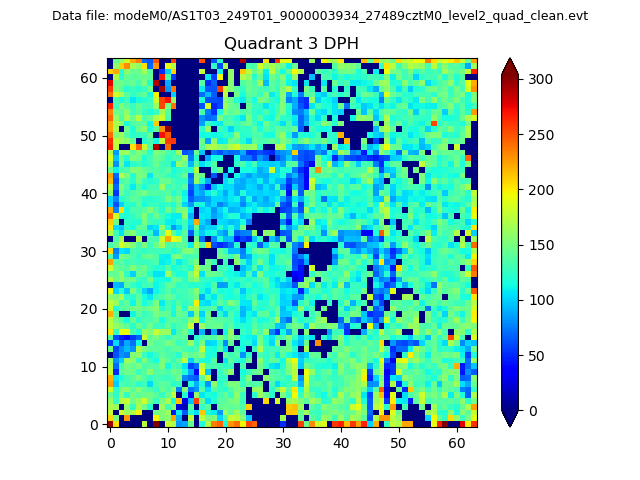 |
 |
Quadrant C |
| Plot type | Count rate plots | Images |
|---|---|---|
| Comparison with Poisson distribution Blue bars denote a histogram of data divided into 1 sec bins. Red curve is a Poisson curve with rate = median count rate of data. |
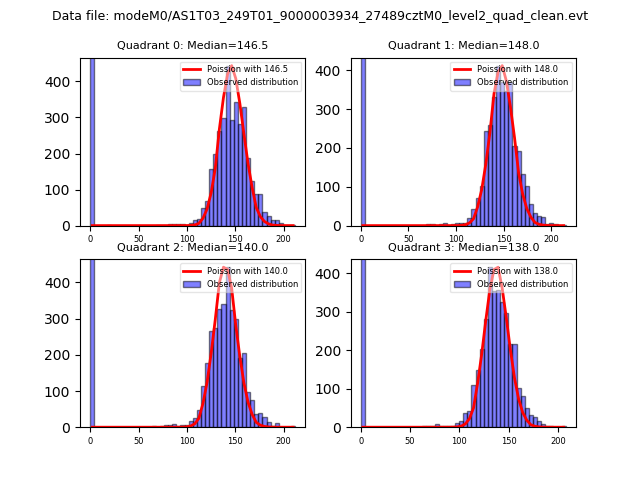 |
 |
| Quadrant-wise count rates Data is divided into 100 sec bins |
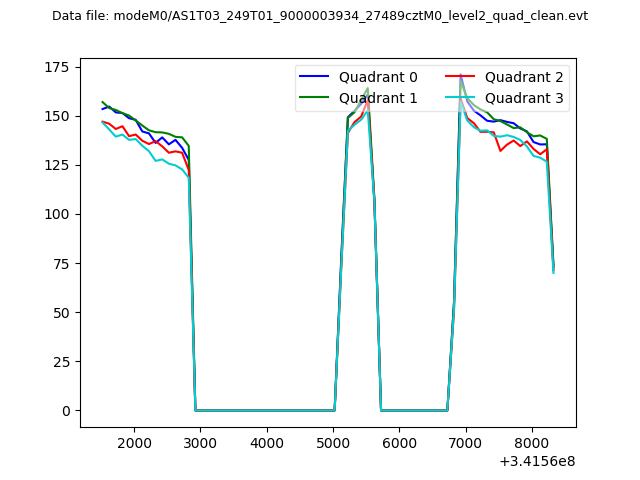 |
|
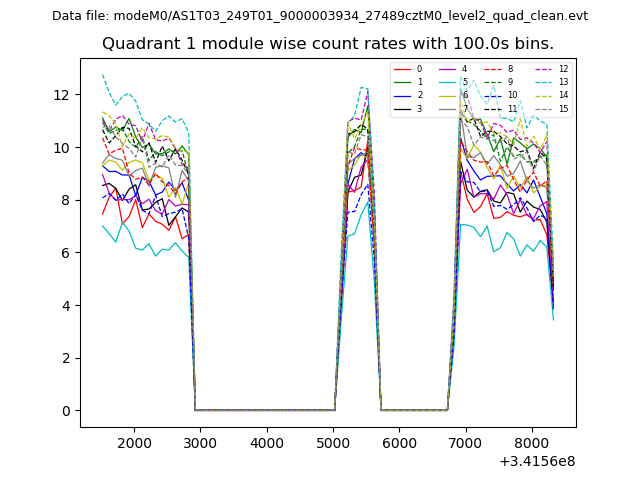
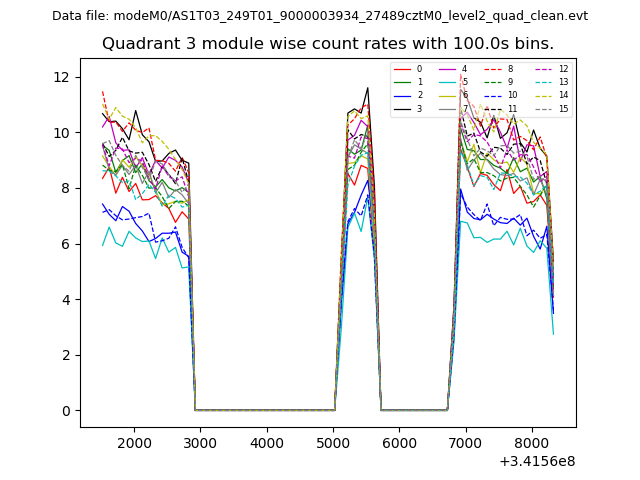
| Module-wise count rates for Quadrant A Data is divided into 100 sec bins |
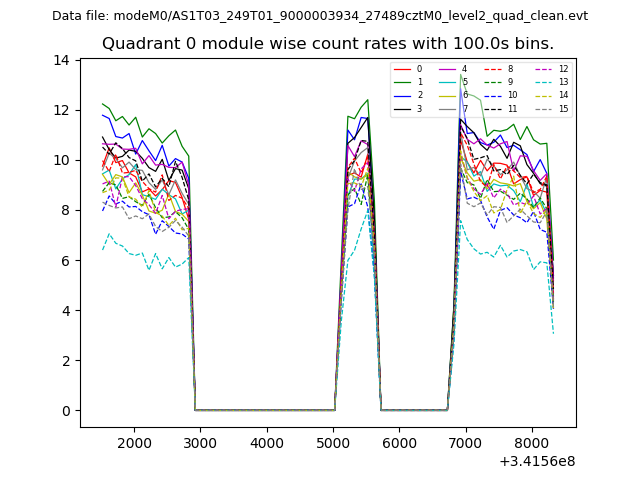 |
 |
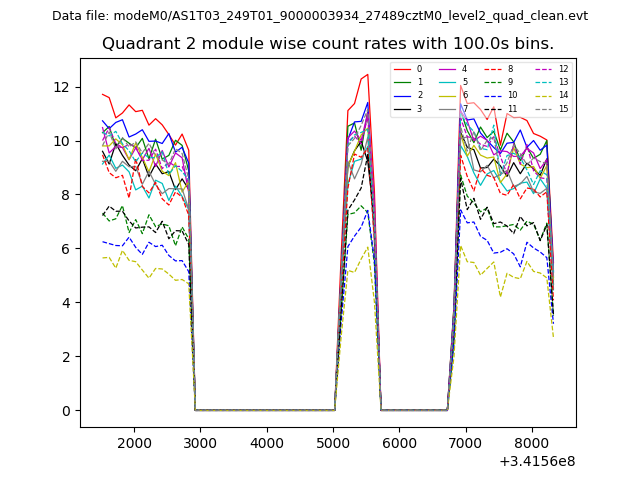
| Module-wise count rates for Quadrant B Data is divided into 100 sec bins |
 |
 |
| Module-wise count rates for Quadrant C Data is divided into 100 sec bins |
 |
 |
| Module-wise count rates for Quadrant D Data is divided into 100 sec bins |
 |
 |
| Parameter | Plot |
|---|---|
| CZT HV Monitor | 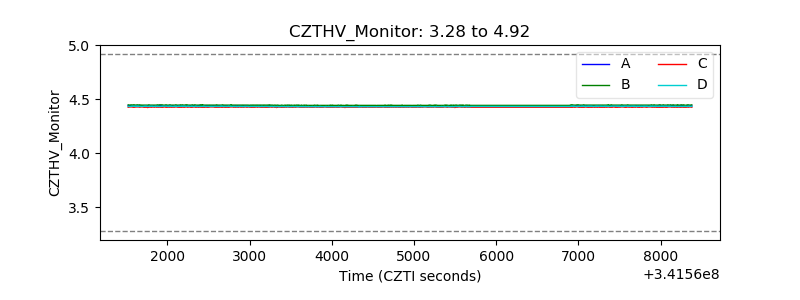 |
| D_VDD | 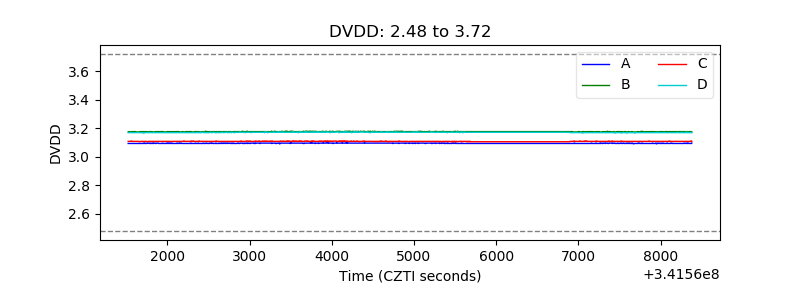 |
| Temperature 1 | 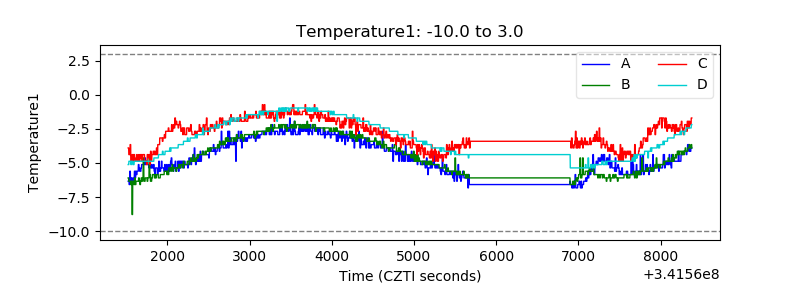 |
| Veto HV Monitor | 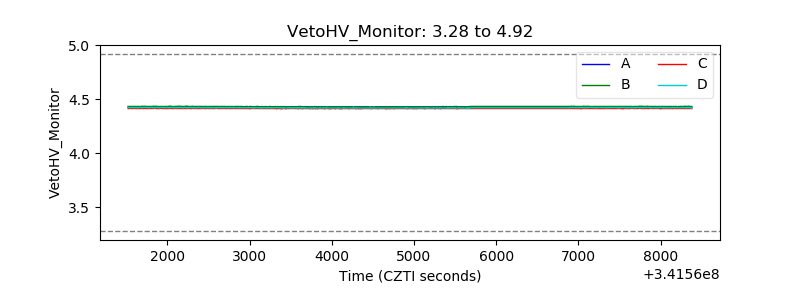 |
| Veto LLD | 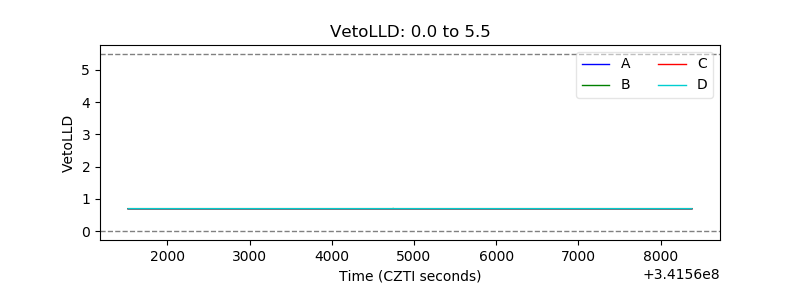 |
| Alpha Counter | 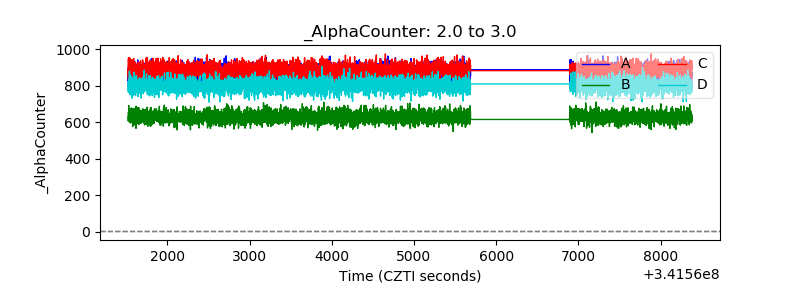 |
| _CPM_Rate | 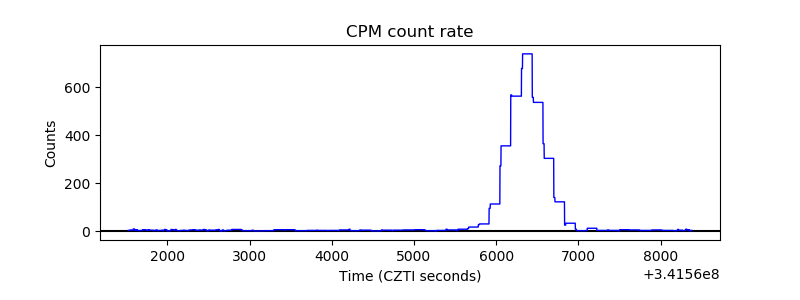 |
| CZT Counter | 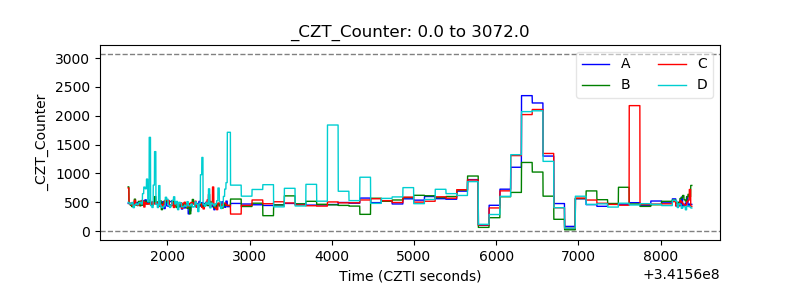 |
| +2.5 Volts monitor |  |
| +5 Volts monitor |  |
| _ROLL_ROT | 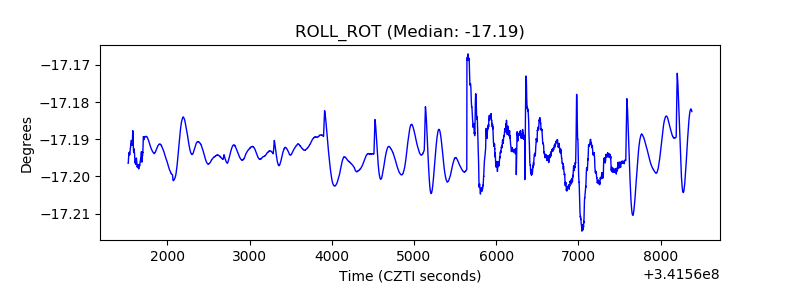 |
| _Roll_DEC | 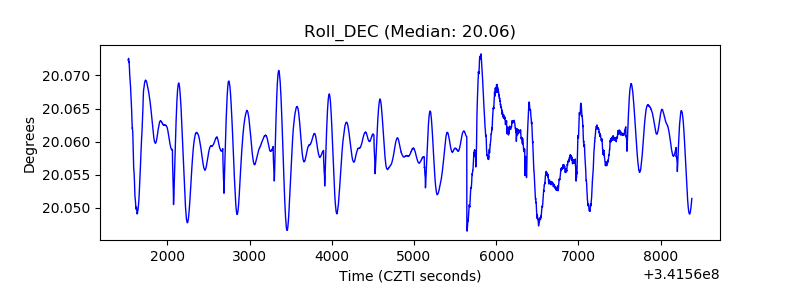 |
| _Roll_RA | 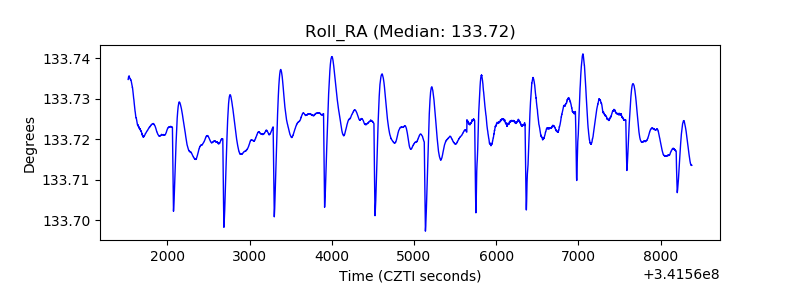 |
| Veto Counter | 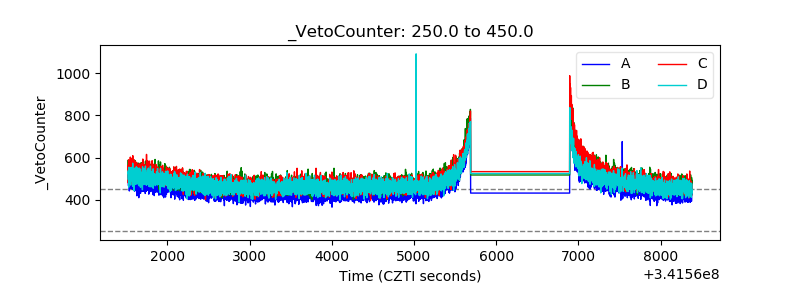 |