| Param | Original file | Final file |
|---|---|---|
| Filename | modeM0/AS1T03_249T01_9000003934_27490cztM0_level2.evt | modeM0/AS1T03_249T01_9000003934_27490cztM0_level2_quad_clean.evt |
| Size (bytes) | 420,272,640 | 78,431,040 |
| Size | 400.8 MB | 74.8 MB |
| Events in quadrant A | 2,891,509 | 500,683 |
| Events in quadrant B | 3,389,130 | 506,986 |
| Events in quadrant C | 2,950,016 | 480,542 |
| Events in quadrant D | 3,097,344 | 475,633 |
| Mode M0 | |||
|---|---|---|---|
| Quadrant | BADHDUFLAG | Total packets | Discarded packets |
| A | 0 | 12077 | 0 |
| B | 0 | 13575 | 0 |
| C | 0 | 12275 | 0 |
| D | 0 | 12952 | 0 |
| Mode M9 | |||
|---|---|---|---|
| Quadrant | BADHDUFLAG | Total packets | Discarded packets |
| A | 0 | 9 | 0 |
| B | 0 | 9 | 0 |
| C | 0 | 9 | 0 |
| D | 0 | 9 | 0 |
| Quadrant | Total seconds | Saturated seconds | Saturation percentage |
|---|---|---|---|
| A | 5883 | 64 | 1.087880% |
| B | 5884 | 110 | 1.869477% |
| C | 5884 | 87 | 1.478586% |
| D | 5884 | 68 | 1.155676% |
Noise dominated data is calculated using 1-second bins in cleaned event files. If a bin has >2000 counts, and if more than 50% of those come from <1% of pixels, then it is considered to be noise-dominated and hence unusable.
| Quadrant | # 1 sec bins | Bins with >0 counts | Bins with >2000 counts | High rate bins dominated by noise | Noise dominated (total time) | Noise dominated (detector-on time) | Marked lightcurve |
|---|---|---|---|---|---|---|---|
| A | 6803 | 5883 | 0 | 0 | 0.00% | 0.00% | 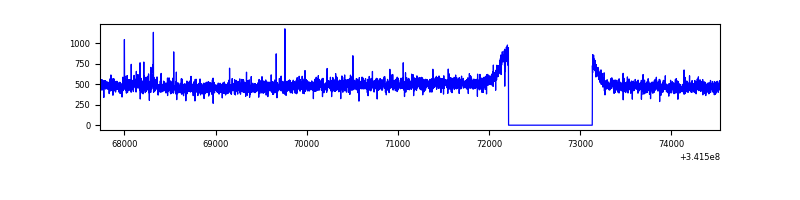 |
| B | 6804 | 5884 | 27 | 27 | 0.40% | 0.46% | 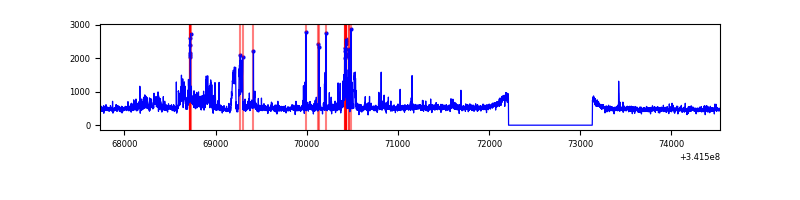 |
| C | 6804 | 5884 | 3 | 3 | 0.04% | 0.05% | 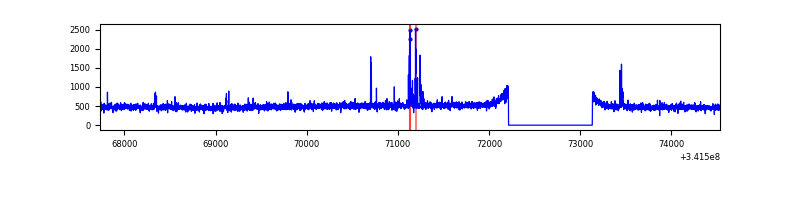 |
| D | 6804 | 5885 | 25 | 25 | 0.37% | 0.42% | 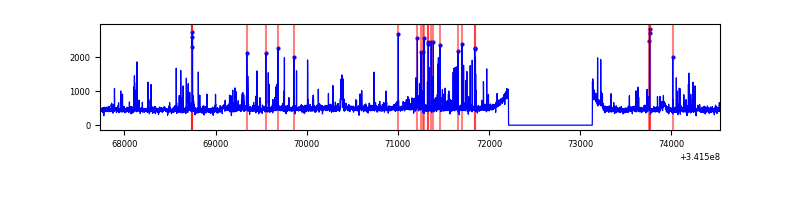 |
Top three noisy pixels from each quadrant. If the there are fewer than three noisy pixels in the level2.evt file, extra rows are filled as -1
| Pixel properties | Quadrant properties | ||||||
|---|---|---|---|---|---|---|---|
| Quadrant | DetID | PixID | Counts | Sigma | Mean | Median | Sigma |
| A | 6 | 16 | 11546 | 71.56 | 746 | 731 | 151.1 |
| A | 13 | 254 | 9733 | 59.56 | 746 | 731 | 151.1 |
| A | 3 | 137 | 6958 | 41.2 | 746 | 731 | 151.1 |
| B | 3 | 64 | 368830 | 2594.11 | 734 | 715 | 141.9 |
| B | 15 | 32 | 106320 | 744.2 | 734 | 715 | 141.9 |
| B | 0 | 230 | 24802 | 169.74 | 734 | 715 | 141.9 |
| C | 14 | 238 | 113161 | 669.23 | 710 | 713 | 168.0 |
| C | 10 | 22 | 41714 | 244.02 | 710 | 713 | 168.0 |
| C | 10 | 5 | 17252 | 98.43 | 710 | 713 | 168.0 |
| D | 1 | 52 | 265479 | 1536.91 | 721 | 700 | 172.3 |
| D | 2 | 250 | 36587 | 208.31 | 721 | 700 | 172.3 |
| D | 2 | 234 | 21637 | 121.53 | 721 | 700 | 172.3 |
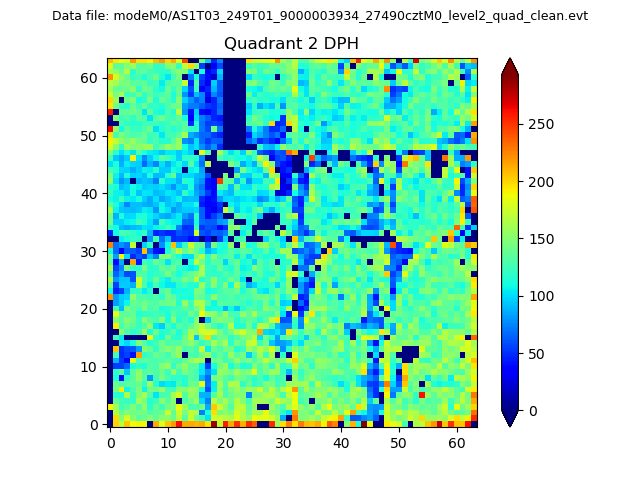
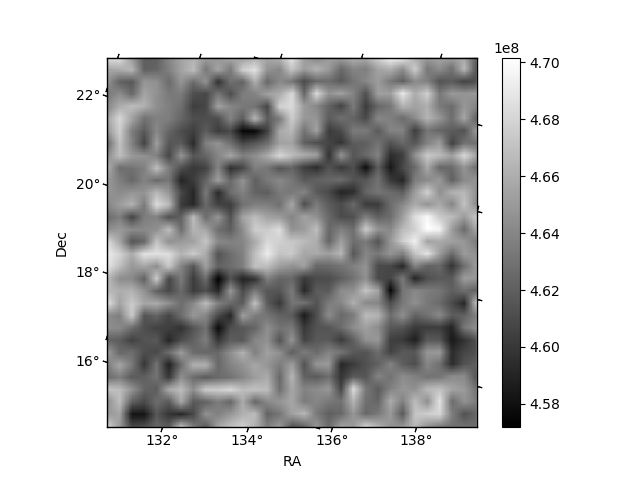
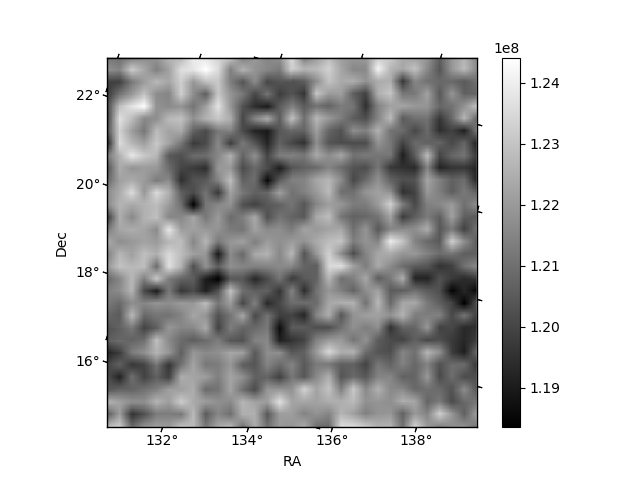
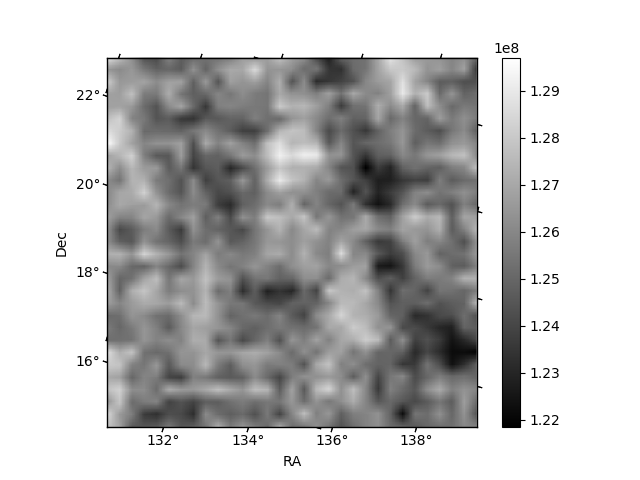
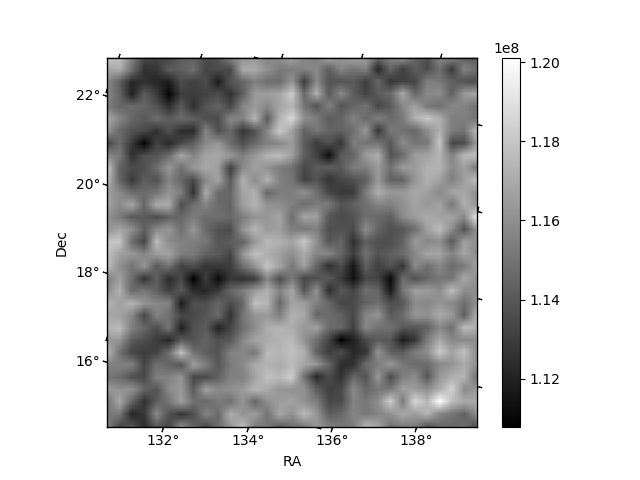
Histogram calculated using DETX and DETY for each event in the final _common_clean file
| Quadrant A | 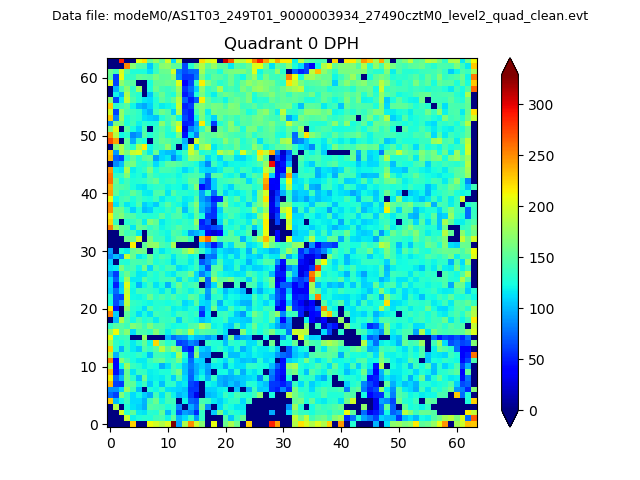 |
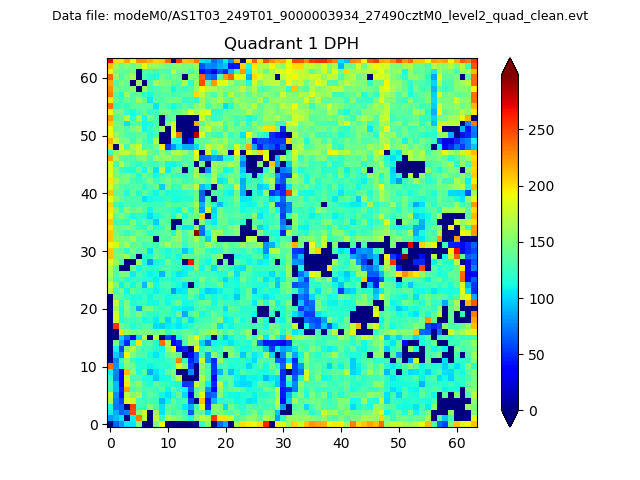 |
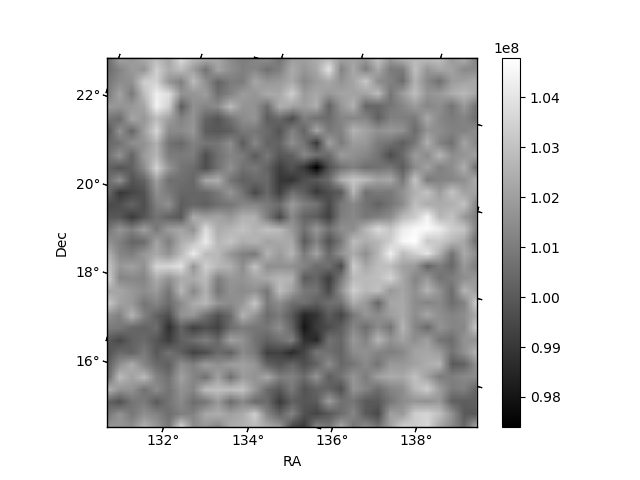
Quadrant B |
|---|---|---|---|
| Quadrant D | 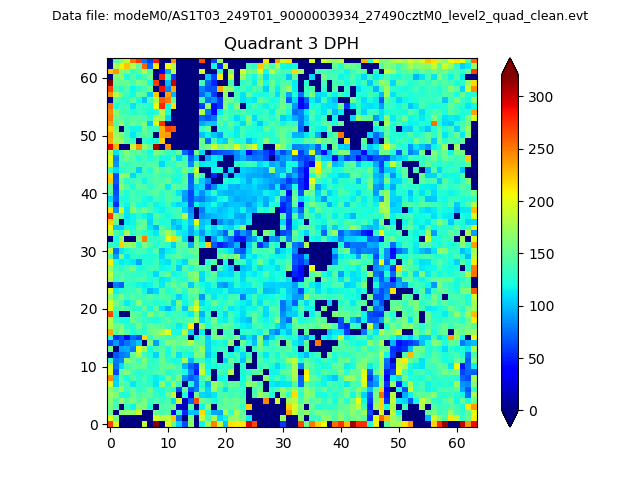 |
 |
Quadrant C |
| Plot type | Count rate plots | Images |
|---|---|---|
| Comparison with Poisson distribution Blue bars denote a histogram of data divided into 1 sec bins. Red curve is a Poisson curve with rate = median count rate of data. |
 |
 |
| Quadrant-wise count rates Data is divided into 100 sec bins |
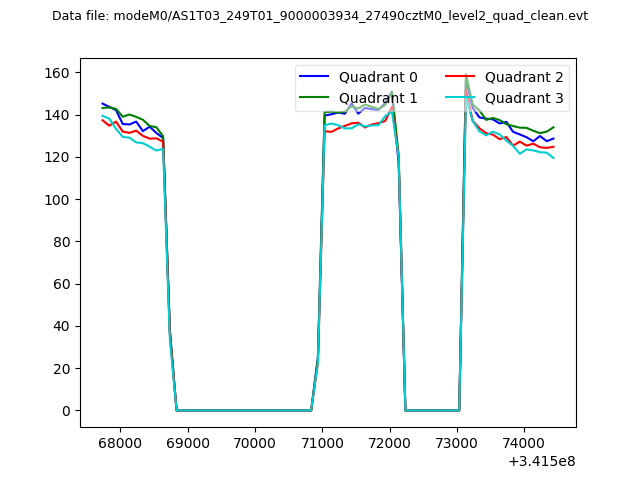 |
|
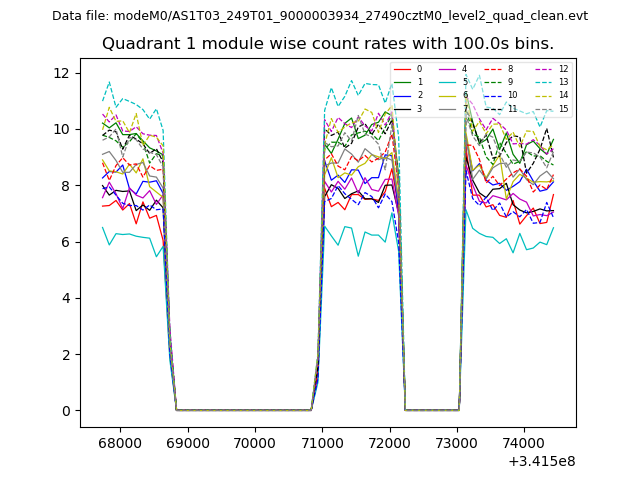
| Module-wise count rates for Quadrant A Data is divided into 100 sec bins |
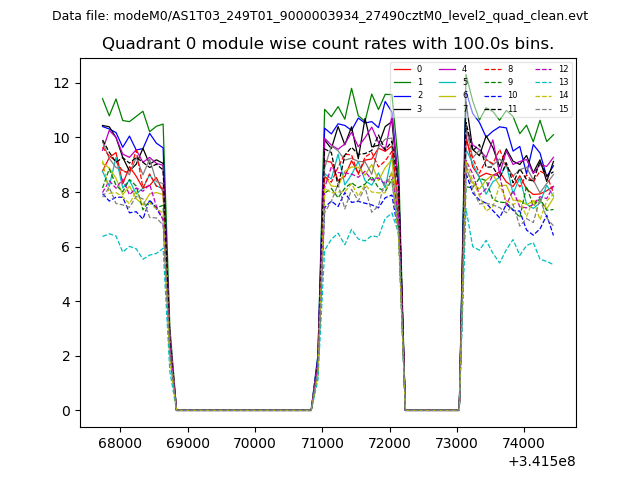 |
 |
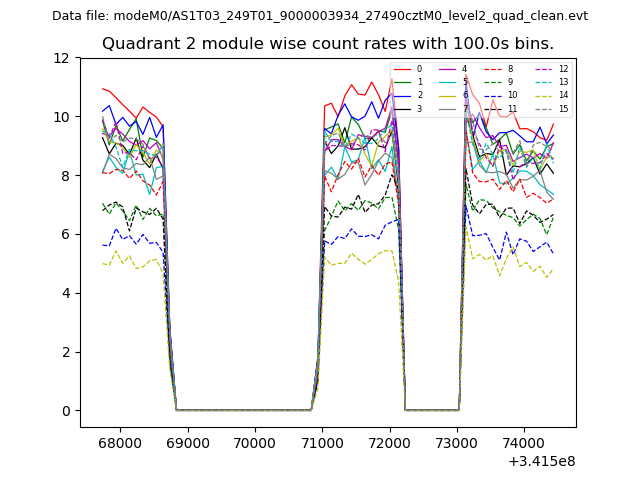
| Module-wise count rates for Quadrant B Data is divided into 100 sec bins |
 |
 |
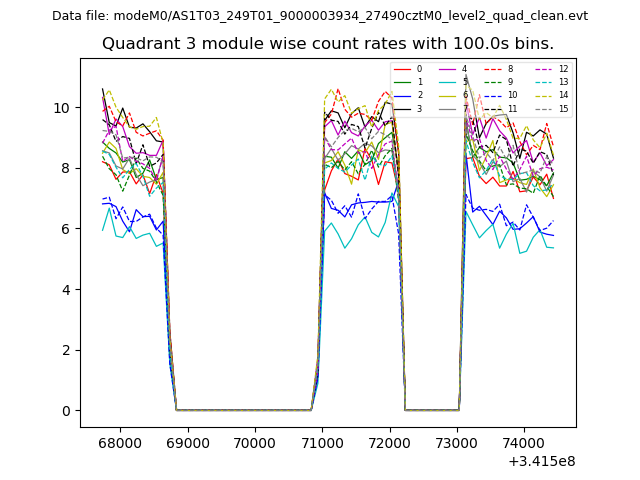
| Module-wise count rates for Quadrant C Data is divided into 100 sec bins |
 |
 |
| Module-wise count rates for Quadrant D Data is divided into 100 sec bins |
 |
 |
| Parameter | Plot |
|---|---|
| CZT HV Monitor | 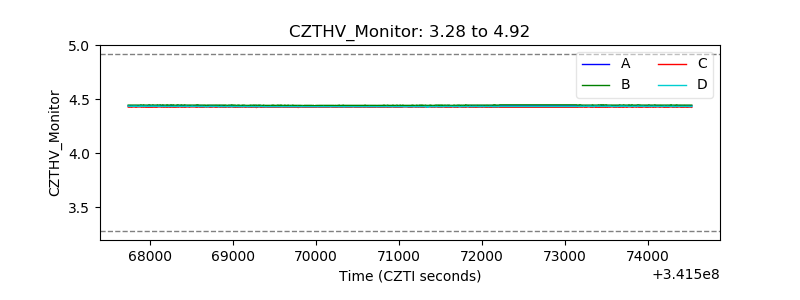 |
| D_VDD | 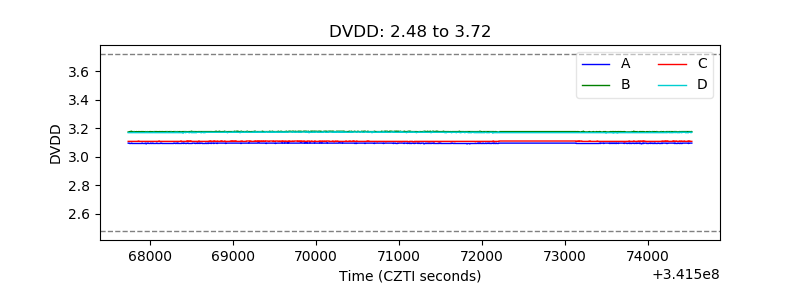 |
| Temperature 1 | 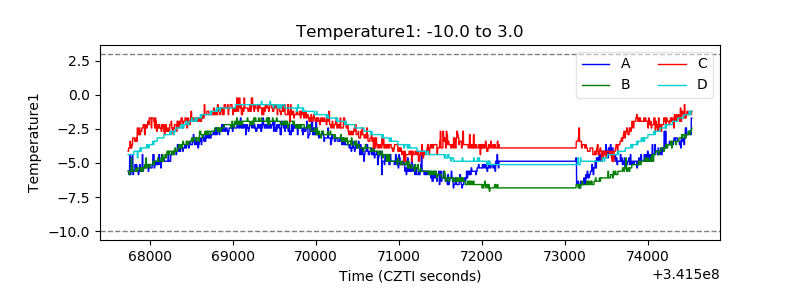 |
| Veto HV Monitor | 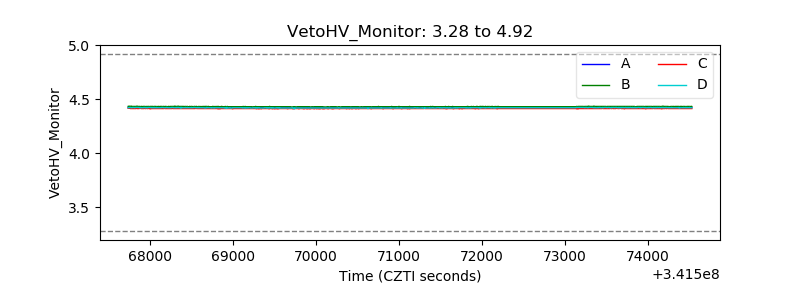 |
| Veto LLD | 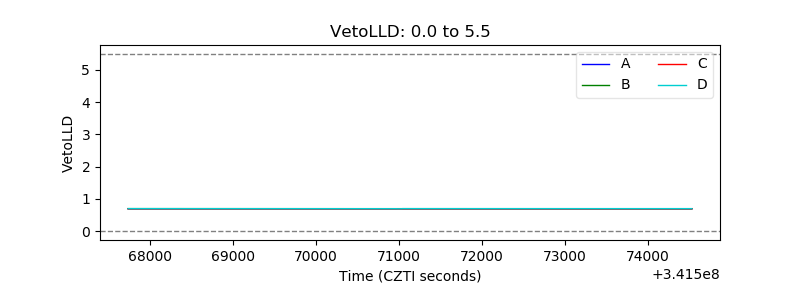 |
| Alpha Counter | 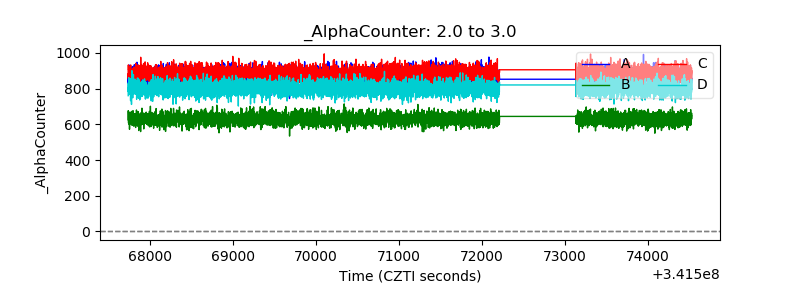 |
| _CPM_Rate | 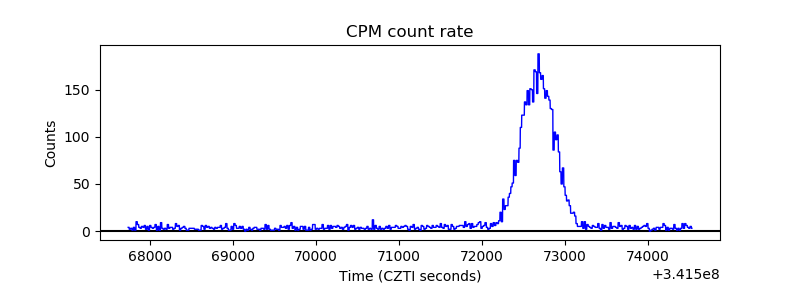 |
| CZT Counter | 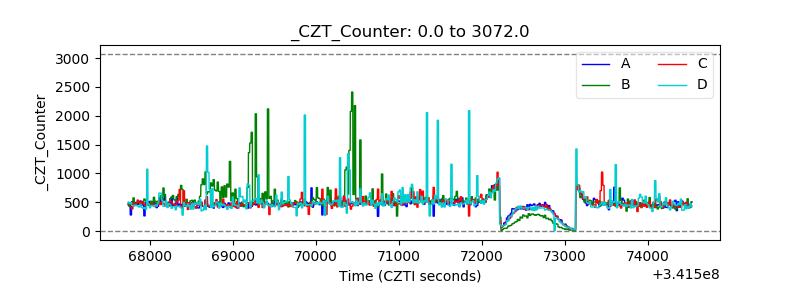 |
| +2.5 Volts monitor |  |
| +5 Volts monitor | 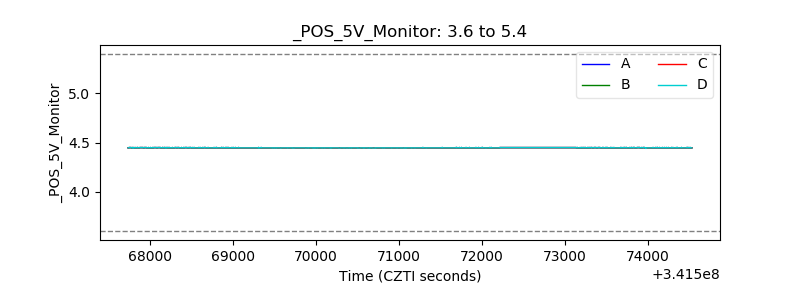 |
| _ROLL_ROT | 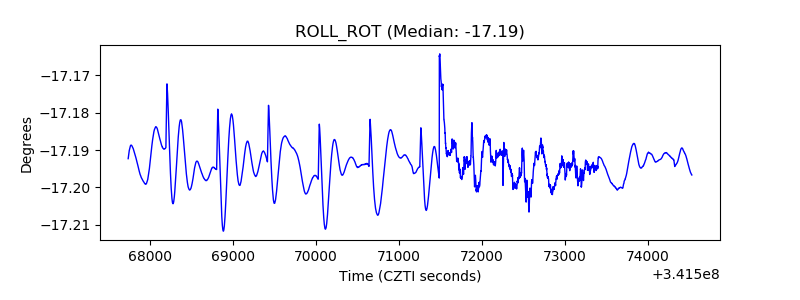 |
| _Roll_DEC | 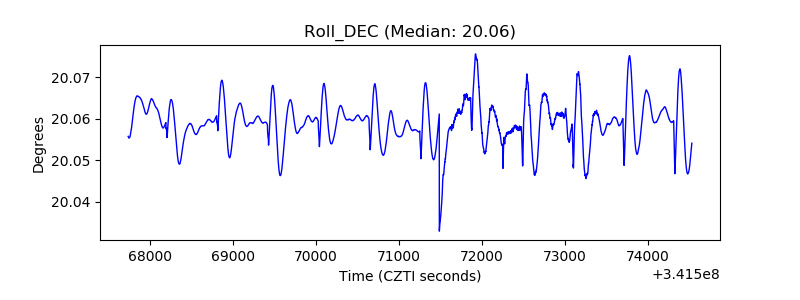 |
| _Roll_RA | 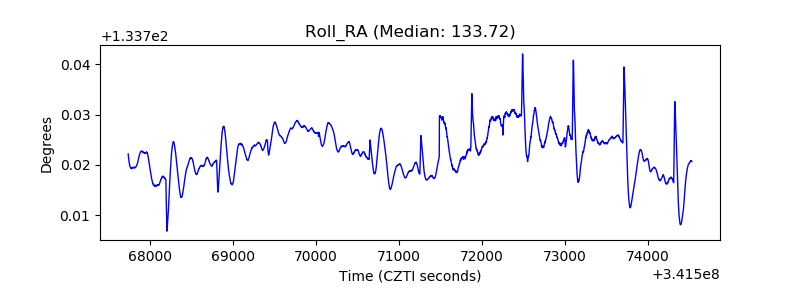 |
| Veto Counter | 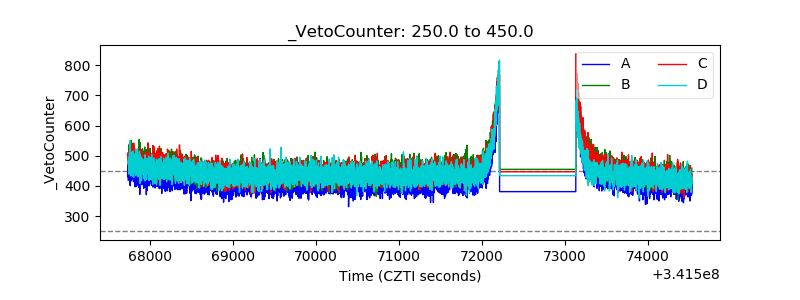 |