| Param | Original file | Final file |
|---|---|---|
| Filename | modeM0/AS1T03_249T01_9000003934_27491cztM0_level2.evt | modeM0/AS1T03_249T01_9000003934_27491cztM0_level2_quad_clean.evt |
| Size (bytes) | 498,562,560 | 92,954,880 |
| Size | 475.5 MB | 88.6 MB |
| Events in quadrant A | 3,346,855 | 593,950 |
| Events in quadrant B | 3,647,821 | 598,862 |
| Events in quadrant C | 3,397,546 | 572,350 |
| Events in quadrant D | 4,232,683 | 563,629 |
| Mode M0 | |||
|---|---|---|---|
| Quadrant | BADHDUFLAG | Total packets | Discarded packets |
| A | 0 | 14261 | 0 |
| B | 0 | 15054 | 0 |
| C | 0 | 14381 | 0 |
| D | 0 | 17164 | 0 |
| Mode M9 | |||
|---|---|---|---|
| Quadrant | BADHDUFLAG | Total packets | Discarded packets |
| A | 0 | 5 | 0 |
| B | 0 | 5 | 0 |
| C | 0 | 5 | 0 |
| D | 0 | 5 | 0 |
| Quadrant | Total seconds | Saturated seconds | Saturation percentage |
|---|---|---|---|
| A | 6978 | 110 | 1.576383% |
| B | 6977 | 188 | 2.694568% |
| C | 6977 | 125 | 1.791601% |
| D | 6978 | 138 | 1.977644% |
Noise dominated data is calculated using 1-second bins in cleaned event files. If a bin has >2000 counts, and if more than 50% of those come from <1% of pixels, then it is considered to be noise-dominated and hence unusable.
| Quadrant | # 1 sec bins | Bins with >0 counts | Bins with >2000 counts | High rate bins dominated by noise | Noise dominated (total time) | Noise dominated (detector-on time) | Marked lightcurve |
|---|---|---|---|---|---|---|---|
| A | 7458 | 6978 | 0 | 0 | 0.00% | 0.00% | 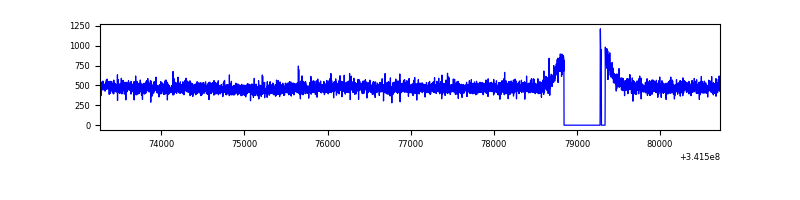 |
| B | 7457 | 6977 | 67 | 67 | 0.90% | 0.96% | 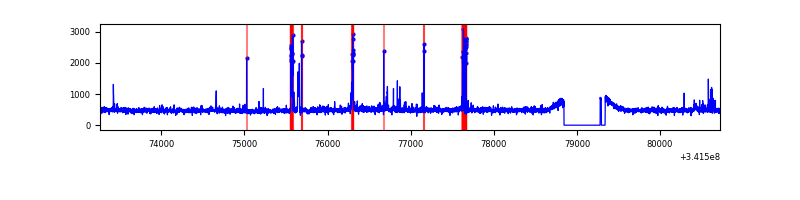 |
| C | 7457 | 6977 | 1 | 1 | 0.01% | 0.01% | 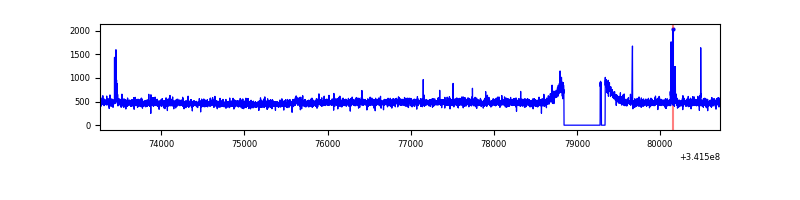 |
| D | 7458 | 6978 | 48 | 48 | 0.64% | 0.69% | 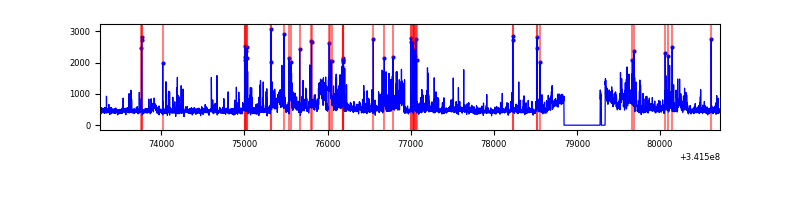 |
Top three noisy pixels from each quadrant. If the there are fewer than three noisy pixels in the level2.evt file, extra rows are filled as -1
| Pixel properties | Quadrant properties | ||||||
|---|---|---|---|---|---|---|---|
| Quadrant | DetID | PixID | Counts | Sigma | Mean | Median | Sigma |
| A | 13 | 254 | 11778 | 62.61 | 866 | 845 | 174.6 |
| A | 3 | 137 | 8171 | 41.95 | 866 | 845 | 174.6 |
| A | 0 | 226 | 7572 | 38.52 | 866 | 845 | 174.6 |
| B | 3 | 64 | 245824 | 1493.89 | 853 | 832 | 164.0 |
| B | 0 | 230 | 29367 | 174.0 | 853 | 832 | 164.0 |
| B | 12 | 111 | 20352 | 119.03 | 853 | 832 | 164.0 |
| C | 14 | 238 | 129632 | 662.21 | 827 | 832 | 194.5 |
| C | 2 | 16 | 31193 | 156.1 | 827 | 832 | 194.5 |
| C | 10 | 5 | 11897 | 56.89 | 827 | 832 | 194.5 |
| D | 1 | 52 | 858875 | 4276.83 | 835 | 813 | 200.6 |
| D | 12 | 227 | 77630 | 382.88 | 835 | 813 | 200.6 |
| D | 2 | 250 | 60359 | 296.79 | 835 | 813 | 200.6 |
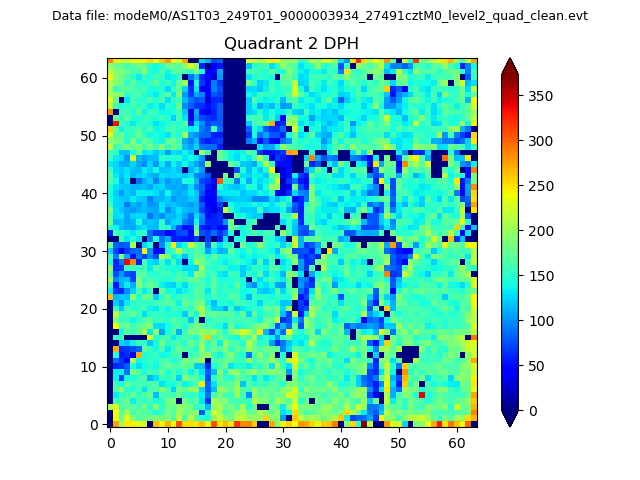
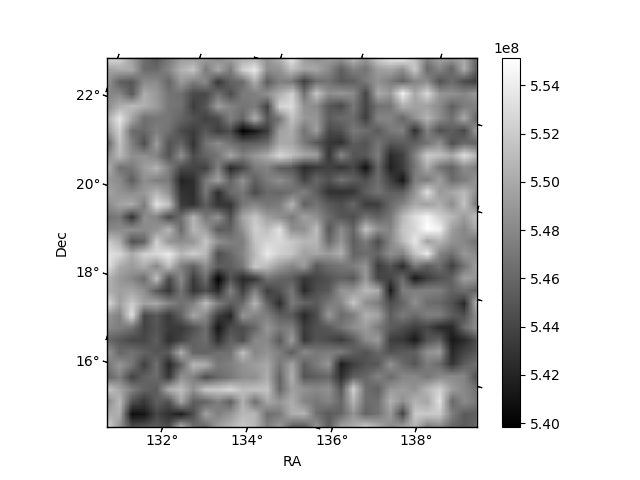
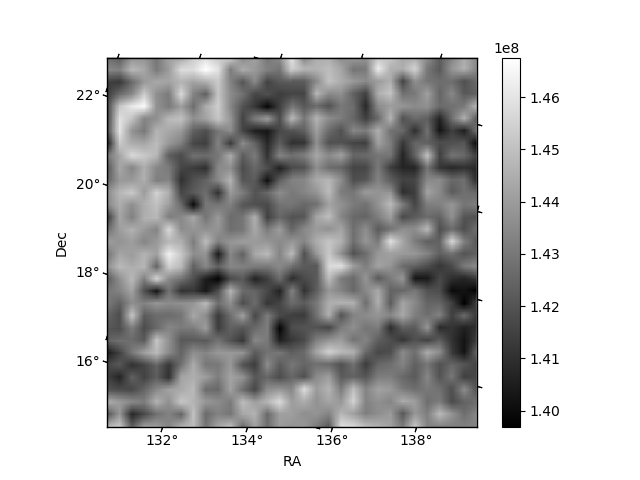
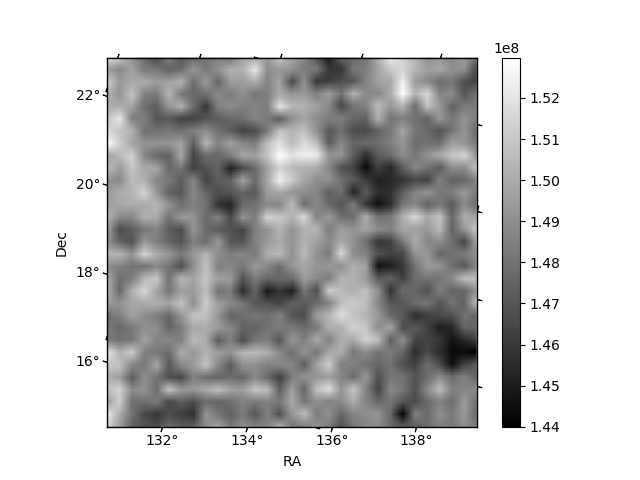
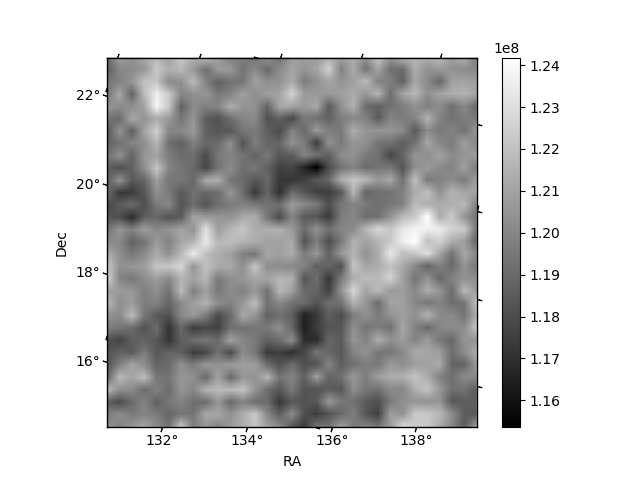
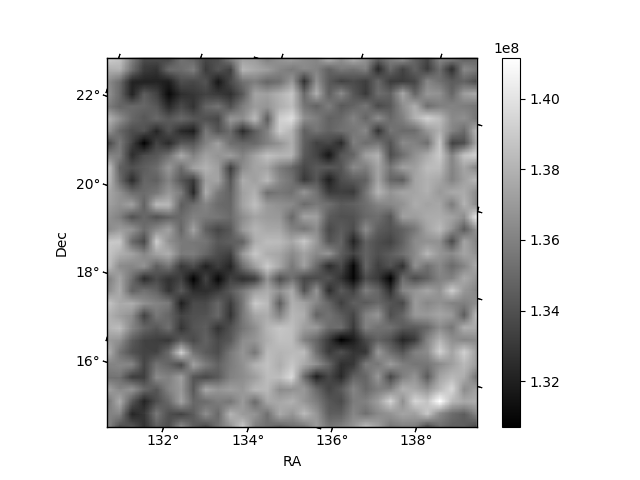
Histogram calculated using DETX and DETY for each event in the final _common_clean file
| Quadrant A | 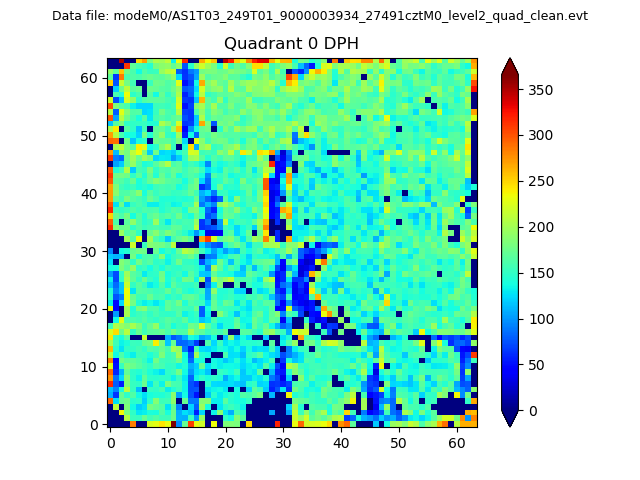 |
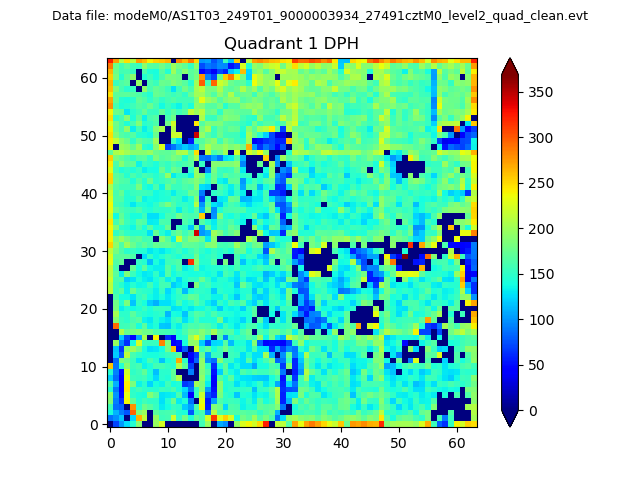 |
Quadrant B |
|---|---|---|---|
| Quadrant D | 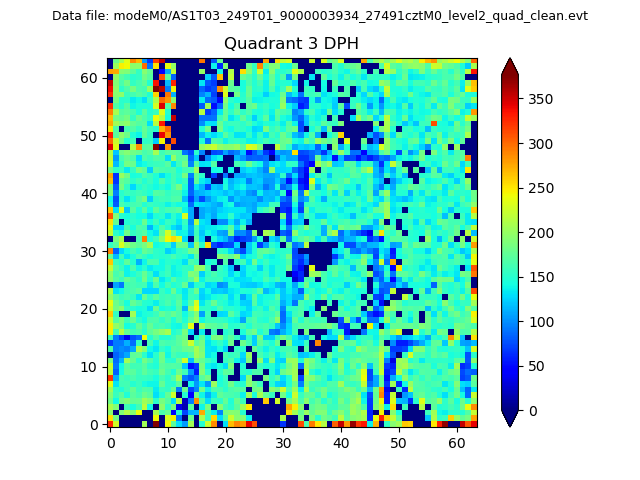 |
 |
Quadrant C |
| Plot type | Count rate plots | Images |
|---|---|---|
| Comparison with Poisson distribution Blue bars denote a histogram of data divided into 1 sec bins. Red curve is a Poisson curve with rate = median count rate of data. |
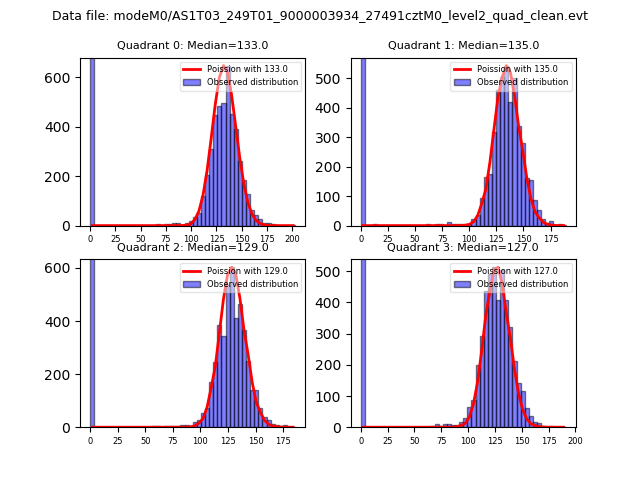 |
 |
| Quadrant-wise count rates Data is divided into 100 sec bins |
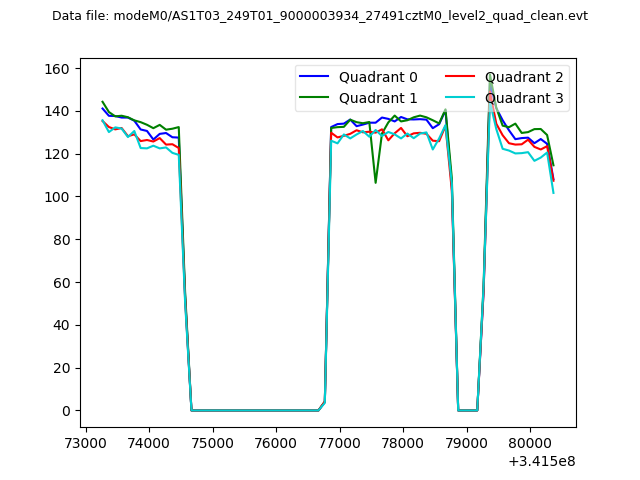 |
|
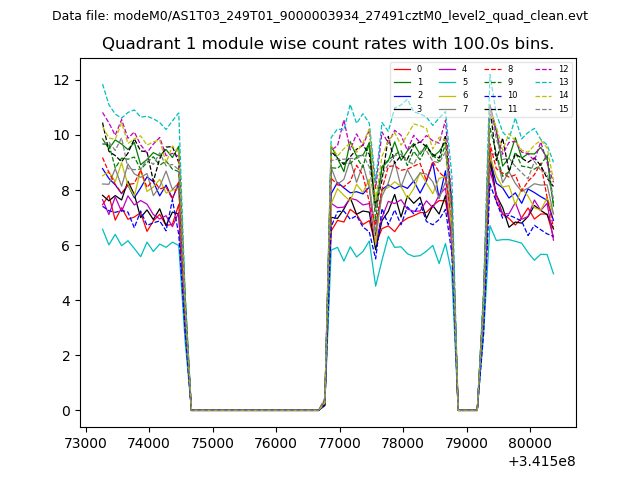
| Module-wise count rates for Quadrant A Data is divided into 100 sec bins |
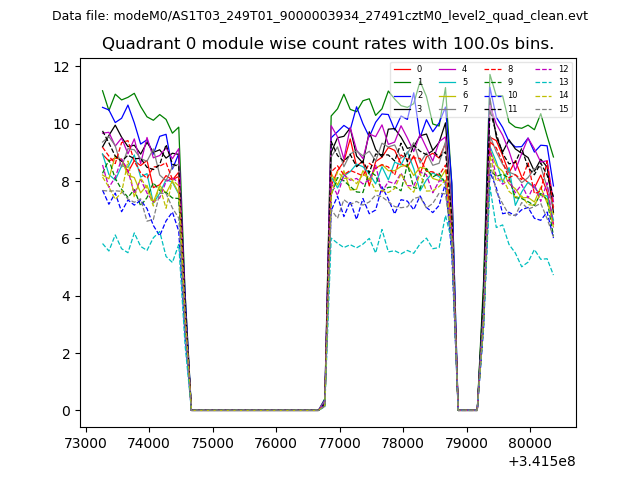 |
 |
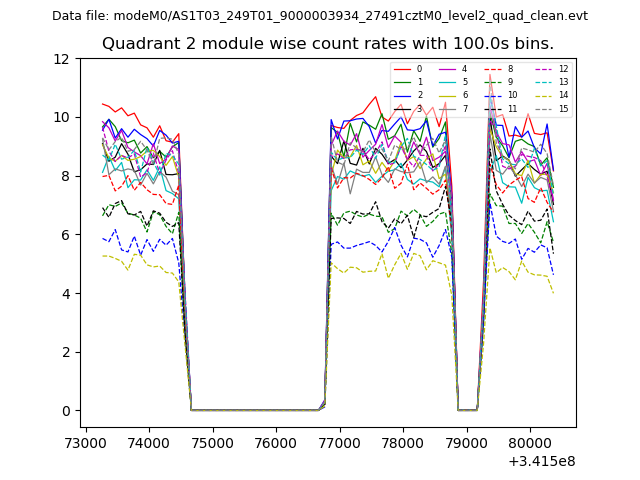
| Module-wise count rates for Quadrant B Data is divided into 100 sec bins |
 |
 |
| Module-wise count rates for Quadrant C Data is divided into 100 sec bins |
 |
 |
| Module-wise count rates for Quadrant D Data is divided into 100 sec bins |
 |
 |
| Parameter | Plot |
|---|---|
| CZT HV Monitor | 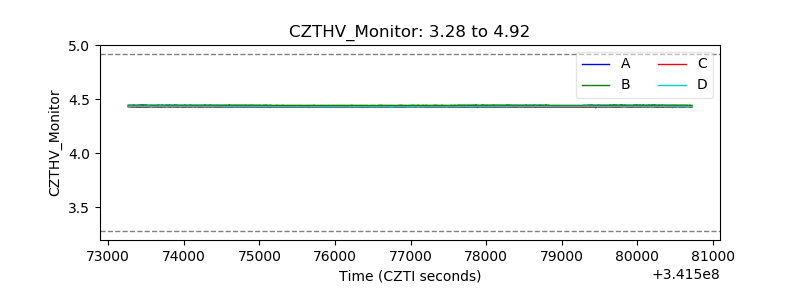 |
| D_VDD | 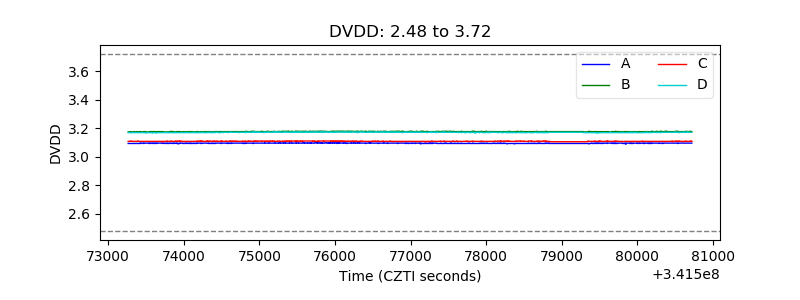 |
| Temperature 1 | 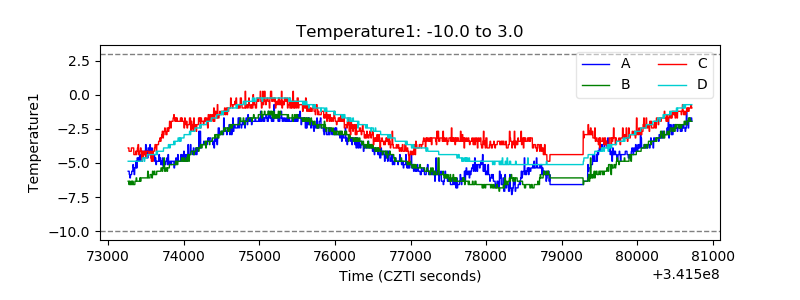 |
| Veto HV Monitor | 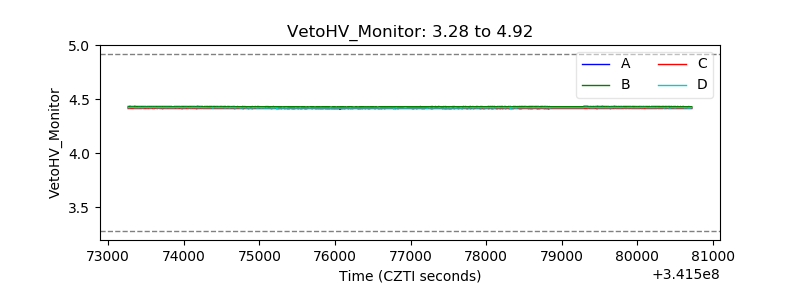 |
| Veto LLD | 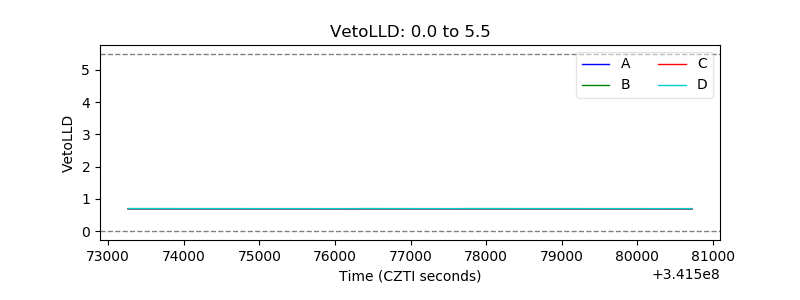 |
| Alpha Counter | 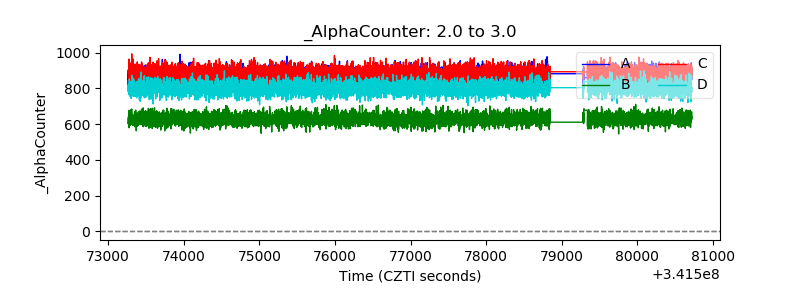 |
| _CPM_Rate | 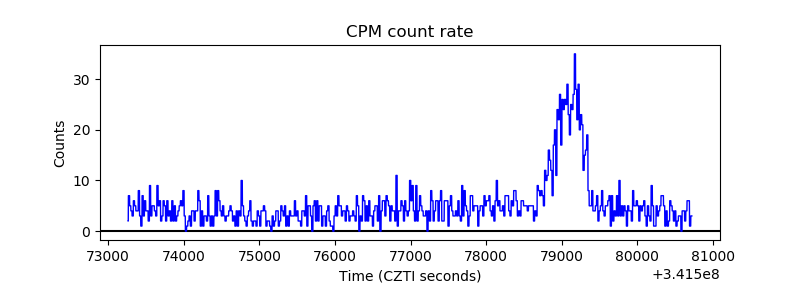 |
| CZT Counter | 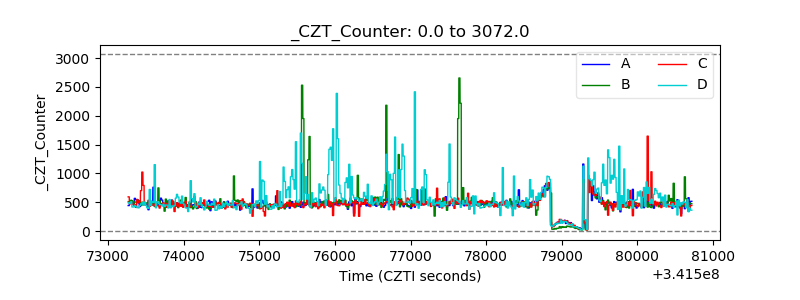 |
| +2.5 Volts monitor |  |
| +5 Volts monitor |  |
| _ROLL_ROT | 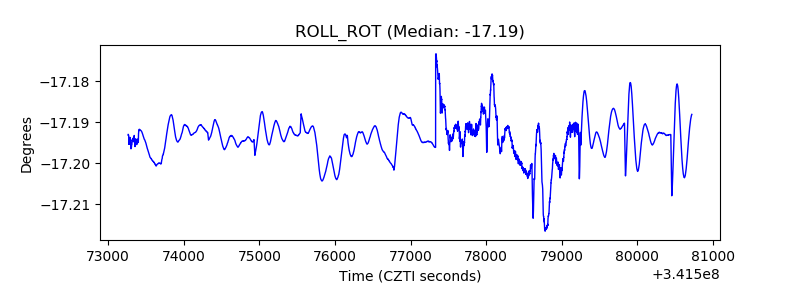 |
| _Roll_DEC | 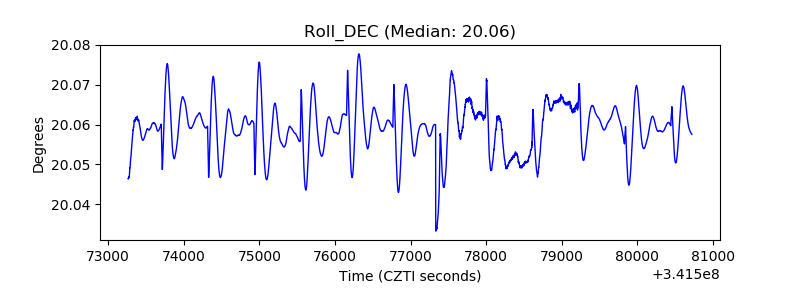 |
| _Roll_RA | 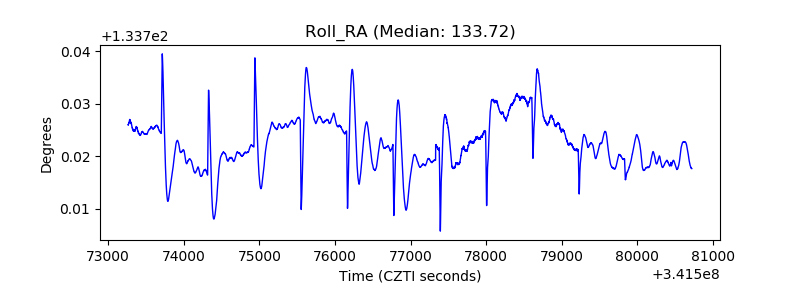 |
| Veto Counter | 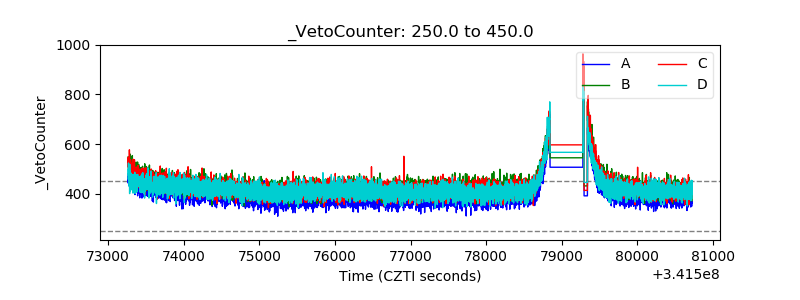 |