| Param | Original file | Final file |
|---|---|---|
| Filename | modeM0/AS1T03_249T01_9000003934_27492cztM0_level2.evt | modeM0/AS1T03_249T01_9000003934_27492cztM0_level2_quad_clean.evt |
| Size (bytes) | 587,770,560 | 93,453,120 |
| Size | 560.5 MB | 89.1 MB |
| Events in quadrant A | 3,714,085 | 590,978 |
| Events in quadrant B | 5,275,318 | 584,915 |
| Events in quadrant C | 3,738,435 | 564,657 |
| Events in quadrant D | 4,555,868 | 559,045 |
| Mode M0 | |||
|---|---|---|---|
| Quadrant | BADHDUFLAG | Total packets | Discarded packets |
| A | 0 | 15789 | 0 |
| B | 0 | 20418 | 0 |
| C | 0 | 15847 | 0 |
| D | 0 | 18612 | 0 |
| Mode M9 | |||
|---|---|---|---|
| Quadrant | BADHDUFLAG | Total packets | Discarded packets |
| A | 0 | 1 | 0 |
| B | 0 | 1 | 0 |
| C | 0 | 1 | 0 |
| D | 0 | 1 | 0 |
| Quadrant | Total seconds | Saturated seconds | Saturation percentage |
|---|---|---|---|
| A | 7613 | 194 | 2.548273% |
| B | 7613 | 762 | 10.009195% |
| C | 7613 | 235 | 3.086825% |
| D | 7612 | 243 | 3.192328% |
Noise dominated data is calculated using 1-second bins in cleaned event files. If a bin has >2000 counts, and if more than 50% of those come from <1% of pixels, then it is considered to be noise-dominated and hence unusable.
| Quadrant | # 1 sec bins | Bins with >0 counts | Bins with >2000 counts | High rate bins dominated by noise | Noise dominated (total time) | Noise dominated (detector-on time) | Marked lightcurve |
|---|---|---|---|---|---|---|---|
| A | 7728 | 7613 | 0 | 0 | 0.00% | 0.00% | 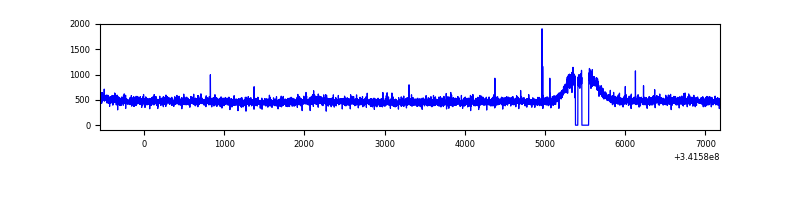 |
| B | 7728 | 7613 | 459 | 459 | 5.94% | 6.03% | 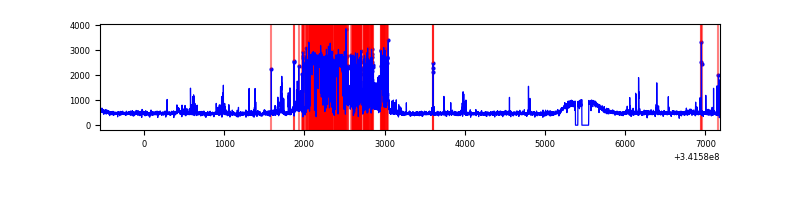 |
| C | 7728 | 7613 | 1 | 1 | 0.01% | 0.01% | 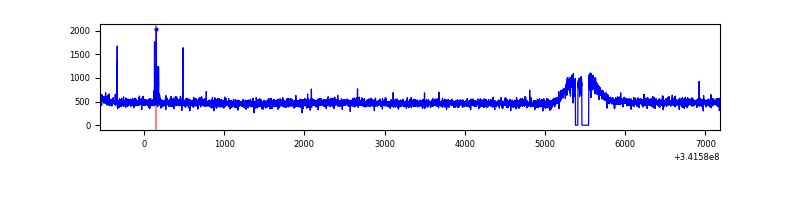 |
| D | 7727 | 7612 | 86 | 86 | 1.11% | 1.13% | 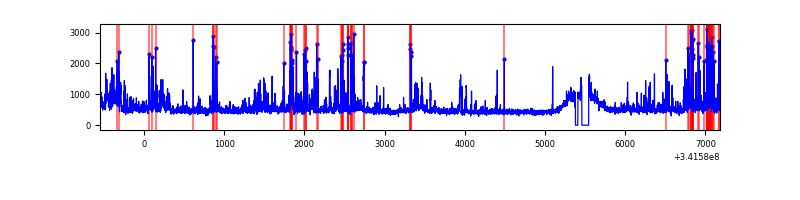 |
Top three noisy pixels from each quadrant. If the there are fewer than three noisy pixels in the level2.evt file, extra rows are filled as -1
| Pixel properties | Quadrant properties | ||||||
|---|---|---|---|---|---|---|---|
| Quadrant | DetID | PixID | Counts | Sigma | Mean | Median | Sigma |
| A | 13 | 254 | 12809 | 60.69 | 961 | 940 | 195.6 |
| A | 3 | 137 | 9398 | 43.25 | 961 | 940 | 195.6 |
| A | 0 | 226 | 8220 | 37.22 | 961 | 940 | 195.6 |
| B | 3 | 64 | 1632475 | 9205.86 | 910 | 886 | 177.2 |
| B | 0 | 230 | 22856 | 123.96 | 910 | 886 | 177.2 |
| B | 12 | 111 | 22203 | 120.28 | 910 | 886 | 177.2 |
| C | 14 | 238 | 143397 | 657.25 | 914 | 918 | 216.8 |
| C | 2 | 16 | 27632 | 123.23 | 914 | 918 | 216.8 |
| C | 13 | 61 | 6311 | 24.88 | 914 | 918 | 216.8 |
| D | 1 | 52 | 656483 | 2939.29 | 927 | 900 | 223.0 |
| D | 7 | 69 | 155707 | 694.07 | 927 | 900 | 223.0 |
| D | 2 | 250 | 83718 | 371.31 | 927 | 900 | 223.0 |
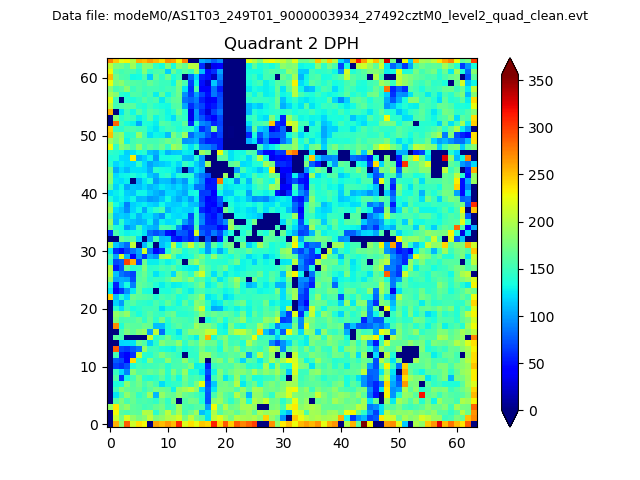
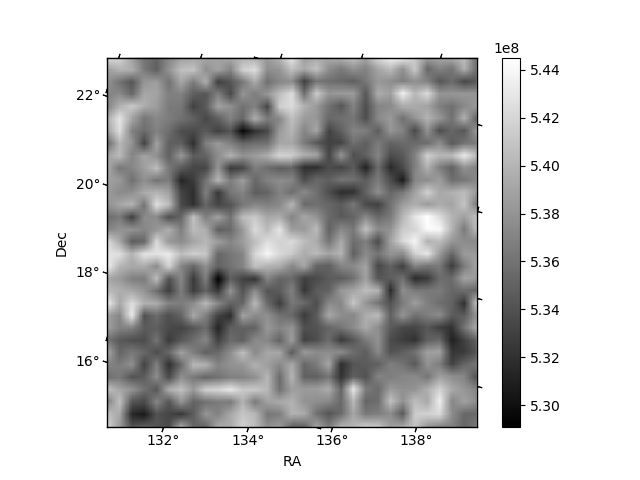
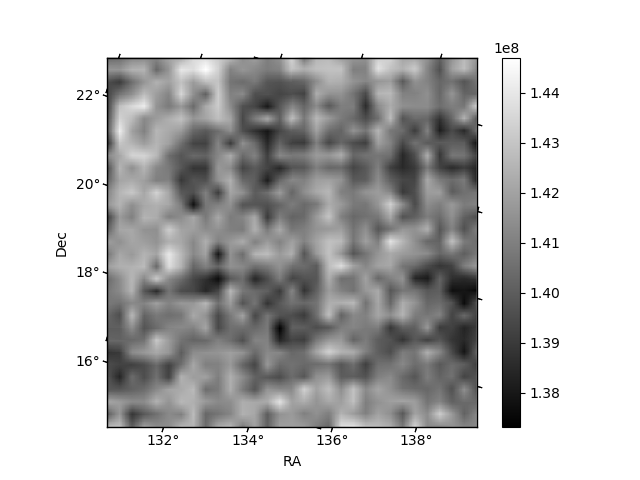
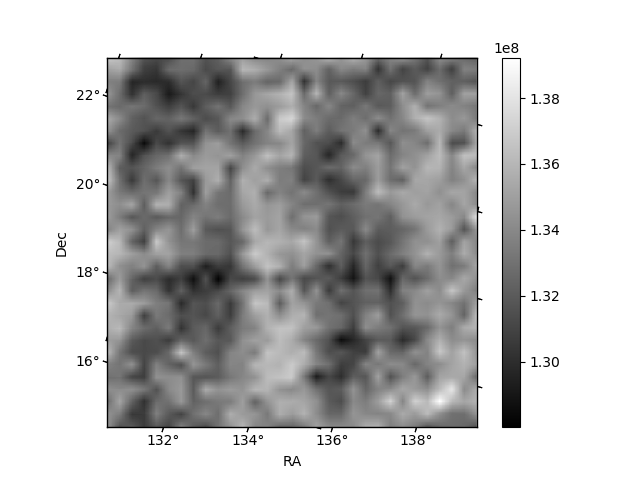
Histogram calculated using DETX and DETY for each event in the final _common_clean file
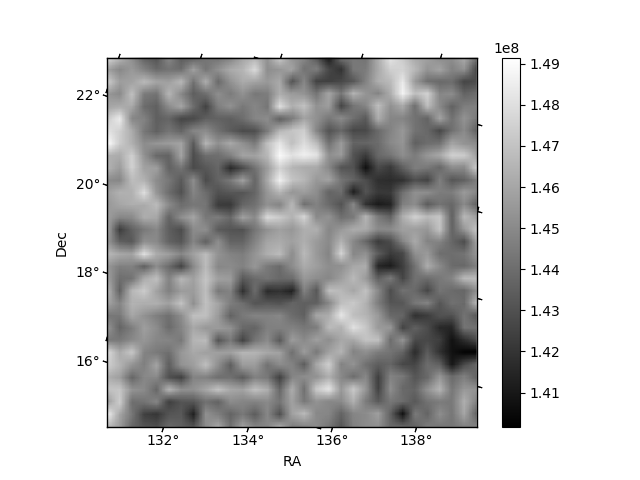
| Quadrant A | 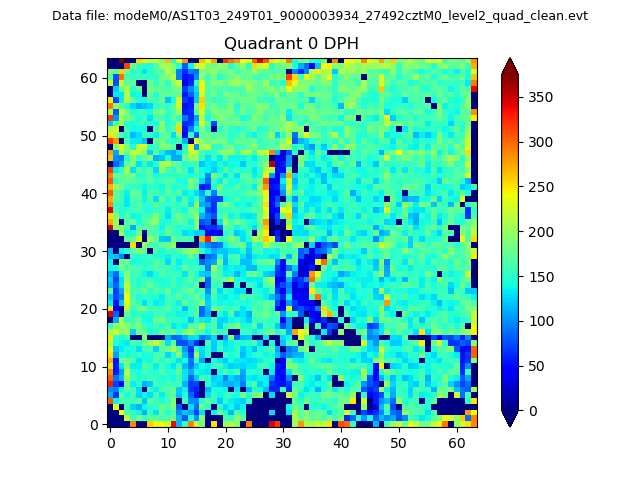 |
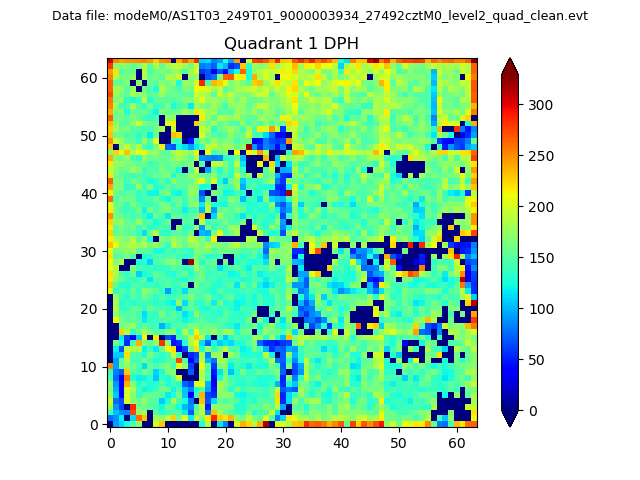 |
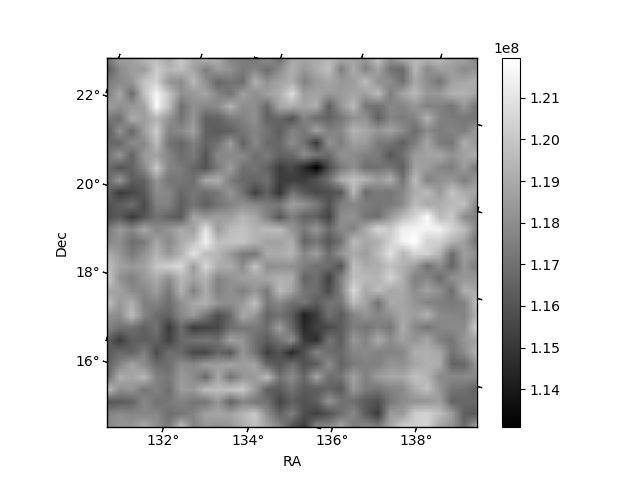
Quadrant B |
|---|---|---|---|
| Quadrant D | 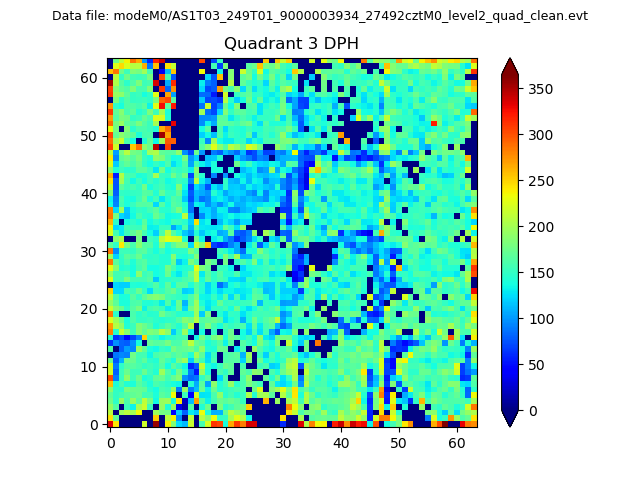 |
 |
Quadrant C |
| Plot type | Count rate plots | Images |
|---|---|---|
| Comparison with Poisson distribution Blue bars denote a histogram of data divided into 1 sec bins. Red curve is a Poisson curve with rate = median count rate of data. |
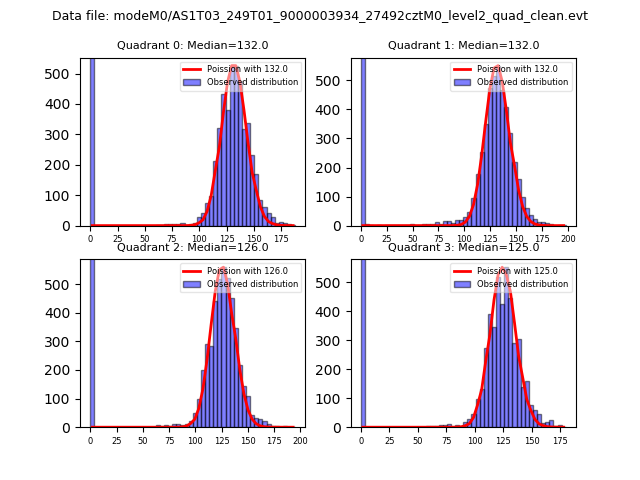 |
 |
| Quadrant-wise count rates Data is divided into 100 sec bins |
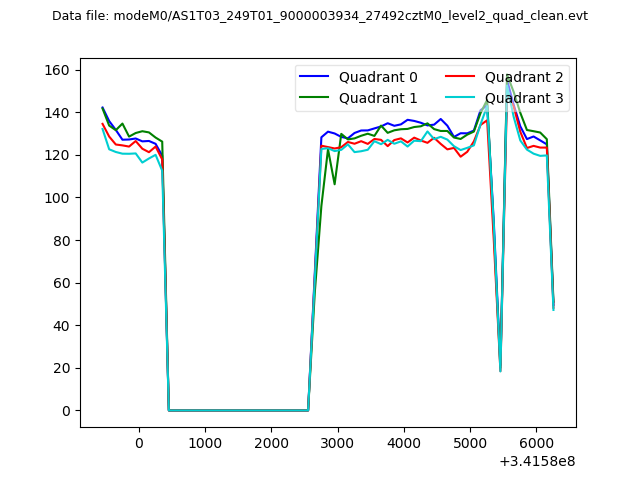 |
|
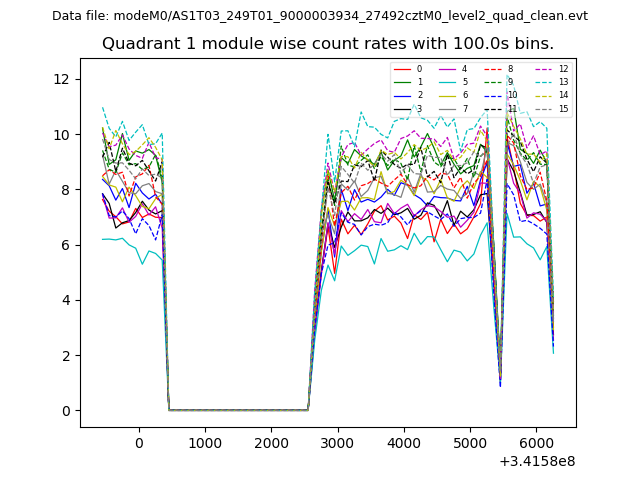
| Module-wise count rates for Quadrant A Data is divided into 100 sec bins |
 |
 |
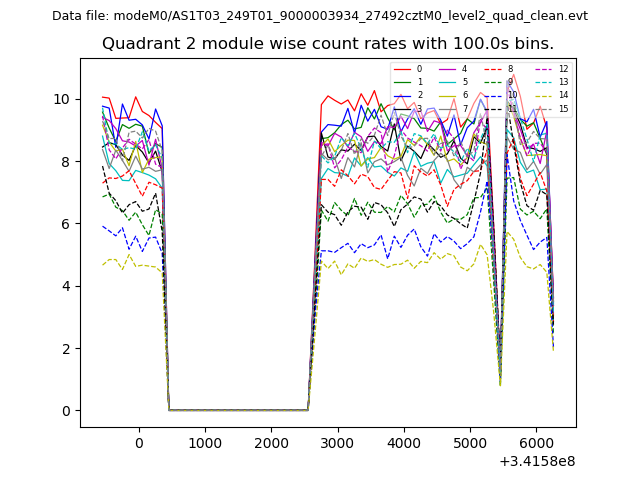
| Module-wise count rates for Quadrant B Data is divided into 100 sec bins |
 |
 |
| Module-wise count rates for Quadrant C Data is divided into 100 sec bins |
 |
 |
| Module-wise count rates for Quadrant D Data is divided into 100 sec bins |
 |
 |
| Parameter | Plot |
|---|---|
| CZT HV Monitor |  |
| D_VDD | 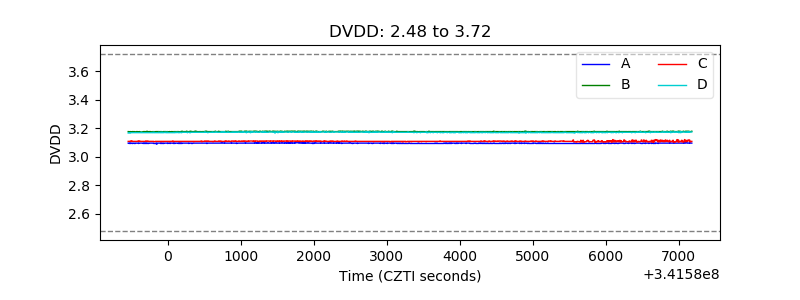 |
| Temperature 1 | 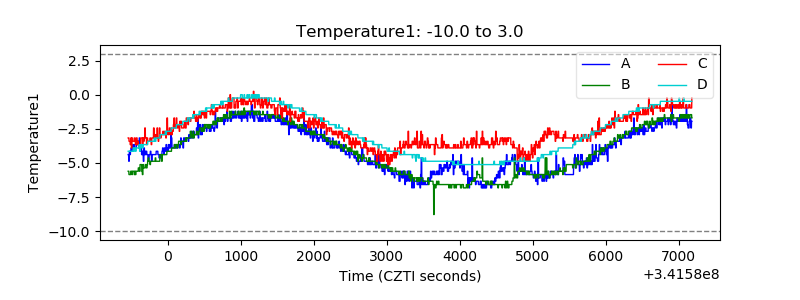 |
| Veto HV Monitor | 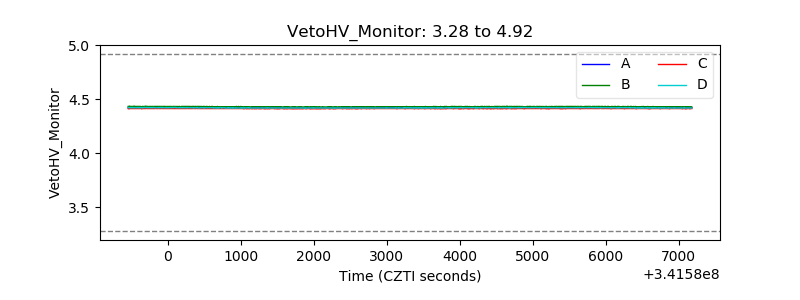 |
| Veto LLD | 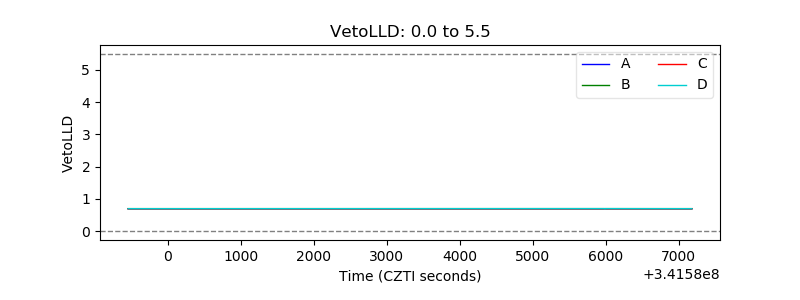 |
| Alpha Counter | 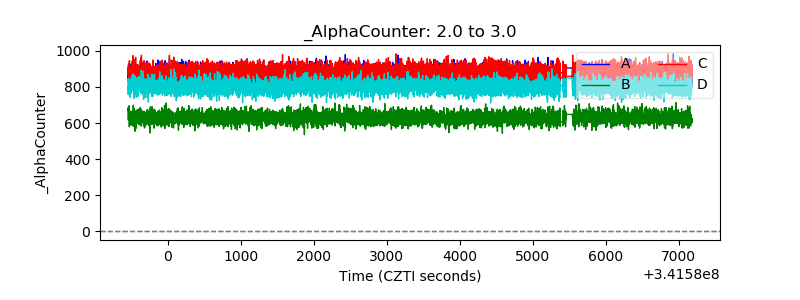 |
| _CPM_Rate | 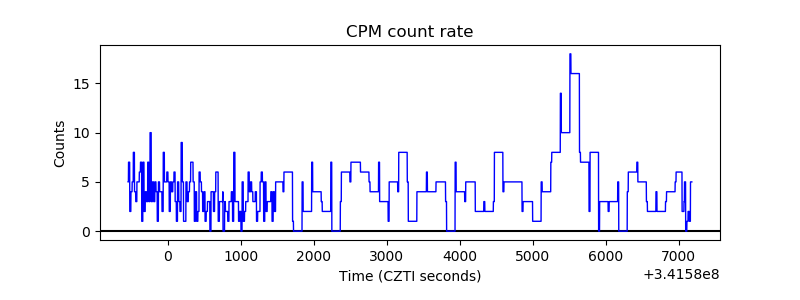 |
| CZT Counter | 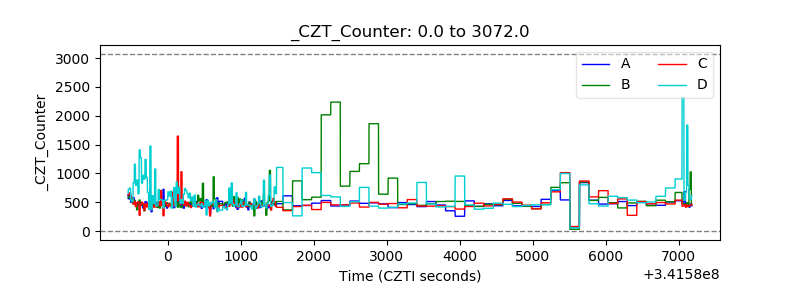 |
| +2.5 Volts monitor |  |
| +5 Volts monitor |  |
| _ROLL_ROT | 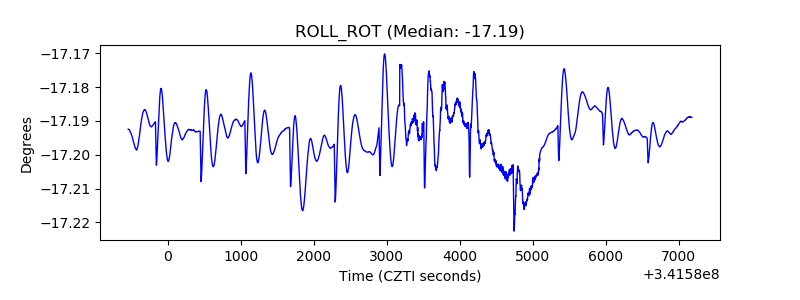 |
| _Roll_DEC | 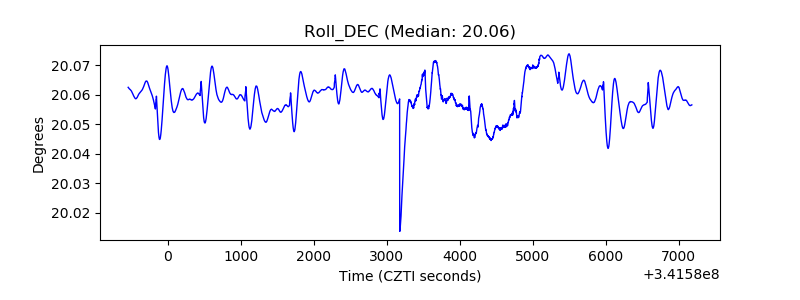 |
| _Roll_RA | 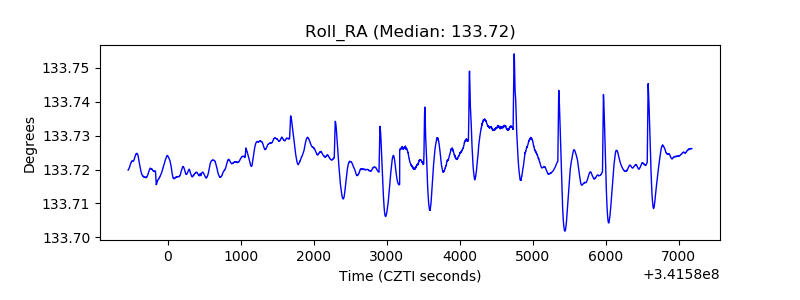 |
| Veto Counter | 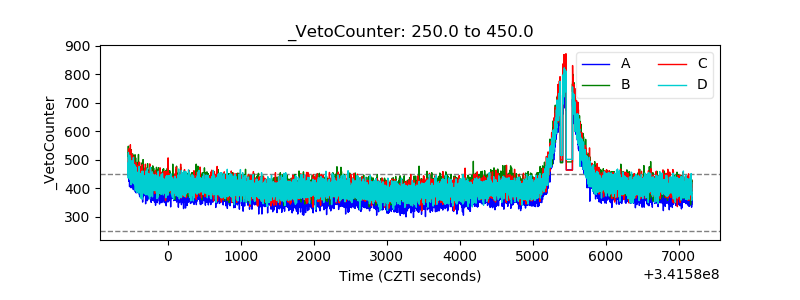 |